

The DOI matches its Crossref record; 4 of the 4 references it cites were found in a registry or an index.
Identification of miRNAs regulating MAPT expression and their analysis in plasma of patients with dementia
Abstract
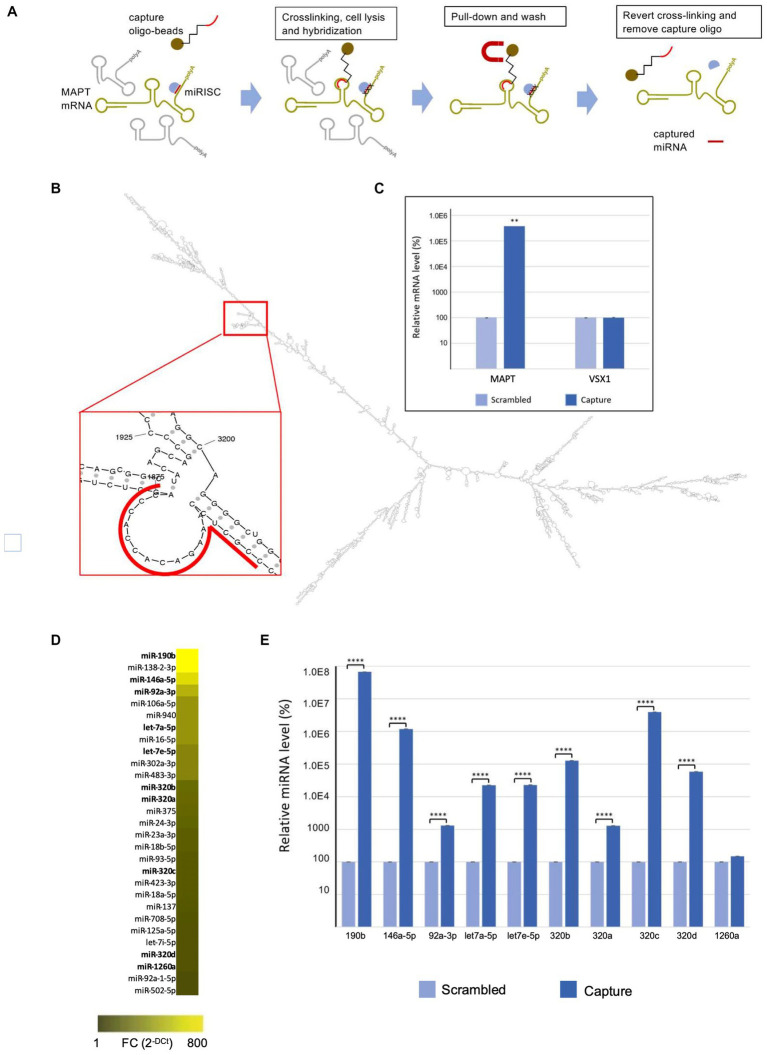
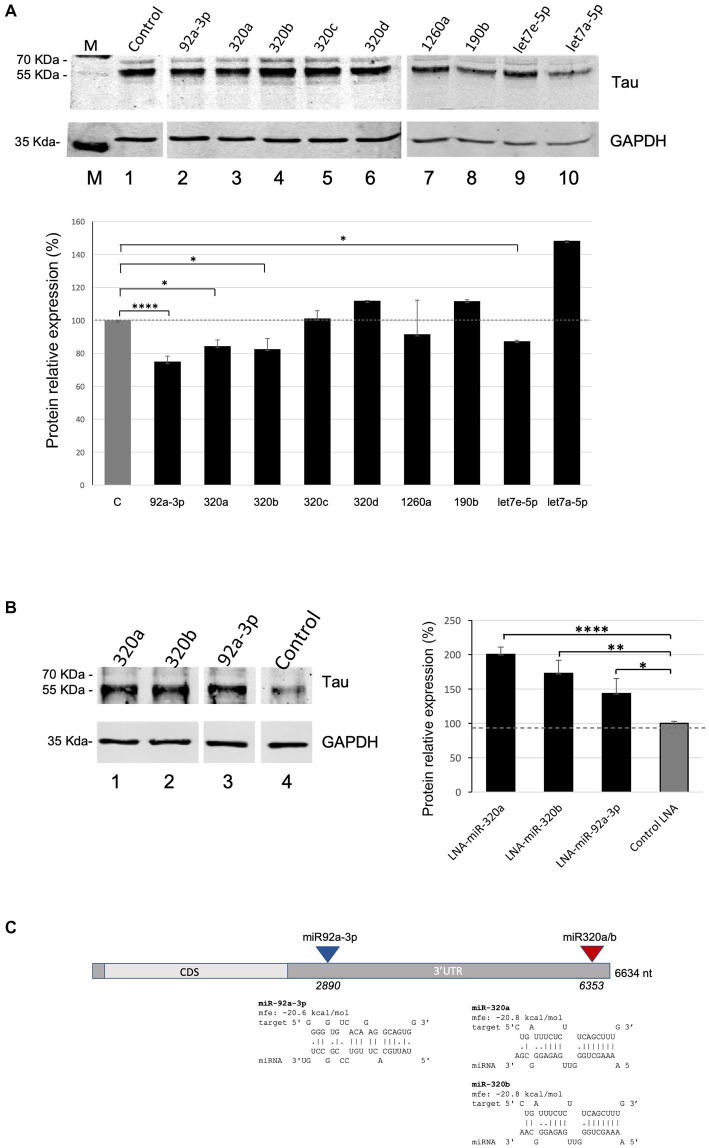
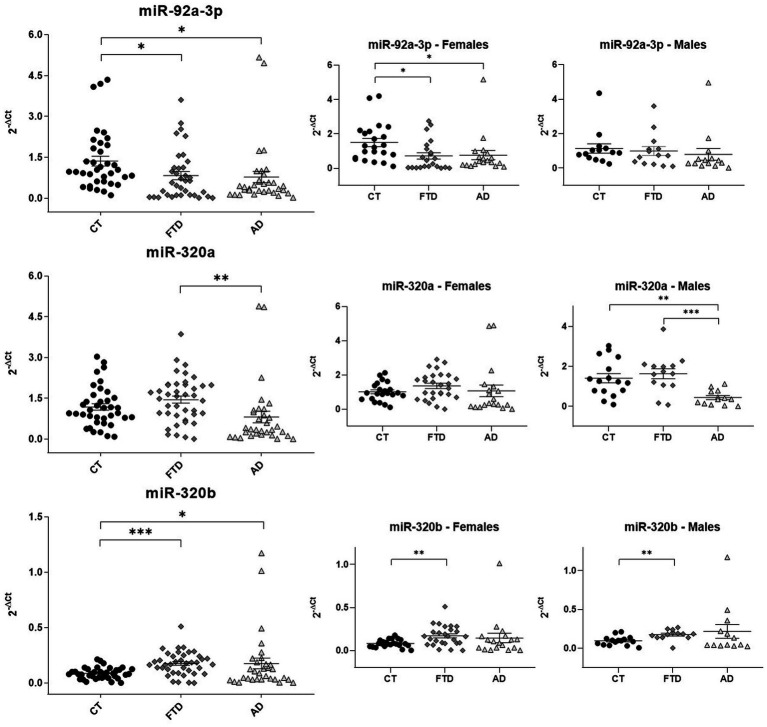
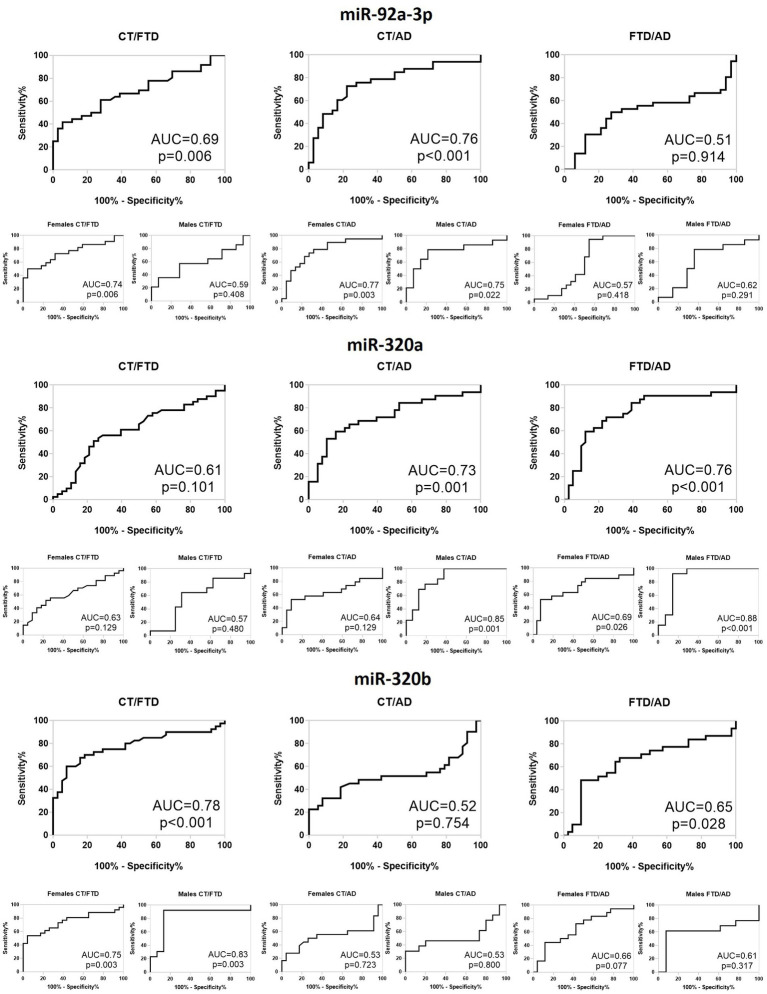
Background: Dementia is one of the most common diseases in elderly people and hundreds of thousand new cases per year of Alzheimer’s disease (AD) are estimated. While the recent decade has seen significant advances in the development of novel biomarkers to identify dementias at their early stage, a great effort has been recently made to identify biomarkers able to improve differential diagnosis. However, only few potential candidates, mainly detectable in cerebrospinal fluid (CSF), have been described so far. Methods: We searched for miRNAs regulating MAPT translation. We employed a capture technology able to find the miRNAs directly bound to the MAPT transcript in cell lines. Afterwards, we evaluated the levels of these miRNAs in plasma samples from FTD (n = 42) and AD patients (n = 33) and relative healthy controls (HCs) (n = 42) by using qRT-PCR. Results: Firstly, we found all miRNAs that interact with the MAPT transcript. Ten miRNAs have been selected to verify their effect on Tau levels increasing or reducing miRNA levels by using cell transfections with plasmids expressing the miRNAs genes or LNA antagomiRs. Following the results obtained, miR-92a-3p, miR-320a and miR-320b were selected to analyse their levels in plasma samples of patients with FTD and AD respect to HCs. The analysis showed that the miR-92a-1-3p was under-expressed in both AD and FTD compared to HCs. Moreover, miR-320a was upregulated in FTD vs. AD patients, particularly in men when we stratified by sex. Respect to HC, the only difference is showed in men with AD who have reduced levels of this miRNA. Instead, miR-320b is up-regulated in both dementias, but only patients with FTD maintain this trend in both genders. Conclusions: Our results seem to identify miR-92a-3p and miR-320a as possible good biomarkers to discriminate AD from HC, while miR-320b to discriminate FTD from HC, particularly in males. Combining three miRNAs improves the accuracy only in females, particularly for differential diagnosis (FTD vs. AD) and to distinguish FTD from HC.
Overview
The claims and statistics of this paper haven’t been checked yet.
Run the check — free, no account needed. It reads the open-access text and checks the sources it cites.
Integrity signals
Registry
Cites
Statistics
Figures
Verification
Claims the paper makes
The claims and statistics of this paper haven’t been checked yet.
Run the check — free, no account needed. It reads the open-access text and checks the sources it cites.
Claims other papers make about this one
Each is checked against this paper’s own text: does it say what the citing paper says it does?
The cited source says what the claim attributes to it.
In the citing paper
“In contrast, miR-320a resulted higher in subjects with FTD than in subjects with AD, without any significant difference among controls [34].”
From miR-92a-3p and miR-320a are Upregulated in Plasma Neuron-Derived Extracellular Vesicles of Patients with Frontotemporal Dementia (2025) · cites this paper as [34]
In the citing paper
“In our previous study, we proposed three different miRNAs as diagnostic plasma-biomarkers candidates for AD and FTD: miR-92a-3p, miR-320a and miR-320b [34].”
From miR-92a-3p and miR-320a are Upregulated in Plasma Neuron-Derived Extracellular Vesicles of Patients with Frontotemporal Dementia (2025) · cites this paper as [34]
In the citing paper
“These results are consistent among them, confirming that the differences in miRNA levels seen in the plasma of patients with AD [34] likely do not stem from the brain.”
From miR-92a-3p and miR-320a are Upregulated in Plasma Neuron-Derived Extracellular Vesicles of Patients with Frontotemporal Dementia (2025) · cites this paper as [34]
In the citing paper
“Particularly, the downregulation of miR-92-3p and the upregulation of miR-320b in patients with FTD or AD compared with neurologically unimpaired controls were observed.”
From miR-92a-3p and miR-320a are Upregulated in Plasma Neuron-Derived Extracellular Vesicles of Patients with Frontotemporal Dementia (2025) · cites this paper as [34]
In the citing paper
“In a previous study, we identified three circulating miRNAs (miR-92a-3p, miR-320a and miR-320b) differentially expressed in FTD patients with respect to healthy controls and/or Alzheimer’s disease (AD) patients.”
From miR-92a-3p and miR-320a are Upregulated in Plasma Neuron-Derived Extracellular Vesicles of Patients with Frontotemporal Dementia (2025) · cites this paper as [34]
Self-check
Percentages, sums and reported differences re-computed from the paper’s own numbers.
The self-check needs the paper’s full text.
Citations
Cites
Nichols, E., Steinmetz, J. D., Vollset, S. E., Fukutaki, K., Chalek, J., Abd-Allah, F., Abdoli, A., Abualhasan, A., Abu-Gharbieh, E., Akram, T. T., et al. (2022) · The Lancet Public Health · doi:10.1016/s2468-2667(21)00249-8 · Cited by 5,575
Cell-Type-Based Analysis of MicroRNA Profiles in the Mouse Brain
He, M., Liu, Y., Wang, X., Zhang, M. Q., Hannon, G. J., & Huang, Z. J. (2012) · Neuron · doi:10.1016/j.neuron.2011.11.010 · Cited by 277
Adlakha, Y. K., & Saini, N. (2014) · Molecular Cancer · doi:10.1186/1476-4598-13-33 · Cited by 213
Circulating miRNAs as Biomarkers for Neurodegenerative Disorders
Grasso, M., Piscopo, P., Confaloni, A., & Denti, M. (2014) · Molecules · doi:10.3390/molecules19056891 · Cited by 208
Self-citation
Research works printed but not linked: 42
- Bai, 2017, Downregulation of blood serum microRNA 29 family in patients with Parkinson's disease, Sci. Rep., 7, 1, 10.1038/s41598-017-03887-3 · DOI
- Bartel, 2004, MicroRNAs: genomics biogenesis mechanism and function, Cells, 116, 281, 10.1016/S0092-8674(04)00045-5 · DOI
- Bian, 2013, MicroRNA cluster miR-17-92 regulates neural stem cell expansion and transition to intermediate progenitors in the developing mouse neocortex, Cell Rep., 3, 1398, 10.1016/j.celrep.2013.03.037 · DOI
- Bjerke, 2018, Cerebrospinal fluid biomarkers for early and differential Alzheimer's disease diagnosis, J. Alzheimers Dis., 62, 1199, 10.3233/JAD-170680 · DOI
- Buoncervello, 2017, Preclinical models in the study of sex differences, Clin. Sci. (Lond.), 131, 449, 10.1042/CS20160847 · DOI
- Camkurt, 2017, Peripheral signatures of psychiatric disorders: MicroRNAs, Clin. Psychopharmacol. Neurosci., 15, 313, 10.9758/cpn.2017.15.4.313 · DOI
- Castelluzzo, 2021, Dependence of connectivity on the logarithm of geometric distance in brain networks, Front. Physiol., 11, 611125, 10.3389/fphys.2020.611125 · DOI
- Denk, 2018, Specific serum and CSF microRNA profiles distinguish sporadic behavioural variant of Frontotemporal dementia compared with Alzheimer patients and cognitively healthy controls, PLoS One, 13, 5, 10.1371/journal.pone.0197329 · DOI
- Dorval, 2013, Circulating microRNAs in Alzheimer's disease: the search for novel biomarkers, Front. Mol. Neurosci., 6, 24, 10.3389/fnmol.2013.00024 · DOI
- Fehlmann, 2016, Distribution of microRNA biomarker candidates in solid tissues and body fluids, RNA Biol., 13, 1084, 10.1080/15476286.2016.1234658 · DOI
- Fontana, 2015, A network in Fronto temporal dementia -an RNA perspective, Front. Mol. Neurosci., 8, 9, 10.3389/fnmol.2015.00009 · DOI
- Friedländer, 2014, Evidence for the biogenesis of more than 1,000 novel human microRNAs, Genome Biol., 15, R57, 10.1186/gb-2014-15-4-r57 · DOI
- Gale, 2018, Dementia, Am. J. Med., 131, 1161, 10.1016/j.amjmed.2018.01.022 · DOI
- Grasso, 2015, Circulating cell-free microRNAs as biomarkers for neurodegenerative diseases, 207
- Grasso, 2019, Plasma microRNA profiling distinguishes patients with frontotemporal dementia from healthy subjects, Neurobiol. Aging, 84, 240.e1, 10.1016/j.neurobiolaging.2019.01.024 · DOI · Paper page
- Hassan, 2013, Isolation and identification of cellspecific microRNAs targeting a messenger RNA using a biotinylated antisense oligonucleotide capture affinity technique, Nucleic Acids Res., 41, e71, 10.1093/nar/gks1466 · DOI
- Keller, 2016, Can circulating miRNAs live up to the promise of being minimal invasive biomarkers in clinical settings?, Wiley Interdiscip. Rev. RNA, 7, 148, 10.1002/wrna.1320 · DOI
- Leidinger, 2013, A blood based 12-miRNA signature of Alzheimer disease patients, Genome Biol., 14, R78, 10.1186/gb-2013-14-7-r78 · DOI
- Li, 2017, Correcting miR92avGAT-mediated GABAergic dysfunctions rescues human tau-induced anxiety in mice, Mol. Ther., 25, 140, 10.1016/j.ymthe.2016.10.010 · DOI
- Mancini, 2021, DNMT3A epigenetically regulates key microRNAs involved in epithelial-to-mesenchymal transition in prostate cancer, Carcinogenesis, 42, 1449, 10.1093/carcin/bgab101 · DOI
- McKhann, 1984, Clinical diagnosis of Alzheimer’s disease: report of the NINCDS-ADRDA work group under the auspices of Department of Health and Human Services Task Force on Alzheimer’s disease, Neurology, 34, 939, 10.1212/WNL.34.7.939 · DOI · Paper page
- Nagaraj, 2017, Profile of 6 microRNA in blood plasma distinguish early stage Alzheimer's disease patients from non-demented subjects, Oncotarget, 8, 16122, 10.18632/oncotarget.15109 · DOI
- Naseri, 2019, The complexity of tau in Alzheimer's disease, Neurosci. Lett., 705, 183, 10.1016/j.neulet.2019.04.022 · DOI
- Neary, 1998, Frontotemporal lobar degeneration: A consensus on clinical diagnostic criteria, Neurology, 51, 1546, 10.1212/WNL.51.6.1546 · DOI · Paper page
- Nelson, 2010, MicroRNA in situ hybridization in the human Entorhinal and Transentorhinal cortex, Front. Hum. Neurosci., 4, 7, 10.3389/neuro.09.007.2010 · DOI
- Nowakowski, 2013, MicroRNA-92b regulates the development of intermediate cortical progenitors in embryonic mouse brain, Proc. Natl. Acad. Sci. U. S. A., 110, 7056, 10.1073/pnas.1219385110 · DOI · Paper page
- Pîrşcoveanu, 2017, Tau protein in neurodegenerative diseases -a review, Romanian J. Morphol. Embryol., 58, 4
- Piscopo, 2016, Frontotemporal lobar degeneration and MicroRNAs, Front. Aging Neurosci., 8, 17, 10.3389/fnagi.2016.00017 · DOI
- Piscopo, 2021, A sex perspective in neurodegenerative diseases: microRNAs as possible peripheral biomarkers, Int. J. Mol. Sci., 22, 9, 10.3390/ijms22094423 · DOI
- Piscopo, 2016, Reduced miR-659-3p levels correlate with Progranulin increase in hypoxic conditions: implications for Frontotemporal dementia, Front. Mol. Neurosci., 9, 31, 10.3389/fnmol.2016.00031 · DOI
- Piscopo, 2018, Circulating miR-127-3p as a biomarker for differential diagnosis in Frontotemporal dementia, J. Alzheimers Dis., 65, 455, 10.3233/JAD-180364 · DOI · Paper page
- Piscopo, 2019, MicroRNAs and mild cognitive impairment: a systematic review, Ageing Res. Rev., 50, 131, 10.1016/j.arr.2018.11.005 · DOI
- Rascovsky, 2011, Sensitivity of revised diagnostic criteria for the behavioural variant of frontotemporal dementia, Brain, 134, 9, 10.1093/brain/awr179 · DOI · Paper page
- Ricci, 2015, Statistical analysis of a Bayesian classifier based on the expression of miRNAs, BMC Bioinformatics., 16, 287, 10.1186/s12859-015-0715-9 · DOI
- Schratt, 2009, Fine-tuning neural gene expression with microRNAs, Curr. Opin. Neurobiol., 19, 213, 10.1016/j.conb.2009.05.015 · DOI
- Siedlecki-Wullich, 2019, Altered microRNAs related to synaptic function as potential plasma biomarkers for Alzheimer's disease, Alzheimers Res. Ther., 11, 1, 10.1186/s13195-019-0501-4 · DOI
- Silveira, 2020, MicroRNAs expressed in neuronal differentiation and their associated pathways: systematic review and bioinformatics analysis, Brain Res. Bull., 157, 140, 10.1016/j.brainresbull.2020.01.009 · DOI
- Vetere, 2014, Selective inhibition of miR-92 in hippocampal neurons alters contextual fear memory, Hippocampus, 24, 1458, 10.1002/hipo.22326 · DOI · Paper page
- Wang, 2016, Tau in physiology and pathology, Nat. Rev. Neurosci., 17, 22, 10.1038/nrn.2015.1 · DOI · Paper page
- Wang, 2020, miR-92 regulates the proliferation, migration, invasion and apoptosis of Glioma cells by targeting Neogenin, Open Med. (Wars), 15, 283, 10.1515/med-2020-0040 · DOI
- Yang, 2019, Altered expression levels of MicroRNA-132 and Nurr1 in peripheral blood of Parkinson's disease: potential disease biomarkers, ACS Chem. Neurosci., 10, 2243, 10.1021/acschemneuro.8b00460 · DOI · Paper page
- Zeni, 2022, Identification of miRNAs bound to an RNA of interest by MicroRNA capture affinity technology (miR-CATCH), Methods Mol. Biol., 2404, 207, 10.1007/978-1-0716-1851-6_11 · DOI
Cited by
Sorted by citations
Manzini, V., Cappelletti, P., Orefice, N. S., Brentari, I., Rigby, M. J., Lo Giudice, M., Feligioni, M., Rivabene, R., Crestini, A., Manfredi, F., et al. (2025) · Molecular Neurobiology · doi:10.1007/s12035-024-04386-z · Cited by 16
Self-citation
Metadata
- Authors
- Piscopo, P., Grasso, M., Manzini, V., Zeni, A., Castelluzzo, M., Fontana, F., Talarico, G., Castellano, A. E., Rivabene, R., Crestini, A., Bruno, G., Ricci, L., & Denti, M. A.
- Venue
- Frontiers in Molecular Neuroscience
- Publisher
- Frontiers Media SA
- Published
- 2023-05-31
- Volume
- 16
- ISSN
- 1662-5099
- PMC
- PMC10266489
- Cited by
- 15
- References
- 4
- Funders
- University of Trento (I85H20000200005)
About these checks
Registry, retraction, Cites and statistics results are computed, not judged, with one exception: a printed reference that no index lists is read once by a model before it counts as a citation error. Claims are extracted by a model and kept only when their quote appears verbatim in the text; each cited source is then checked, with a model’s help, for whether it says what the claim relies on. Those verdicts can be wrong — read the claim’s quote and the cited source before relying on one.
Statistics and arithmetic are recomputed, not judged.
Confidence bands are shown only for fields calibrated on our annotated test set. None is calibrated yet, so no band is shown.
What counts as a claim ›How we measure confidence ›How we check this ›
Are you an author, or do you see a problem with this page? Request a review
How to cite
Cite CoChat for the checks on this page, and the paper for its own findings.
- This page
- CoChat. (2026). Citation check: Identification of miRNAs regulating MAPT expression and their analysis in plasma of patients with dementia. https://app.cochat.ai/papers/10.3389/fnmol.2023.1127163
- The paper
- Piscopo, P., Grasso, M., Manzini, V., Zeni, A., Castelluzzo, M., Fontana, F., Talarico, G., Castellano, A. E., Rivabene, R., Crestini, A., Bruno, G., Ricci, L., & Denti, M. A. (2023). Identification of miRNAs regulating MAPT expression and their analysis in plasma of patients with dementia. Frontiers in Molecular Neuroscience. https://doi.org/10.3389/fnmol.2023.1127163
