

The DOI matches its Crossref record; 10 of the 10 references it cites were found in a registry or an index.
The Effects of a 6-Week Controlled, Hypocaloric Ketogenic Diet, With and Without Exogenous Ketone Salts, on Body Composition Responses
Abstract
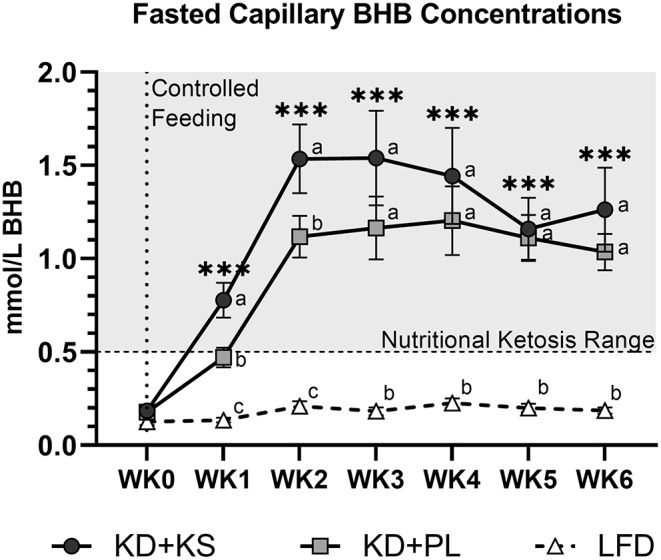
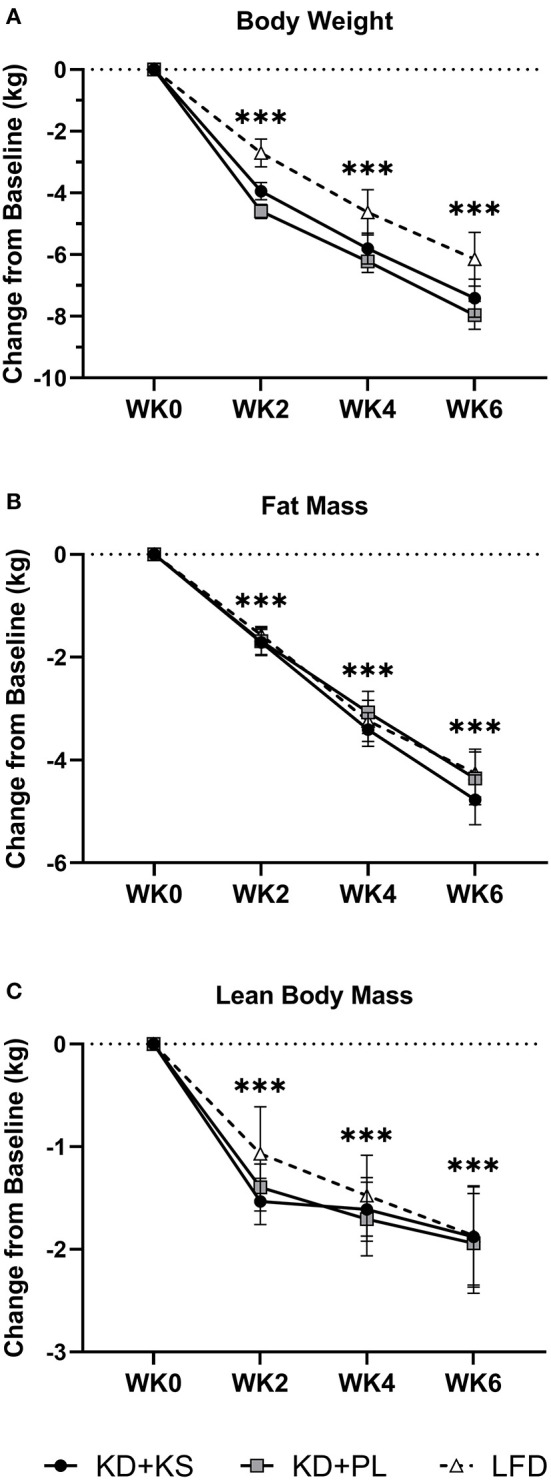
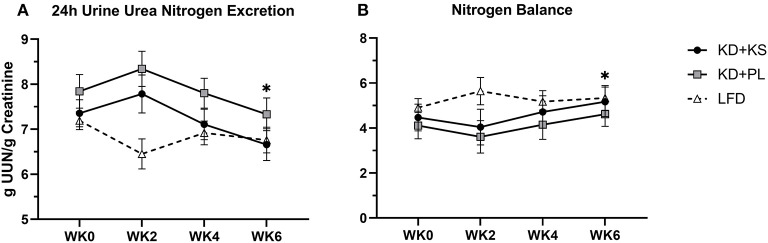
Background: Ketogenic diets (KDs) that elevate beta-hydroxybutyrate (BHB) promote weight and fat loss. Exogenous ketones, such as ketone salts (KS), also elevate BHB concentrations with the potential to protect against muscle loss during caloric restriction. Whether augmenting ketosis with KS impacts body composition responses to a well-formulated KD remains unknown. Purpose: To explore the effects of energy-matched, hypocaloric KD feeding (<50 g carbohydrates/day; 1.5 g/kg/day protein), with and without the inclusion of KS, on weight loss and body composition responses. Methods: Overweight and obese adults were provided a precisely defined hypocaloric KD (~75% of energy expenditure) for 6 weeks. In a double-blind manner, subjects were randomly assigned to receive ~24 g/day of a racemic BHB-salt (KD + KS; n = 12) or placebo (KD + PL; n = 13). A matched comparison group (n = 12) was separately assigned to an isoenergetic/isonitrogenous low-fat diet (LFD). Body composition parameters were assessed by dual x-ray absorptiometry and magnetic resonance imaging. Results: The KD induced nutritional ketosis (>1.0 mM capillary BHB) throughout the study (p < 0.001), with higher fasting concentrations observed in KD + KS than KD + PL for the first 2 weeks (p < 0.05). There were decreases in body mass, whole body fat and lean mass, mid-thigh muscle cross-sectional area, and both visceral and subcutaneous adipose tissues (p < 0.001), but no group differences between the two KDs or with the LFD. Urine nitrogen excretion was significantly higher in KD + PL than LFD (p < 0.01) and trended higher in KD + PL compared to KD + KS (p = 0.076), whereas the nitrogen excretion during KD + KS was similar to LFD (p > 0.05). Conclusion: Energy-matched hypocaloric ketogenic diets favorably affected body composition but were not further impacted by administration of an exogenous BHB-salt that augmented ketosis. The trend for less nitrogen loss with the BHB-salt, if manifested over a longer period of time, may contribute to preserved lean mass.
Overview
The claims and statistics of this paper haven’t been checked yet.
Run the check — free, no account needed. It reads the open-access text and checks the sources it cites.
Integrity signals
Registry
Cites
Statistics
Figures
Verification
Claims the paper makes
The claims and statistics of this paper haven’t been checked yet.
Run the check — free, no account needed. It reads the open-access text and checks the sources it cites.
Claims other papers make about this one
Each is checked against this paper’s own text: does it say what the citing paper says it does?
In the citing paper
“However, this idea lacks support from controlled, isocaloric, protein-equated diet comparisons of disparate carbohydrate‒fat proportions, which consistently show no statistically significant fat loss differences between the KD and LFD groups [104,135,148,160,161].”
From International Society of Sports Nutrition position stand: diets for body weight reduction (2026) · cites this paper as [161]
Self-check
Percentages, sums and reported differences re-computed from the paper’s own numbers.
The self-check needs the paper’s full text.
Citations
Cites
Nutritional and metabolic assessment of the hospitalized patient
Blackburn, G. L., Bistrian, B. R., Maini, B. S., Schlamm, H. T., & Smith, M. F. (1977) · Journal of Parenteral and Enteral Nutrition · doi:10.1177/014860717700100101 · Cited by 1,426 · cited 1×
“Nitrogen balance was calculated using a previously validated formula (37):”
Methodβ-Hydroxybutyrate: A Signaling Metabolite
Newman, J. C., & Verdin, E. (2017) · Annual Review of Nutrition · doi:10.1146/annurev-nutr-071816-064916 · Cited by 872 · cited 1×
“We speculate based on previous evidence that well-formulated KDs, especially ones that include exogenous BHB, can interact with essential AA (11, 52) and decrease essential AA efflux from muscle into circulation (10, 12, 15, 44).”
BackgroundDietary protein for athletes: From requirements to optimum adaptation
Phillips, S. M., & Van Loon, L. J. C. (2011) · Journal of Sports Sciences · doi:10.1080/02640414.2011.619204 · Cited by 530
A Ketogenic Diet Extends Longevity and Healthspan in Adult Mice
Roberts, M. N., Wallace, M. A., Tomilov, A. A., Zhou, Z., Marcotte, G. R., Tran, D., Perez, G., Gutierrez-Casado, E., Koike, S., Knotts, T. A., et al. (2017) · Cell Metabolism · doi:10.1016/j.cmet.2017.08.005 · Cited by 514
Shepherd, J. A., Ng, B. K., Sommer, M. J., & Heymsfield, S. B. (2017) · Bone · doi:10.1016/j.bone.2017.06.010 · Cited by 460
Increased Protein Intake Reduces Lean Body Mass Loss during Weight Loss in Athletes
METTLER, S., MITCHELL, N., & TIPTON, K. D. (2010) · Medicine & Science in Sports & Exercise · doi:10.1249/mss.0b013e3181b2ef8e · Cited by 288 · cited 1×
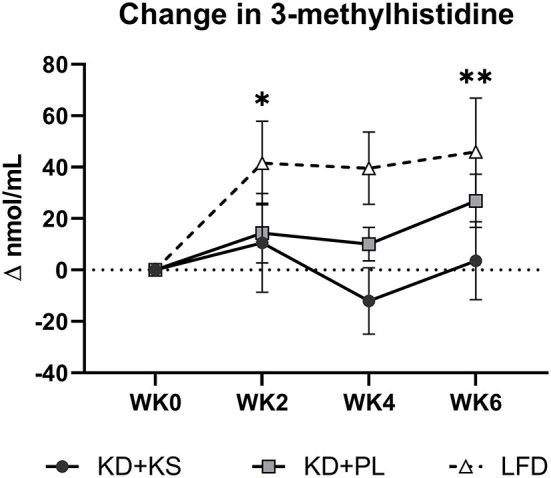
“Other authors used UUN and NBAL data to qualitatively support their diets rather than quantitatively correlate each gram of nitrogen lost to FFM (1 g UUN ∼30 g FFM) to avoid erroneous conclusions (9, 49, 50).”
MethodSackner-Bernstein, J., Kanter, D., & Kaul, S. (2015) · PLOS ONE · doi:10.1371/journal.pone.0139817 · Cited by 220
Dietary carbohydrate restriction improves metabolic syndrome independent of weight loss
Hyde, P. N., Sapper, T. N., Crabtree, C. D., LaFountain, R. A., Bowling, M. L., Buga, A., Fell, B., McSwiney, F. T., Dickerson, R. M., Miller, V. J., et al. (2019) · JCI Insight · doi:10.1172/jci.insight.128308 · Cited by 210
Volk, B. M., Kunces, L. J., Freidenreich, D. J., Kupchak, B. R., Saenz, C., Artistizabal, J. C., Fernandez, M. L., Bruno, R. S., Maresh, C. M., Kraemer, W. J., et al. (2014) · PLoS ONE · doi:10.1371/journal.pone.0113605 · Cited by 112
Self-citationProtein sparing during treatment of obesity: ketogenic versus nonketogenic very low calorie diet
Vazquez, J. A., & Adibi, S. A. (1992) · Metabolism · doi:10.1016/0026-0495(92)90076-m · Cited by 67
Research works printed but not linked: 45
- Volek, 2004, Comparison of energy-restricted very low-carbohydrate and low-fat diets on weight loss and body composition in overweight men and women, Nutr Metab, 1, 13, 10.1186/1743-7075-1-13 · DOI · Paper page
- Volek, 2009, Carbohydrate restriction has a more favorable impact on the metabolic syndrome than a low fat diet, Lipids, 44, 297, 10.1007/s11745-008-3274-2 · DOI · Paper page
- LaFountain, 2019, Extended ketogenic diet and physical training intervention in military personnel, Mil Med, 184, e538, 10.1093/milmed/usz046 · DOI
- Ludwig, 2018, The carbohydrate-insulin model of obesity: beyond “calories in, calories out”, JAMA Intern Med, 178, 1098, 10.1001/jamainternmed.2018.2933 · DOI
- Hall, 2018, The carbohydrate-insulin model of obesity is difficult to reconcile with current evidence, JAMA Intern Med, 178, 1103, 10.1001/jamainternmed.2018.2920 · DOI
- Kackley, 2020, A pre-workout supplement of ketone salts, caffeine, and amino acids improves high-intensity exercise performance in keto-naive and keto-adapted individuals, J Am Coll Nutr, 39, 290, 10.1080/07315724.2020.1752846 · DOI
- Stubbs, 2017, On the metabolism of exogenous ketones in humans, Front Physiol, 8, 848, 10.3389/fphys.2017.00848 · DOI
- Pawan, 1983, Effect of 3-hydroxybutyrate in obese subjects on very-low-energy diets and during therapeutic starvation, Lancet, 321, 15, 10.1016/S0140-6736(83)91560-X · DOI
- Sherwin, 1975, Effect of ketone infusions on amino acid and nitrogen metabolism in man, J Clin Invest, 55, 1382, 10.1172/JCI108057 · DOI
- Nair, 1988, Effect of beta-hydroxybutyrate on whole-body leucine kinetics and fractional mixed skeletal muscle protein synthesis in humans, J Clin Invest, 82, 198, 10.1172/JCI113570 · DOI
- Thomsen, 2018, Effects of 3-hydroxybutyrate and free fatty acids on muscle protein kinetics and signaling during LPS-induced inflammation in humans: anticatabolic impact of ketone bodies, Am J Clin Nutr, 108, 857, 10.1093/ajcn/nqy170 · DOI
- Fearon, 1988, Cancer cachexia: influence of systemic ketosis on substrate levels and nitrogen metabolism, Am J Clin Nutr, 47, 42, 10.1093/ajcn/47.1.42 · DOI
- Koutnik, 2020, Ketone bodies attenuate wasting in models of atrophy, J Cachexia Sarcopenia Muscle, 11, 973, 10.1002/jcsm.12554 · DOI
- Shukla, 2014, Metabolic reprogramming induced by ketone bodies diminishes pancreatic cancer cachexia, Cancer Metab, 2, 18, 10.1186/2049-3002-2-18 · DOI
- Vandoorne, 2017, Intake of a ketone ester drink during recovery from exercise promotes mTORC1 signaling but not glycogen resynthesis in human muscle, Front Physiol, 8, 310, 10.3389/fphys.2017.00310 · DOI
- Krieger, 2006, Effects of variation in protein and carbohydrate intake on body mass and composition during energy restriction: a meta-regression, Am J Clin Nutr, 83, 260, 10.1093/ajcn/83.2.260 · DOI · Paper page
- Volek, 2002, Body composition and hormonal responses to a carbohydrate-restricted diet, Metabolism, 51, 864, 10.1053/meta.2002.32037 · DOI
- Hoffer, 1984, Metabolic effects of very low calorie weight reduction diets, J Clin Invest, 73, 750, 10.1172/JCI111268 · DOI
- Young, 1971, Effect on body composition and other parameters in obese young men of carbohydrate level of reduction diet, Am J Clin Nutr, 24, 290, 10.1093/ajcn/24.3.290 · DOI
- Yang, 1976, Composition of weight lost during short-term weight reduction. Metabolic responses of obese subjects to starvation and low-calorie ketogenic and non-ketogenic diets, J Clin Invest, 58, 722, 10.1172/JCI108519 · DOI
- DeHaven, 1980, Nitrogen and sodium balance and sympathetic-nervous-system activity in obese subjects treated with a low-calorie protein or mixed diet, N Engl J Med, 302, 477, 10.1056/NEJM198002283020901 · DOI
- Dietz, 1985, Interrelationships of glucose and protein metabolism in obese adolescents during short-term hypocaloric dietary therapy, Am J Clin Nutr, 42, 380, 10.1093/ajcn/42.3.380 · DOI
- Phinney, 1988, Effects of aerobic exercise on energy expenditure and nitrogen balance during very low calorie dieting, Metabolism, 37, 758, 10.1016/0026-0495(88)90011-X · DOI
- Phinney, 1980, Capacity for moderate exercise in obese subjects after adaptation to a hypocaloric, ketogenic diet, J Clin Invest, 66, 1152, 10.1172/JCI109945 · DOI
- Metropolitan, 1983, Metropolitan height and weight tables, Stat Bull, 64, 3
- 2002, Dietary Reference Intakes for Energy, Carbohydrate, Fiber, Fat, Fatty Acids, Cholesterol, Protein, and Amino Acids
- O'Connor, 2018, Acute oral intake of beta-hydroxybutyrate in a pilot study transiently increased its capillary levels in healthy volunteers, J Nutr Health Food Eng, 8, 324, 10.15406/jnhfe.2018.08.00289 · DOI
- 2013, ACSM's Guidelines for Exercise Testing and Prescription
- Welch, 2015, Congruent validity and reliability of two metabolic systems to measure resting metabolic rate, Int J Sports Med, 36, 414, 10.1055/s-0034-1398575 · DOI
- Crabtree, 2019, Quantification of human central adipose tissue depots: an anatomically matched comparison between DXA and MRI, Tomography, 5, 358, 10.18383/j.tom.2019.00018 · DOI
- Housh, 1995, Anthropometric estimation of thigh muscle cross-sectional area, Med Sci Sports Exerc, 27, 784, 10.1249/00005768-199505000-00023 · DOI
- Mathur, 2008, Estimation of thigh muscle mass with magnetic resonance imaging in older adults and people with chronic obstructive pulmonary disease, Phys Ther, 88, 219, 10.2522/ptj.20070052 · DOI
- Schneider, 2012, NIH Image to ImageJ: 25 years of image analysis, Nat Methods, 9, 671, 10.1038/nmeth.2089 · DOI · Paper page
- Tinsley, 2016, Fat-free mass changes during ketogenic diets and the potential role of resistance training, Int J Sport Nutr Exerc Metab, 26, 78, 10.1123/ijsnem.2015-0070 · DOI · Paper page
- Phinney, 1983, The human metabolic response to chronic ketosis without caloric restriction: physical and biochemical adaptation, Metabolism, 32, 757, 10.1016/0026-0495(83)90105-1 · DOI
- Boutin, 2015, Sarcopenia: current concepts and imaging implications, AJR Am J Roentgenol, 205, W255, 10.2214/AJR.15.14635 · DOI
- Sapir, 1975, Renal conservation of ketone bodies during starvation, Metabolism, 24, 23, 10.1016/0026-0495(75)90004-9 · DOI
- Lemieux, 1971, The effect of ketone bodies on renal ammoniogenesis, J Clin Invest, 50, 1781, 10.1172/JCI106668 · DOI
- Desir, 1980, Effect of Ketone Bodies on the Renal Excretion of Ammonia, 2519
- Walberg, 1988, Macronutrient content of a hypoenergy diet affects nitrogen retention and muscle function in weight lifters, Int J Sports Med, 9, 261, 10.1055/s-2007-1025018 · DOI
- Beylot, 1994, Metabolic effects of a D-beta-hydroxybutyrate infusion in septic patients: inhibition of lipolysis and glucose production but not leucine oxidation, Crit Care Med, 22, 1091, 10.1097/00003246-199407000-00007 · DOI
- Taggart, 2005, (D)-beta-Hydroxybutyrate inhibits adipocyte lipolysis via the nicotinic acid receptor PUMA-G, J Biol Chem, 280, 26649, 10.1074/jbc.C500213200 · DOI
- Harvey, 2018, The use of nutritional supplements to induce ketosis and reduce symptoms associated with keto-induction: a narrative review, PeerJ, 6, e4488, 10.7717/peerj.4488 · DOI
- Kesl, 2016, Effects of exogenous ketone supplementation on blood ketone, glucose, triglyceride, and lipoprotein levels in Sprague-Dawley rats, Nutr Metab, 13, 9, 10.1186/s12986-016-0069-y · DOI
- Bradley, 2009, Low-fat versus low-carbohydrate weight reduction diets: effects on weight loss, insulin resistance, and cardiovascular risk: a randomized control trial, Diabetes, 58, 2741, 10.2337/db09-0098 · DOI
Cited by
Sorted by citations
Volek, J. S., Kackley, M. L., & Buga, A. (2024) · Current Nutrition Reports · doi:10.1007/s13668-024-00548-6 · Cited by 48
Self-citationInternational Society of Sports Nutrition position stand: diets for body weight reduction
Aragon, A. A., Campbell, B. I., Schoenfeld, B. J., Stout, J. R., Kalman, D., Arciero, P. J., Arent, S. M., Kreider, R. B., Taylor, L. W., Bannock, L., et al. (2026) · Journal of the International Society of Sports Nutrition · doi:10.1080/15502783.2026.2740266
Metadata
- Authors
- Buga, A., Kackley, M. L., Crabtree, C. D., Sapper, T. N., Mccabe, L., Fell, B., LaFountain, R. A., Hyde, P. N., Martini, E. R., Bowman, J., Pan, Y., Scandling, D., Brownlow, M. L., O'Connor, A., Simonetti, O. P., Kraemer, W. J., & Volek, J. S.
- Venue
- Frontiers in Nutrition
- Publisher
- Frontiers Media SA
- Published
- 2021-03-24
- Volume
- 8
- ISSN
- 2296-861X
- PMC
- PMC8044842
- Cited by
- 38
- References
- 10
About these checks
Registry, retraction, Cites and statistics results are computed, not judged, with one exception: a printed reference that no index lists is read once by a model before it counts as a citation error. Claims are extracted by a model and kept only when their quote appears verbatim in the text; each cited source is then checked, with a model’s help, for whether it says what the claim relies on. Those verdicts can be wrong — read the claim’s quote and the cited source before relying on one.
Statistics and arithmetic are recomputed, not judged.
Confidence bands are shown only for fields calibrated on our annotated test set. None is calibrated yet, so no band is shown.
What counts as a claim ›How we measure confidence ›How we check this ›
Are you an author, or do you see a problem with this page? Request a review
