

A Single LiDAR-Based Feature Fusion Indoor Localization Algorithm
Open accessThe DOI matches its Crossref record; 39 of the 39 references it cites were found in a registry or an index.
Abstract
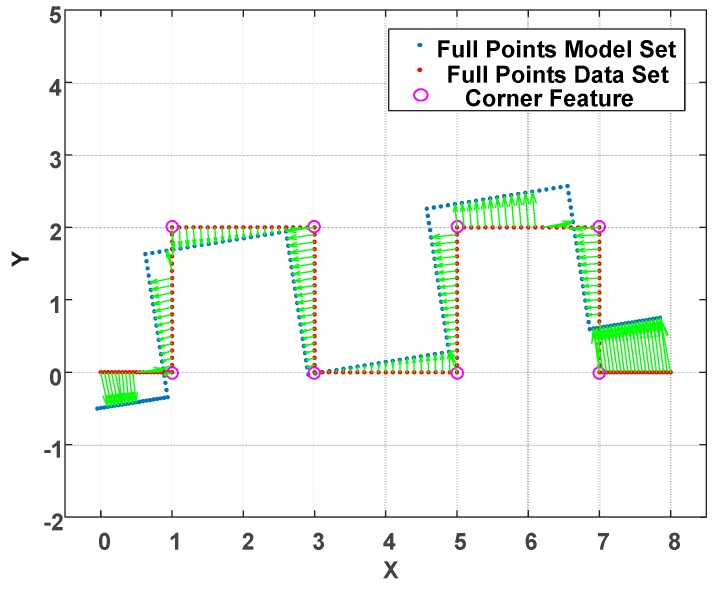
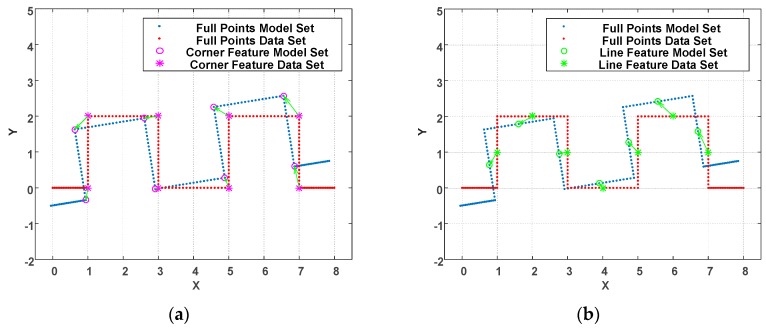
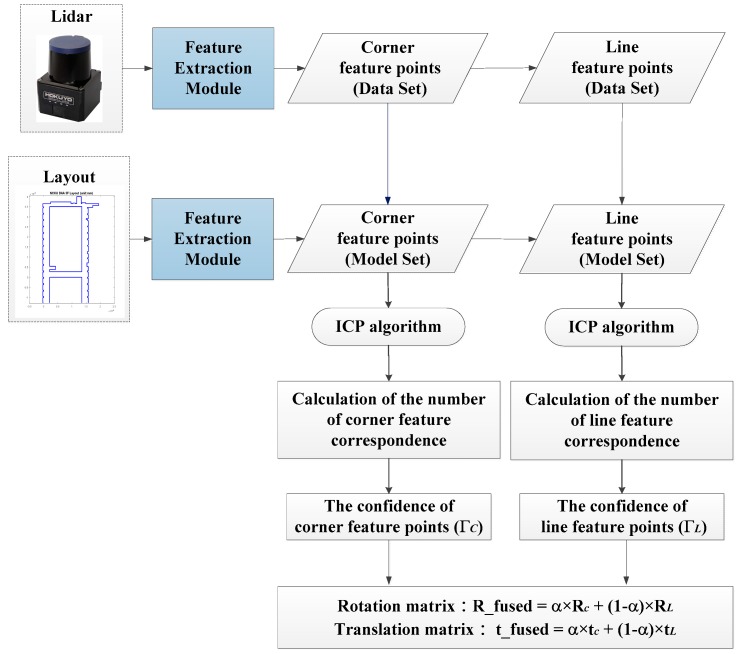
In past years, there has been significant progress in the field of indoor robot localization. To precisely recover the position, the robots usually relies on multiple on-board sensors. Nevertheless, this affects the overall system cost and increases computation. In this research work, we considered a light detection and ranging (LiDAR) device as the only sensor for detecting surroundings and propose an efficient indoor localization algorithm. To attenuate the computation effort and preserve localization robustness, a weighted parallel iterative closed point (WP-ICP) with interpolation is presented. As compared to the traditional ICP, the point cloud is first processed to extract corners and line features before applying point registration. Later, points labeled as corners are only matched with the corner candidates. Similarly, points labeled as lines are only matched with the lines candidates. Moreover, their ICP confidence levels are also fused in the algorithm, which make the pose estimation less sensitive to environment uncertainties. The proposed WP-ICP architecture reduces the probability of mismatch and thereby reduces the ICP iterations. Finally, based on given well-constructed indoor layouts, experiment comparisons are carried out under both clean and perturbed environments. It is shown that the proposed method is effective in significantly reducing computation effort and is simultaneously able to preserve localization precision.
Overview
The claims and statistics of this paper haven’t been checked yet.
Free: it reads the open-access text and checks the first 5 claims that cite a source we can check. Create a free account to check every claim.
Integrity signals
Registry
Cites
Statistics
Figures
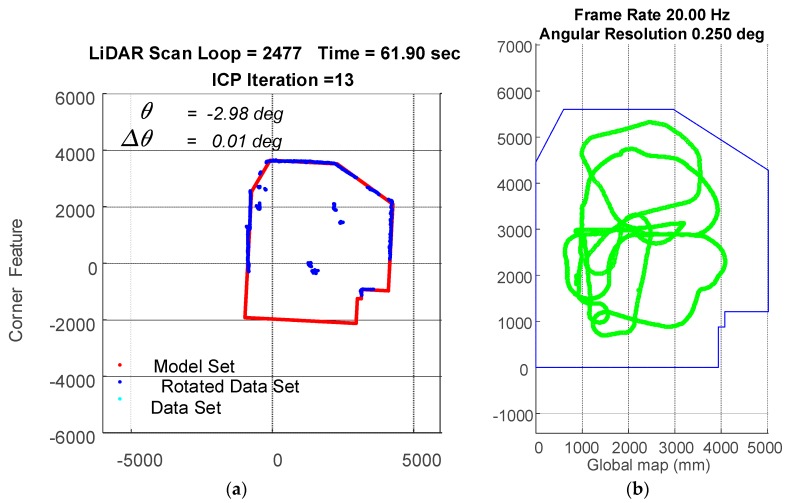
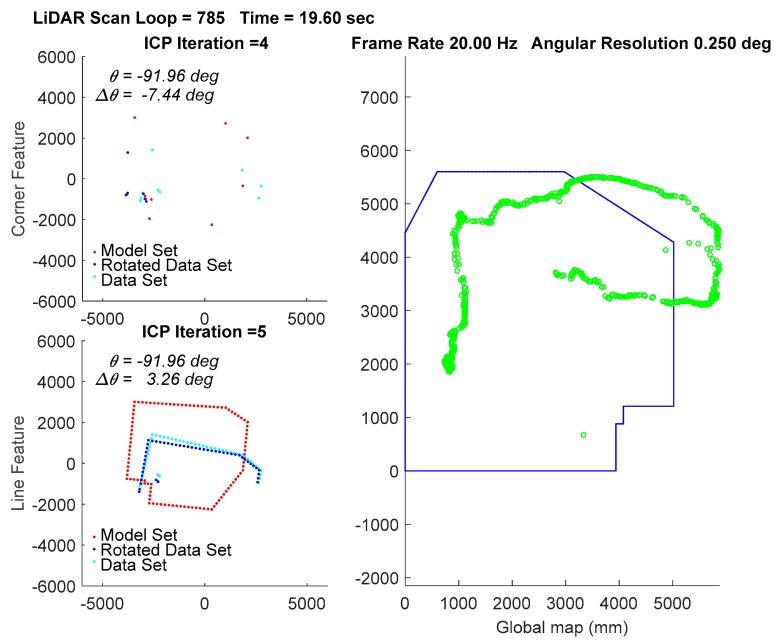
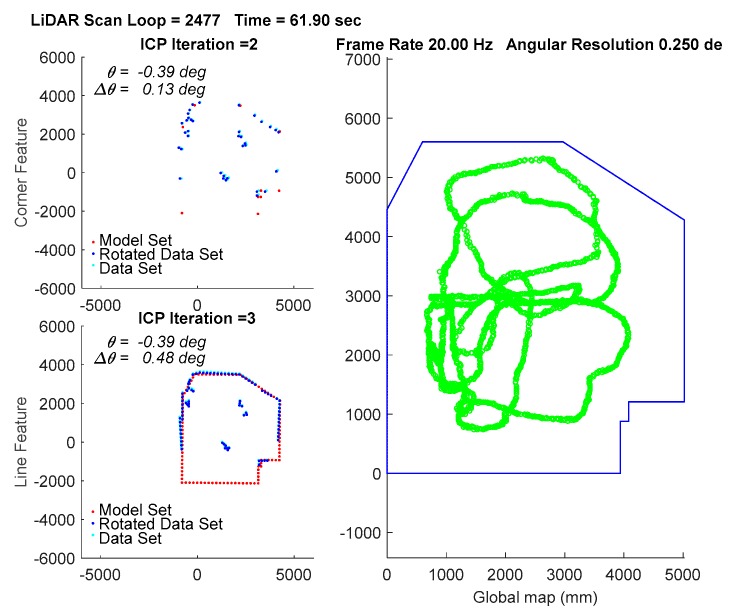
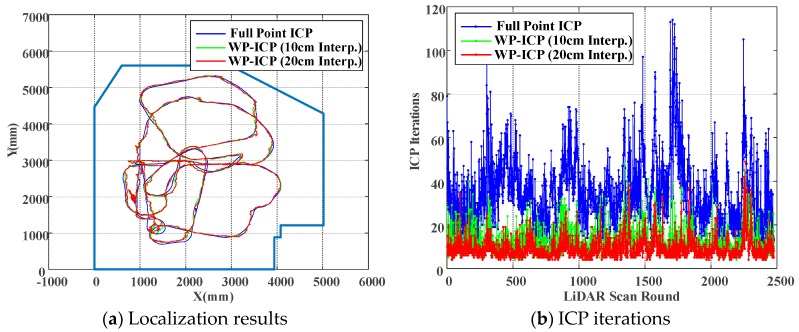
Verification
Claims the paper makes
The claims and statistics of this paper haven’t been checked yet.
Free: it reads the open-access text and checks the first 5 claims that cite a source we can check. Create a free account to check every claim.
Self-check
Percentages, sums and reported differences re-computed from the paper’s own numbers.
The self-check needs the paper’s full text.
Citations
Cites
A New Approach to Linear Filtering and Prediction Problems
Kalman, R. E. (1960) · Journal of Basic Engineering · doi:10.1115/1.3662552 · Cited by 31,751 · cited 1×
“To obtain precise and high-bandwidth robot pose estimation, the vehicle’s dynamics and traveling status can be further integrated into a Kalman filter [25].”
A method for registration of 3-D shapes
Besl, P. J., & McKay, N. D. (1992) · IEEE Transactions on Pattern Analysis and Machine Intelligence · doi:10.1109/34.121791 · Cited by 18,103
Object recognition from local scale-invariant features
Lowe, D. G. (1999) · Proceedings of the Seventh IEEE International Conference on Computer Vision · doi:10.1109/iccv.1999.790410 · Cited by 16,472
Speeded-Up Robust Features (SURF)
Bay, H., Ess, A., Tuytelaars, T., & Van Gool, L. (2008) · Computer Vision and Image Understanding · doi:10.1016/j.cviu.2007.09.014 · Cited by 13,557 · cited 1×
“Under the condition that the captured images are matched sufficiently, features can be extracted using Scale-Invariant Feature Transform (SIFT) [4] or Speeded Up Robust Features (SURF) [5].”
Efficient variants of the ICP algorithm
Rusinkiewicz, S., & Levoy, M. (2002) · Proceedings Third International Conference on 3-D Digital Imaging and Modeling · doi:10.1109/im.2001.924423 · Cited by 3,945
Method for registration of 3-D shapes:
Besl, P. J., & McKay, N. D. (1992) · SPIE Proceedings · doi:10.1117/12.57955 · Cited by 2,413
The normal distributions transform: a new approach to laser scan matching
Biber, P., & Strasser, W. (2004) · Proceedings 2003 IEEE/RSJ International Conference on Intelligent Robots and Systems (IROS 2003) (Cat. No.03CH37453) · doi:10.1109/iros.2003.1249285 · Cited by 1,554
Guivant, J. E., & Nebot, E. M. (2001) · IEEE Transactions on Robotics and Automation · doi:10.1109/70.938382 · Cited by 772
Robot Pose Estimation in Unknown Environments by Matching 2D Range Scans
Lu, F., & Milios, E. (1997) · Journal of Intelligent and Robotic Systems · doi:10.1023/a:1007957421070 · Cited by 675
An ICP variant using a point-to-line metric
Censi, A. (2008) · 2008 IEEE International Conference on Robotics and Automation · doi:10.1109/robot.2008.4543181 · Cited by 626
Vision-based global localization and mapping for mobile robots
Se, S., Lowe, D. G., & Little, J. J. (2005) · IEEE Transactions on Robotics · doi:10.1109/tro.2004.839228 · Cited by 482
Fusion of WiFi, Smartphone Sensors and Landmarks Using the Kalman Filter for Indoor Localization
Chen, Z., Zou, H., Jiang, H., Zhu, Q., Soh, Y., & Xie, L. (2015) · Sensors · doi:10.3390/s150100715 · Cited by 382
Kinect v2 for mobile robot navigation: Evaluation and modeling
Fankhauser, P., Bloesch, M., Rodriguez, D., Kaestner, R., Hutter, M., & Siegwart, R. (2015) · 2015 International Conference on Advanced Robotics (ICAR) · doi:10.1109/icar.2015.7251485 · Cited by 314
Line Extraction in 2D Range Images for Mobile Robotics
Borges, G. A., & Aldon, M.-J. (2004) · Journal of Intelligent and Robotic Systems · doi:10.1023/b:jint.0000038945.55712.65 · Cited by 293
Fusion of IMU and Vision for Absolute Scale Estimation in Monocular SLAM
Nützi, G., Weiss, S., Scaramuzza, D., & Siegwart, R. (2011) · Journal of Intelligent & Robotic Systems · doi:10.1007/s10846-010-9490-z · Cited by 286
A comparison of line extraction algorithms using 2D range data for indoor mobile robotics
Nguyen, V., Gächter, S., Martinelli, A., Tomatis, N., & Siegwart, R. (2007) · Autonomous Robots · doi:10.1007/s10514-007-9034-y · Cited by 236
Geometry and Convergence Analysis of Algorithms for Registration of 3D Shapes
Pottmann, H., Huang, Q.-X., Yang, Y.-L., & Hu, S.-M. (2006) · International Journal of Computer Vision · doi:10.1007/s11263-006-5167-2 · Cited by 218
Metric-Based Scan Matching Algorithms for Mobile Robot Displacement Estimation
Mínguez, J., Lamiraux, F., & Montesano, L. (2006) · Proceedings - IEEE International Conference on Robotics and Automation/Proceedings · doi:10.1109/robot.2005.1570661 · Cited by 101
Probabilistic scan matching for motion estimation in unstructured environments
Montesano, L., Mínguez, J., & Montano, L. (2005) · IEEE/RSJ International Conference on Intelligent Robots and Systems (IROS) · doi:10.1109/iros.2005.1545182 · Cited by 94
Palacín, J., Martínez, D., Clotet, E., Pallejà, T., Burgués, J., Fonollosa, J., Pardo, A., & Marco, S. (2019) · Sensors · doi:10.3390/s19091957 · Cited by 86
Calibrate Multiple Consumer RGB-D Cameras for Low-Cost and Efficient 3D Indoor Mapping
Chen, C., Yang, B., Song, S., Tian, M., Li, J., Dai, W., & Fang, L. (2018) · Remote Sensing · doi:10.3390/rs10020328 · Cited by 65
Ravankar, A. A., Ravankar, A. A., HOSHINO, Y., Emaru, T., & Kobayashi, Y. (2016) · International Journal of Advanced Robotic Systems · doi:10.5772/63540 · Cited by 59
Self-citationPassafiume, M., Maddio, S., & Cidronali, A. (2017) · Sensors · doi:10.3390/s17040717 · Cited by 49
Ravankar, A. A., HOSHINO, Y., Ravankar, A. A., Lv, J., Emaru, T., & Kobayashi, Y. (2015) · International Journal of Advanced Robotic Systems · doi:10.5772/59992 · Cited by 47
Self-citationSLAM based on Kalman filter for multi-rate fusion of laser and encoder measurements
Armesto, L., & Tornero, J. (2005) · IEEE/RSJ International Conference on Intelligent Robots and Systems (IROS) · doi:10.1109/iros.2004.1389668 · Cited by 41
Indoor Location Sensing with Invariant Wi-Fi Received Signal Strength Fingerprinting
Husen, M. N., & Lee, S. (2016) · Sensors · doi:10.3390/s16111898 · Cited by 35
Sensors for Indoor Mapping and Navigation
Khoshelham, K., & Sisi Zlatanova, B. (2016) · Sensors · doi:10.3390/s16050655 · Cited by 31
An Indoor Positioning Approach Based on Fusion of Cameras and Infrared Sensors
Martín-Gorostiza, E., García-Garrido, M. Á., Pizarro, D., Salido-Monzú, D., & Torres, P. G. (2019) · Sensors · doi:10.3390/s19112519 · Cited by 28
Wang, S., Kobayashi, Y., Ravankar, A. A., Ravankar, A. A., & Emaru, T. (2019) · Sensors · doi:10.3390/s19102230 · Cited by 24
Self-citationLine Segment-Based Indoor Mapping with Salient Line Feature Extraction
An, S.-Y., Kang, J.-G., Lee, L.-K., & Oh, S. (2012) · Advanced Robotics · doi:10.1163/156855311x617452 · Cited by 23
SLAM Using Single Laser Range Finder
Agha–mohammadi, A., Tamjidi, A. H., & Taghirad, H. D. (2008) · IFAC Proceedings Volumes · doi:10.3182/20080706-5-kr-1001.02482 · Cited by 21
Straight Line Segments Extraction and EKF-SLAM in Indoor Environment
Lv, J., Kobayashi, Y., Ravankar, A. A., & Emaru, T. (2014) · Journal of Automation and Control Engineering · doi:10.12720/joace.2.3.270-276 · Cited by 19
Self-citationScalable Indoor Localization via Mobile Crowdsourcing and Gaussian Process
Chang, Q., Li, Q., Shi, Z., Chen, W., & Wang, W. (2016) · Sensors · doi:10.3390/s16030381 · Cited by 18
A two-stage mobile robot localization method by overlapping segment-based maps
Reina, A. J., & González, J. (2000) · Robotics and Autonomous Systems · doi:10.1016/s0921-8890(99)00098-6 · Cited by 17
Kim, Y. H., Choi, M. J., Kim, E. J., & Song, J. W. (2019) · Sensors · doi:10.3390/s19214782 · Cited by 17
A polynomial based SLAM algorithm for mobile robots using ultrasonic sensors - Experimental results
D’Alfonso, L., Grano, A., Muraca, P., & Pugliese, P. (2013) · International Conference on Advanced Robotics (ICAR) · doi:10.1109/icar.2013.6766462 · Cited by 15
An approach to restaurant service robot SLAM
Zhang, J., Ou, Y., Jiang, G., & Zhou, Y. (2016) · IEEE International Conference on Robotics and Biomimetics (ROBIO) · doi:10.1109/robio.2016.7866643 · Cited by 15
Vision-based Hand Recognition Based on ToF Depth Camera
Yu, C.-W., Liu, C.-H., Chen, Y., Lee, P., & Tian, M.-S. (2017) · Smart Science · doi:10.1080/23080477.2017.1402537 · Cited by 12
The Development of E-Bike Navigation Technology Based on an OpenStreetMap
Wei, C.-C., Lin, J.-S., Chang, C., Huang, Y., & Lin, C.-B. (2017) · Smart Science · doi:10.1080/23080477.2017.1410011 · Cited by 6
Research works printed but not linked: 1
- Duda, R.O., and Hart, P.E. (1973). Pattern Classification and Scene Analysis, John Wiley & Sons.
Cited by
İlçi, V., & Toth, C. K. (2020) · Sensors · doi:10.3390/s20030899 · Cited by 137
Current Algorithms, Communication Methods and Designs for Underwater Swarm Robotics: A Review
Connor, J., Champion, B. T., & Joordens, M. (2020) · IEEE Sensors Journal · doi:10.1109/jsen.2020.3013265 · Cited by 108
Palacín, J., Martínez, D., Clotet, E., Pallejà, T., Burgués, J., Fonollosa, J., Pardo, A., & Marco, S. (2019) · Sensors · doi:10.3390/s19091957 · Cited by 86
An Autonomous Grape-Harvester Robot: Integrated System Architecture
Vrochidou, Ε., Tziridis, K., Nikolaou, A., Kalampokas, Τ., Papakostas, G. A., Pachidis, T. P., Mamalis, S. A., Koundouras, S., & Kaburlasos, V. G. (2021) · Electronics · doi:10.3390/electronics10091056 · Cited by 74
Meng, J., Wan, L. P., Wang, S., Jiang, L., Li, G., Wu, L., & Xie, Y. (2021) · IEEE Transactions on Instrumentation and Measurement · doi:10.1109/tim.2021.3093933 · Cited by 51
Metadata
- Authors
- Wang, Y.-T., Peng, C.-C., Ravankar, A. A., & Ravankar, A.
- Affiliations
- National Cheng Kung University (TW)
- Hokkaido University (JP)
- Corresponding author
- Peng, Chao-Chung
- Venue
- Sensors
- Publisher
- MDPI AG
- Published
- 2018-04-23
- Volume
- 18
- Issue
- 4
- Pages
- 1294
- ISSN
- 1424-8220 (ISSN-L)
- PMC
- PMC5949039
- OpenAlex
- W2801240241
- Cited by
- 84
- References
- 38
- Citations by year
- 2026: 2 · 2025: 5 · 2024: 12 · 2023: 12 · 2022: 13 · 2021: 13 · 2020: 12 · 2019: 13 · 2018: 2
- FWCI
- 8.14
- Type
- journal article
- Language
- en
- Open access
- gold
- doi.org
- Licence
- Locations
- Sensors (publishedVersion, cc-by)
- Europe PMC (PubMed Central) (publishedVersion, cc-by)
- PubMed Central (publishedVersion, cc-by)
- PubMed (publishedVersion)
- Institutional Repositories DataBase (IRDB) (submittedVersion, cc-by)
- DOAJ (DOAJ: Directory of Open Access Journals) (submittedVersion, cc-by-sa)
- Hokkaido University Collection of Scholarly and Academic Papers (Hokkaido University) (submittedVersion, cc-by)
- Funders
- Ministry of Science and Technology, Taiwan (MOST107-2218-E006-004, MOST106-2221-E006-138)
- Topics
- Physical Sciences › Computer Science › Computer Vision and Pattern Recognition › Robotics and Sensor-Based Localization
- Physical Sciences › Engineering › Electrical and Electronic Engineering › Indoor and Outdoor Localization Technologies
- Physical Sciences › Earth and Planetary Sciences › Geology › 3D Surveying and Cultural Heritage
- Keywords
- indoor robot localization, LiDAR, feature fusion, point cloud registration, pose estimation, computation reduction, sensor fusion
About these checks
Registry, retraction, Cites and statistics results are computed, not judged, with one exception: a printed reference that no index lists is read once by a model before it counts as a citation error. Claims are extracted by a model and kept only when their quote appears verbatim in the text; each cited source is then checked, with a model’s help, for whether it says what the claim relies on. Those verdicts can be wrong — read the claim’s quote and the cited source before relying on one.
Statistics and arithmetic are recomputed, not judged.
Confidence bands are shown only for fields calibrated on our annotated test set. None is calibrated yet, so no band is shown.
What counts as a claim ›How we measure confidence ›How we check this ›
Are you an author, or do you see a problem with this page? Request a review
Data sources
Bibliographic data: Semantic Scholar, OpenAlex, Crossref.
Contains information from the Semantic Scholar Academic Graph Datasets, made available under the ODC Attribution License (ODC-BY 1.0).
Semantic Scholar’s data is described in: Kinney, R., et al. (2023). The Semantic Scholar Open Data Platform. arXiv:2301.10140.
