

Exploring the Connections between Agroecological Practices and Ecosystem Services: A Systematic Literature Review
Open accessThe DOI matches its Crossref record; 67 of the 67 references it cites were found in a registry or an index.
Abstract
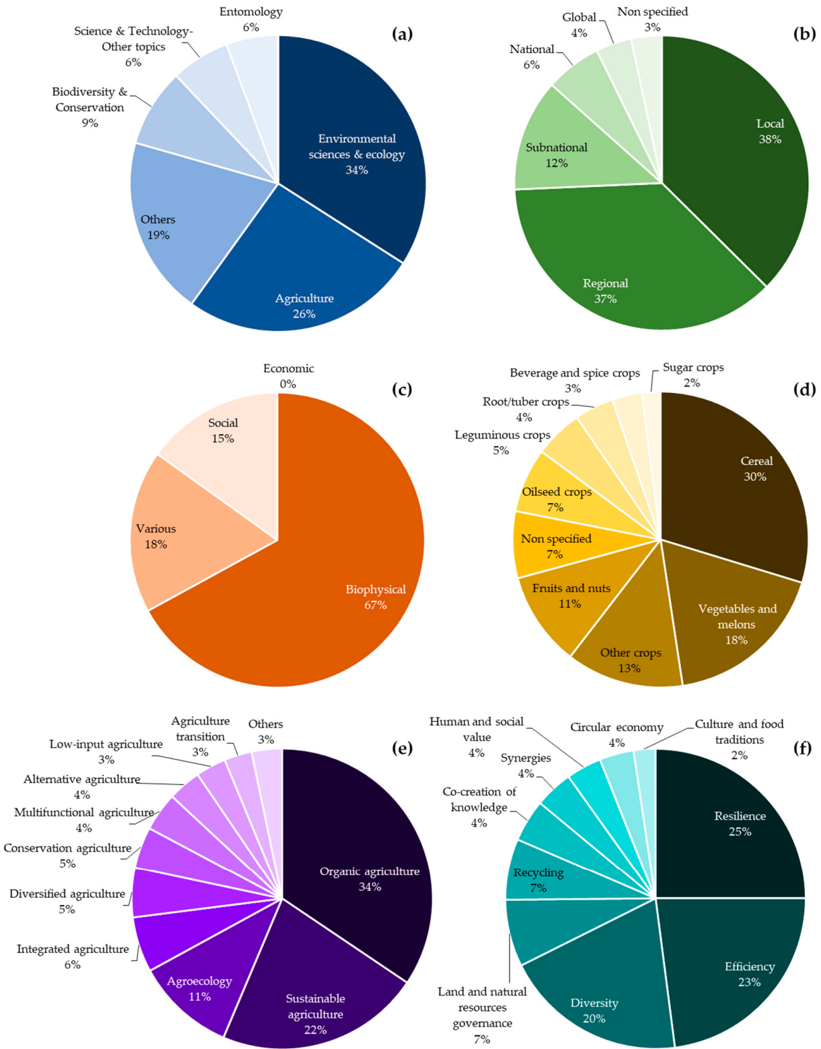
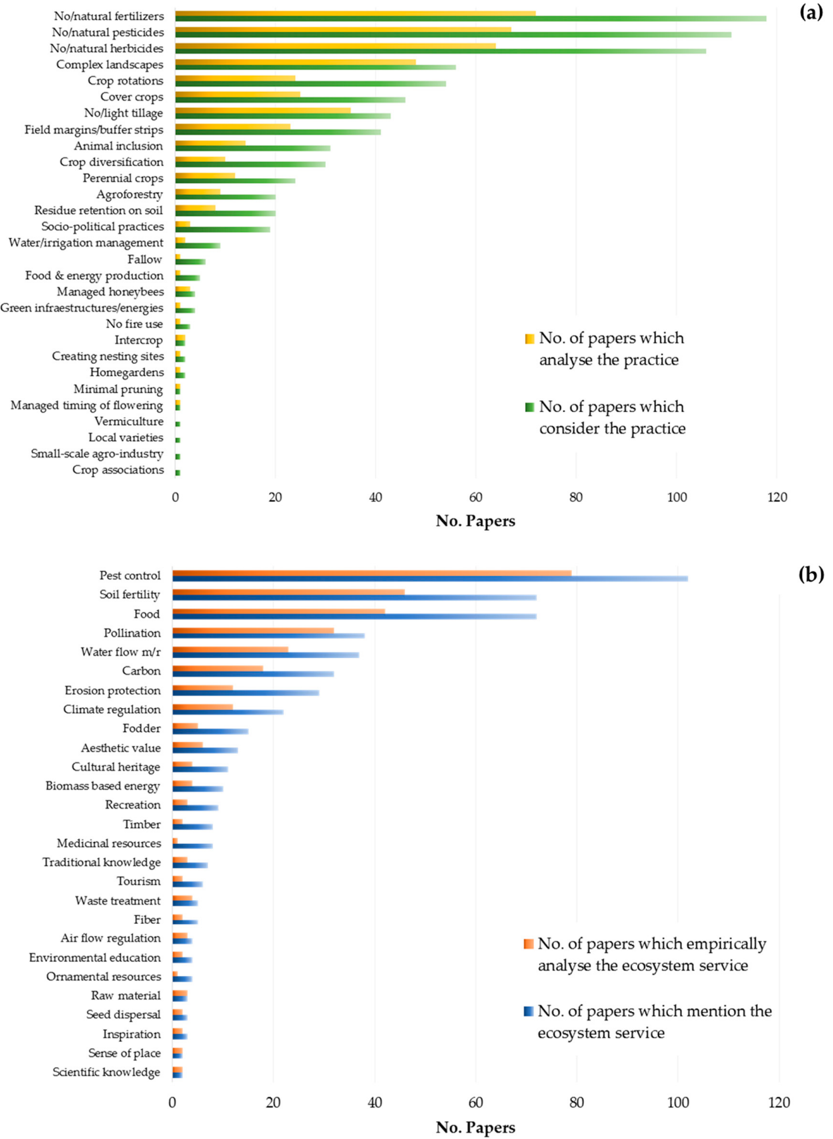
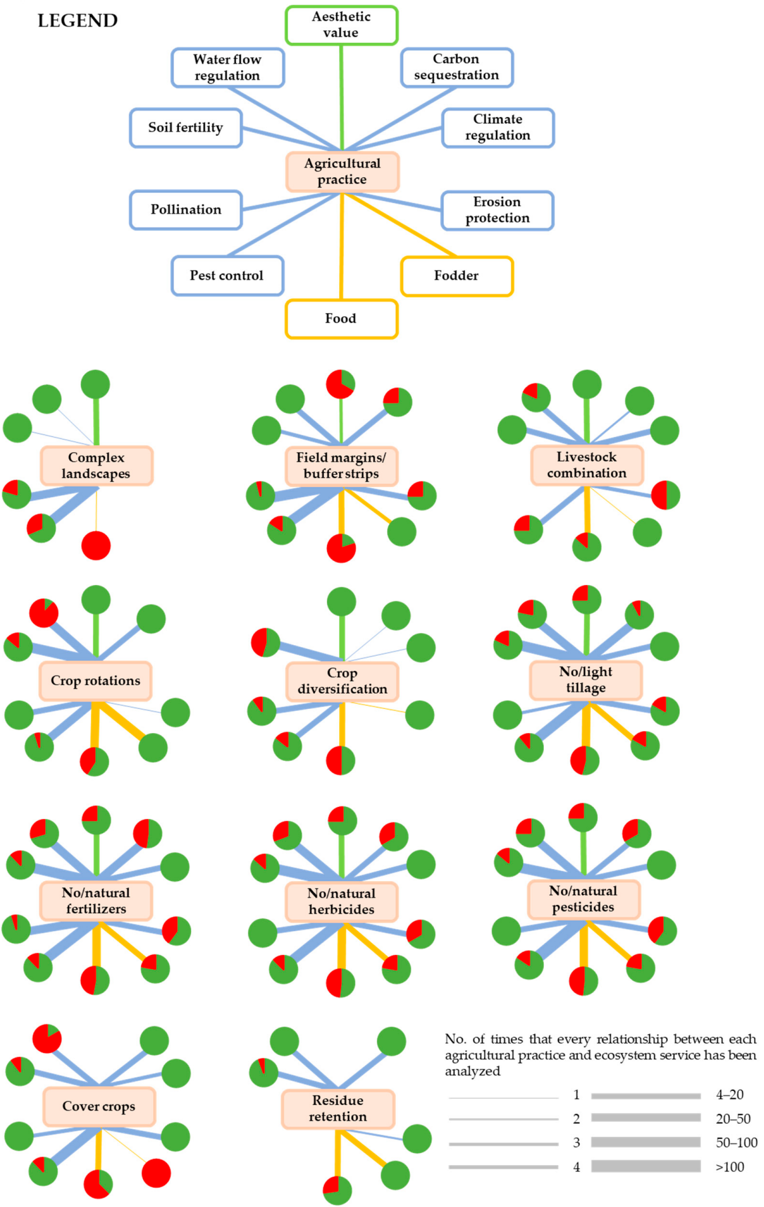
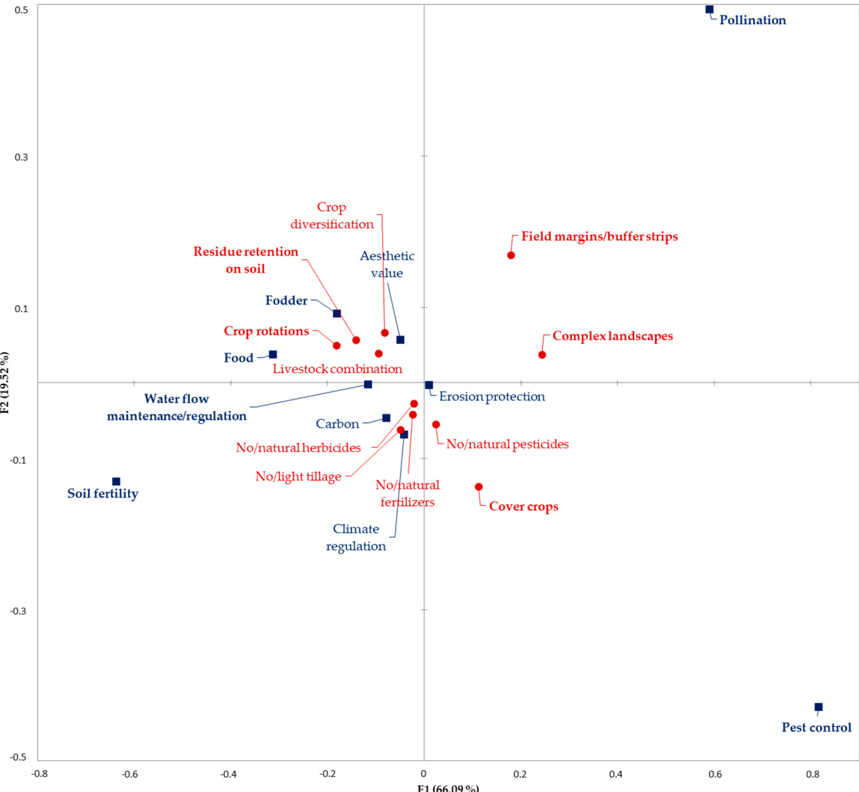
Current patterns of global change are threatening the supply of agrarian ecosystem services on which human well-being depends. Within this context, agroecology has emerged within political and scientific arenas as a socially equitable and ecologically sustainable alternative to conventional agriculture. We performed a systematic literature review to explore how agroecology and the ecosystem services framework have been adopted together in the scientific literature, focusing on studies including empirical data on the effects of agroecological practices on the supply of ecosystem services. In our search, we combined terms related to agricultural practices and terms related to ecosystem services. A total of 179 scientific articles were analyzed. Most of the studies used a biophysical approach to evaluate ecosystem services, with regulating and provisioning services being more frequently analyzed than cultural services. More than half of the analyzed relationships between agroecological practices and ecosystem services were positive. Remarkably, our review showed that many of the ten elements of agroecology defined by the FAO have not been properly addressed in the literature. Finally, we identified research gaps and provided insights on where future research and policies should be focused in order to promote the transition towards sustainable agrarian social-ecological systems that increase the supply of ecosystem services while minimizing environmental impacts.
Overview
The claims and statistics of this paper haven’t been checked yet.
Free: it reads the open-access text and checks the first 5 claims that cite a source we can check. Create a free account to check every claim.
Integrity signals
Registry
Cites
Statistics
Figures



Verification
Claims the paper makes
The claims and statistics of this paper haven’t been checked yet.
Free: it reads the open-access text and checks the first 5 claims that cite a source we can check. Create a free account to check every claim.
Claims other papers make about this one
Each is checked against this paper’s own text: does it say what the citing paper says it does?
The cited source says what the claim attributes to it.
In the citing paper
“The temporal and spatial diversification of crops in the field and complimentary rotations can fulfil the need to produce multiple outputs while enhancing ecosystem services [7,8].”
From An Actor-Oriented Multi-Criteria Assessment Framework to Support a Transition towards Sustainable Agricultural Systems Based on Crop Diversification (2020) · cites this paper as [8]
Self-check
Percentages, sums and reported differences re-computed from the paper’s own numbers.
The self-check needs the paper’s full text.
Citations
Cites
Shamseer, L., Moher, D., Clarke, M., Ghersi, D., Liberati, A., Petticrew, M., Shekelle, P., Stewart, L. A., & the PRISMA-P Group (2015) · BMJ · doi:10.1136/bmj.g7647 · Cited by 13,120 · cited 1×
“To conduct our literature review, we adapted the Preferred Reporting Items for Systematic Reviews and Meta-Analysis (PRISMA) protocol [41] to the particularities of our study.”
MethodFood Security: The Challenge of Feeding 9 Billion People
Godfray, H. C. J., Beddington, J. R., Crute, I. R., Haddad, L., Lawrence, D., Muir, J. F., Pretty, J., Robinson, S., Thomas, S. M., & Toulmin, C. (2010) · Science · doi:10.1126/science.1185383 · Cited by 11,943
Agricultural sustainability and intensive production practices
Tilman, D., Cassman, K. G., Matson, P. A., Naylor, R., & Polasky, S. (2002) · Nature · doi:10.1038/nature01014 · Cited by 7,957
Agricultural Intensification and Ecosystem Properties
Matson, P. A., Parton, W. J., Power, A. G., & Swift, M. J. (1997) · Science · doi:10.1126/science.277.5325.504 · Cited by 3,160
Breeding Technologies to Increase Crop Production in a Changing World
Tester, M., & Langridge, P. (2010) · Science · doi:10.1126/science.1183700 · Cited by 2,322
Farming and the Fate of Wild Nature
Green, R. E., Cornell, S. J., Scharlemann, J. P. W., & Balmford, A. (2005) · Science · doi:10.1126/science.1106049 · Cited by 2,238
Global food security, biodiversity conservation and the future of agricultural intensification
Tscharntke, T., Clough, Y., Wanger, T. C., Jackson, L., Motzke, I., Perfecto, I., Vandermeer, J., & Whitbread, A. (2012) · Biological Conservation · doi:10.1016/j.biocon.2012.01.068 · Cited by 2,066
Farmers’ adoption of conservation agriculture: A review and synthesis of recent research
Knowler, D., & Bradshaw, B. (2007) · Food Policy · doi:10.1016/j.foodpol.2006.01.003 · Cited by 1,839
Ecosystem services and dis-services to agriculture
Zhang, W., Ricketts, T. H., Kremen, C., Carney, K., & Swinton, S. M. (2007) · Ecological Economics · doi:10.1016/j.ecolecon.2007.02.024 · Cited by 1,590 · cited 2×
“Agroecosystems clearly illustrate those interactions between nature and society, being providers of ecosystem services but also posing some threats and negative consequences for the environment [39].”
BackgroundAgroecology as a science, a movement and a practice. A review
Wezel, A., Bellon, S., Doré, T., Francis, C., Vallod, D., & David, C. (2009) · Agronomy for Sustainable Development · doi:10.1051/agro/2009004 · Cited by 1,504
Tilman, D. (1999) · Proceedings of the National Academy of Sciences · doi:10.1073/pnas.96.11.5995 · Cited by 1,406
Agroecological practices for sustainable agriculture. A review
Wezel, A., Casagrande, M., Celette, F., Vian, J.-F., Ferrer, A., & Peigné, J. (2014) · Agronomy for Sustainable Development · doi:10.1007/s13593-013-0180-7 · Cited by 1,227 · cited 7×
“Additionally, the introduction of livestock facilitates the replacement of chemical fertilizers by animal manure [50].”
BackgroundInfluentialAgroecology: the science of natural resource management for poor farmers in marginal environments
Altieri, M. A. (2002) · Agriculture, Ecosystems & Environment · doi:10.1016/s0167-8809(02)00085-3 · Cited by 1,136
GRAZING SYSTEMS, ECOSYSTEM RESPONSES, AND GLOBAL CHANGE
Asner, G. P., Elmore, A. J., Olander, L. P., Martin, R. E., & Harris, A. T. (2004) · Annual Review of Environment and Resources · doi:10.1146/annurev.energy.29.062403.102142 · Cited by 1,129 · cited 1×
“Currently, agricultural systems are the most widespread land use on the planet, with permanent crops and pastures covering more than 37% of the terrestrial global surface [1,2].”
BackgroundKremen, C., & Miles, A. (2012) · Ecology and Society · doi:10.5751/es-05035-170440 · Cited by 1,126 · cited 1×
“7 billion in 2050 [12] raises questions about how agricultural systems should be adapted to supply enough food to satisfy the growing demand while maintaining ecosystem health and fostering social equity [13].”
BackgroundThe environmental consequences of adopting conservation tillage in Europe: reviewing the evidence
Holland, J. M. (2004) · Agriculture, Ecosystems & Environment · doi:10.1016/j.agee.2003.12.018 · Cited by 1,062
USING WINTER COVER CROPS TO IMPROVE SOIL AND WATER QUALITY
Dabney, S. M., Delgado, J. A., & Reeves, D. W. (2001) · Communications in Soil Science and Plant Analysis · doi:10.1081/css-100104110 · Cited by 1,035
Agroecology: The Ecology of Food Systems
Francis, C., Lieblein, G., Gliessman, S., Breland, T. A., Creamer, N., Harwood, R., Salomonsson, L., Helenius, J., Rickerl, D., Salvador, R., et al. (2003) · Journal of Sustainable Agriculture · doi:10.1300/j064v22n03_10 · Cited by 975
Ecosystem services and agriculture: Cultivating agricultural ecosystems for diverse benefits
Swinton, S. M., Lupi, F., Robertson, G. P., & Hamilton, S. K. (2007) · Ecological Economics · doi:10.1016/j.ecolecon.2007.09.020 · Cited by 878 · cited 1×
“Within this context, an appropriate selection of agricultural practices may result in an enhancement of the supply of ecosystem services and a reduction in environmental impacts at the farm and landscape scales [39,40].”
BackgroundSoane, B. D., Ball, B. C., Arvidsson, J., Basch, G., Moreno, F., & Roger-Estrade, J. (2012) · Soil and Tillage Research · doi:10.1016/j.still.2011.10.015 · Cited by 820
Scherr, S. J., & McNeely, J. A. (2008) · Philosophical Transactions of the Royal Society B: Biological Sciences · doi:10.1098/rstb.2007.2165 · Cited by 811
Altieri, M. A., Funes-Monzote, F. R., & Petersen, P. (2012) · Agronomy for Sustainable Development · doi:10.1007/s13593-011-0065-6 · Cited by 803 · cited 1×
“Government policies, public and private institutions, non-governmental organizations, researchers, markets, agroecological organizations, consumers and the media [22,57,59,79,81] also play a crucial role in compiling and disseminating agroecological knowledge [22,57,80].”
BackgroundThe agroecological matrix as alternative to the land-sparing/agriculture intensification model
Perfecto, I., & Vandermeer, J. (2010) · Proceedings of the National Academy of Sciences · doi:10.1073/pnas.0905455107 · Cited by 732
Using cover crops to mitigate and adapt to climate change. A review
Kaye, J. P., & Quemada, M. (2017) · Agronomy for Sustainable Development · doi:10.1007/s13593-016-0410-x · Cited by 673
How to implement biodiversity-based agriculture to enhance ecosystem services: A review
Duru, M., Therond, O., Martin, G., Martin-Clouaire, R., Magne, M.-A., Justes, E., Journet, E.-P., Aubertot, J.-N., Savary, S., Bergez, J.-E., et al. (2015) · Agronomy for Sustainable Development · doi:10.1007/s13593-015-0306-1 · Cited by 659
Agroecology, small farms, and food sovereignty
Altieri, M. A. (2009) · Monthly Review · doi:10.14452/mr-061-03-2009-07_8 · Cited by 575
Utilizing and conserving agrobiodiversity in agricultural landscapes
Jackson, L. E., Pascual, U., & Hodgkin, T. (2007) · Agriculture, Ecosystems & Environment · doi:10.1016/j.agee.2006.12.017 · Cited by 560
Designing agroecological transitions; A review
Duru, M., Therond, O., & Fares, M. (2015) · Agronomy for Sustainable Development · doi:10.1007/s13593-015-0318-x · Cited by 542
Ervin, C. A., & Ervin, D. E. (1982) · Land Economics · doi:10.2307/3145937 · Cited by 522
Extinction, Substitution, and Ecosystem Services
Ehrlich, P. R., & Mooney, H. A. (1983) · BioScience · doi:10.2307/1309037 · Cited by 506 · cited 1×
“The ecosystem services concept emerged in the late 1960s [35], although its first mention in a scientific paper was not until 1983 [36].”
BackgroundBringing agroecology to scale: key drivers and emblematic cases
Mier y Terán Giménez Cacho, M., Giraldo, O. F., Aldasoro, M., Morales, H., Ferguson, B. G., Rosset, P., Khadse, A., & Campos, C. (2018) · Agroecology and Sustainable Food Systems · doi:10.1080/21683565.2018.1443313 · Cited by 413 · cited 4×
“) to producers are essential to foster the application of certain practices or acquire specific materials [59].”
BackgroundInfluentialNutritional quality and safety of organic food. A review
Lairon, D. (2010) · Agronomy for Sustainable Development · doi:10.1051/agro/2009019 · Cited by 408
Conservation tillage for carbon sequestration
Lal, R., & Kimble, J. M. (1997) · Nutrient Cycling in Agroecosystems · doi:10.1023/a:1009794514742 · Cited by 408
Biodiversity can support a greener revolution in Africa
Snapp, S. S., Blackie, M. J., Gilbert, R. A., Bezner-Kerr, R., & Kanyama-Phiri, G. Y. (2010) · Proceedings of the National Academy of Sciences · doi:10.1073/pnas.1007199107 · Cited by 405
Ending World Hunger. The Promise of Biotechnology and the Threat of Antiscience Zealotry
Borlaug, N. E. (2000) · Plant Physiology · doi:10.1104/pp.124.2.487 · Cited by 327
Willock, J., Deary, I. J., McGregor, M. M., Sutherland, A., Edwards-Jones, G., Morgan, O., Dent, B., Grieve, R., Gibson, G., & Austin, E. (1999) · Journal of Vocational Behavior · doi:10.1006/jvbe.1998.1642 · Cited by 324
A new analytical framework of farming system and agriculture model diversities. A review
Therond, O., Duru, M., Roger-Estrade, J., & Richard, G. (2017) · Agronomy for Sustainable Development · doi:10.1007/s13593-017-0429-7 · Cited by 293
Gliessman, S. (2018) · Agroecology and Sustainable Food Systems · doi:10.1080/21683565.2018.1432329 · Cited by 290
Rusch, A., Bommarco, R., Jonsson, M., Smith, H. G., & Ekbom, B. (2013) · Journal of Applied Ecology · doi:10.1111/1365-2664.12055 · Cited by 252
Agroecology Scaling Up for Food Sovereignty and Resiliency
Altieri, M. A., & Nicholls, C. I. (2012) · Sustainable Agriculture Reviews · doi:10.1007/978-94-007-5449-2_1 · Cited by 250 · cited 1×
“Government policies, public and private institutions, non-governmental organizations, researchers, markets, agroecological organizations, consumers and the media [22,57,59,79,81] also play a crucial role in compiling and disseminating agroecological knowledge [22,57,80].”
BackgroundFood quality assessment in organic vs. conventional agricultural produce: Findings and issues
Gomiero, T. (2018) · Applied Soil Ecology · doi:10.1016/j.apsoil.2017.10.014 · Cited by 234
Migliorini, P., & Wezel, A. (2017) · Agronomy for Sustainable Development · doi:10.1007/s13593-017-0472-4 · Cited by 206 · cited 1×
“Additionally, regardless of the fact that agroecology is not market-driven or unanimously defined within the political and scientific arenas [29], the use of this concept and the inclusion of its principles in public policies and global agencies’ publications are currently developing [30–34].”
BackgroundPhipps, R., & Park, J. (2002) · Journal of Animal and Feed Sciences · doi:10.22358/jafs/67788/2002 · Cited by 199
Sharma, N. K., Singh, R. J., Mandal, D., Kumar, A., Alam, N. M., & Keesstra, S. (2017) · Agriculture, Ecosystems & Environment · doi:10.1016/j.agee.2017.06.026 · Cited by 193
Valuation of wildlife resources
Helliwell, D. R. (1969) · Regional Studies · doi:10.1080/09595236900185051 · Cited by 181 · cited 1×
“The ecosystem services concept emerged in the late 1960s [35], although its first mention in a scientific paper was not until 1983 [36].”
BackgroundRoldán, A., Salinas-García, J. R., Alguacil, M. M., & Caravaca, F. (2005) · Applied Soil Ecology · doi:10.1016/j.apsoil.2005.01.004 · Cited by 175
Organic farming induces changes in soil microbiota that affect agro-ecosystem functions
Bonanomi, G., De Filippis, F., Cesarano, G., La Storia, A., Ercolini, D., & Scala, F. (2016) · Soil Biology and Biochemistry · doi:10.1016/j.soilbio.2016.09.005 · Cited by 174 · cited 1×
“One reason that might explain the high number of studies including the nonuse of external inputs or agrochemicals is that those practices are mandatory in organic agriculture, which was the most studied system in our literature review [67,68].”
BackgroundVooren, L. V., Reubens, B., Broekx, S., FRENNE, P. D., Nelissen, V., Pardon, P., & Verheyen, K. (2017) · Agriculture Ecosystems & Environment · doi:10.1016/j.agee.2017.04.015 · Cited by 142
Naab, J. B., Mahama, G. Y., Yahaya, I., & Prasad, P. V. V. (2017) · Frontiers in Plant Science · doi:10.3389/fpls.2017.00996 · Cited by 129
Beyond yields: Climate change effects on specialty crop quality and agroecological management
Ahmed, S., & Stepp, J. R. (2016) · Elementa Science of the Anthropocene · doi:10.12952/journal.elementa.000092 · Cited by 120
Agroecology: growing the roots of resistance
Gliessman, S. R. (2013) · Hispana · Cited by 112
Seeds of plenty, seeds of want. Social and economic implications of the Green Revolution.
Pearse, A. S. (1980) · Cited by 112
Agroecology for Food Security and Nutrition
Gliessman, S., & Tittonell, P. (2015) · Agroecology and Sustainable Food Systems · doi:10.1080/21683565.2014.972001 · Cited by 86
Weißhuhn, P., Reckling, M., Stachow, U., & Wiggering, H. (2017) · Sustainability · doi:10.3390/su9122267 · Cited by 86
Weed seed predation in organic and conventional fields
Navntoft, S., Wratten, S. D., Kristensen, K., & Esbjerg, P. (2008) · Biological Control · doi:10.1016/j.biocontrol.2008.12.003 · Cited by 80 · cited 1×
“One reason that might explain the high number of studies including the nonuse of external inputs or agrochemicals is that those practices are mandatory in organic agriculture, which was the most studied system in our literature review [67,68].”
BackgroundIsaacs, K., Snapp, S. S., Chung, K. R., & Waldman, K. B. (2016) · Food Security · doi:10.1007/s12571-016-0582-x · Cited by 75
Hatt*, S., Artru*, S., Brédart, D., Lassois, L., Francis, F., Haubruge, É., Garré, S., Stassart, P. M., Dufrêne, M., Monty, A., et al. (2016) · BASE · doi:10.25518/1780-4507.12997 · Cited by 74
Makate, C., Makate, M., & Mango, N. (2017) · African Journal of Science Technology Innovation and Development · doi:10.1080/20421338.2017.1322350 · Cited by 64
Theoretical investigation of the effects of field margin and hedges on crop yields
Kuemmel, B. (2003) · Agriculture Ecosystems & Environment · doi:10.1016/s0167-8809(02)00086-5 · Cited by 36
Transforming Food Systems to Sustainability with Agroecology
Gliessman, S. (2011) · Journal of Sustainable Agriculture · doi:10.1080/10440046.2011.611585 · Cited by 36 · cited 2×
“Government policies, public and private institutions, non-governmental organizations, researchers, markets, agroecological organizations, consumers and the media [22,57,59,79,81] also play a crucial role in compiling and disseminating agroecological knowledge [22,57,80].”
BackgroundDeclaration of the International Forum for Agroecology, Nyéléni, Mali: 27 February 2015
(2015) · Development · doi:10.1057/s41301-016-0014-4 · Cited by 34
Agroecology as a Transdisciplinary Science for a Sustainable Agriculture
Caporali, F. (2010) · Sustainable agriculture reviews · doi:10.1007/978-90-481-9513-8_1 · Cited by 33
Vooren, L. V., Reubens, B., Ampoorter, E., Broekx, S., Pardon, P., Waes, C. V., & Verheyen, K. (2018) · Environmental Management · doi:10.1007/s00267-018-1043-4 · Cited by 29
Reflexiones acerca de los aspectos epistemológicos de la agroecología
Alvarez-Salas, L. M., Polanco-Echeverry, D. N., & Ríos-Osório, L. A. (2014) · Cuadernos de Desarrollo Rural · doi:10.11144/javeriana.crd11-74.raea · Cited by 22 · cited 1×
“As a consequence, most studies have only focused on one or few dimensions of agroecology, with quantitative studies generally being oriented toward the analysis of the ecological-productive dimension and qualitative studies being focused on the analysis of social-political issues [49].”
BackgroundThe Green Revolution: For Bread and Peace
Borlaug, N. E. (1971) · Bulletin of the Atomic Scientists · doi:10.1080/00963402.1971.11455372 · Cited by 19 · cited 1×
“The so-called Green Revolution (which emerged in the 1940s and spread worldwide during the 1960s and 1970s) introduced a new standardized set of technologies and high-yielding crop varieties within agricultural systems in the search for solutions to world hunger and food deprivation [3].”
BackgroundZhou, Y., Zhu, H., & Yao, Q. (2017) · Springer eBooks · doi:10.1007/978-3-319-49724-2_8 · Cited by 15
Enhancing Ecosystem Services in Belgian Agriculture through Agroecology
Peeters, A., Dendoncker, N., & Jacobs, S. (2013) · Elsevier eBooks · doi:10.1016/b978-0-12-419964-4.00022-6 · Cited by 13 · cited 1×
“During recent decades, the “ecosystem service*” records in Web of Science rapidly grew from 79 in the 1990s, to 1829 in the 2000s and to 17,526 in 2017, mainly due to the publication of the Millennium Ecosystem Assessment (MEA) in 2005 and the implementation of the Intergovernmental Science-Policy Platform on Biodiver…”
Background
Research works printed but not linked: 3
- Altieri, M.A. (1995). Agroecology: The Science of Sustainable Agriculture, CRC Press. [2nd ed.].
- MEA (Millennium Ecosystem Assessment) (2005). Ecosystems and Human Well-Being: Synthesis, Inland Press.
- McKay, B. (2012). A Socially Inclusive Pathway to Food Security: The Agroecological Alternative, Bureau for Development Policy, United Nations Development Programme and the Government of Brazil. Available online: http://hdl.handle.net/1765/50349.
Cited by
Assessing resilience and adaptability in agroecological transitions
Tittonell, P. (2020) · Agricultural Systems · doi:10.1016/j.agsy.2020.102862 · Cited by 199
Agroecology Now! Transformations Towards More Just and Sustainable Food Systems
Anderson, C., Bruil, J., Chappell, M. J., Kiss, C., & Pimbert, M. P. (2020) · Springer eBooks · doi:10.1007/978-3-030-61315-0 · Cited by 258
Smart agriculture assurance: IoT and blockchain for trusted sustainable produce
Hasan, H. R., Musamih, A., Salah, K., Jayaraman, R., Omar, M., Arshad, J., & Boscovic, D. (2024) · Computers and Electronics in Agriculture · doi:10.1016/j.compag.2024.109184 · Cited by 181
Morel, K., Revoyron, E., San Cristobal, M., & Baret, P. V. (2020) · PLOS ONE · doi:10.1371/journal.pone.0229910 · Cited by 111
“It could be a pillar of agroecological transition, as it potentially has multiple sustainability benefits, such as reduced yield gaps and dependency on external inputs, increased biodiversity, limited economic risks, more varied landscapes, and enhanced provision of diverse ecosystem services [16, 32, 34].”
BackgroundDardonville, M., Urruty, N., Bockstaller, C., & Thérond, O. (2020) · Agricultural Systems · doi:10.1016/j.agsy.2020.102913 · Cited by 119
Metadata
- Authors
- Palomo-Campesino, S., González, J. A., & García-Llorente, M.
- Affiliations
- Madrid Institute for Rural, Agrarian and Food Research and Development (ES)
- Universidad Autónoma de Madrid (ES)
- Department of Applied Research and Agricultural Extension, Madrid Institute for Rural, Agricultural and Food Research and Development (IMIDRA), Ctra. Madrid-Barcelona (N-II) KM. 38.200, 28802 Alcalá de Henares, Madrid, Spain
- Venue
- Sustainability
- Publisher
- MDPI AG
- Published
- 2018-11-22
- Volume
- 10
- Issue
- 12
- Pages
- 4339
- ISSN
- 2071-1050 (ISSN-L)
- OpenAlex
- W2901218053
- Cited by
- 116
- References
- 67
- Citations by year
- 2026: 11 · 2025: 14 · 2024: 22 · 2023: 17 · 2022: 17 · 2021: 17 · 2020: 15 · 2019: 3
- FWCI
- 0.97
- Type
- journal article
- Language
- en
- Open access
- gold
- dx.doi.org
- Licence
- Locations
- Sustainability (publishedVersion, cc-by)
- LA Referencia (Red Federada de Repositorios Institucionales de Publicaciones Científicas) (publishedVersion)
- Biblos-e Archivo (Universidad Autónoma de Madrid) (submittedVersion, public-domain)
- RePEc: Research Papers in Economics (submittedVersion)
- DOAJ (DOAJ: Directory of Open Access Journals) (submittedVersion, cc-by-sa)
- Hispana (submittedVersion)
- Funders
- Instituto Nacional de Investigación y Tecnología Agraria y Alimentaria (CPD2016-0187, “Evaluación de los servicios de los ecosistemas agrarios” (FP16-ECO; 2016-2018))
- Topics
- Physical Sciences › Environmental Science › Global and Planetary Change › Land Use and Ecosystem Services
- Social Sciences › Development › Agriculture, Land Use, Rural Development
- Life Sciences › Agricultural and Biological Sciences › General Agricultural and Biological Sciences › Plant and soil sciences
- Keywords
- agroecology, agroecological practices, ecosystem services, sustainable agriculture, social-ecological systems, regulating services, provisioning services, cultural ecosystem services, research gaps, agricultural policy
About these checks
Registry, retraction, Cites and statistics results are computed, not judged, with one exception: a printed reference that no index lists is read once by a model before it counts as a citation error. Claims are extracted by a model and kept only when their quote appears verbatim in the text; each cited source is then checked, with a model’s help, for whether it says what the claim relies on. Those verdicts can be wrong — read the claim’s quote and the cited source before relying on one.
Statistics and arithmetic are recomputed, not judged.
Confidence bands are shown only for fields calibrated on our annotated test set. None is calibrated yet, so no band is shown.
What counts as a claim ›How we measure confidence ›How we check this ›
Are you an author, or do you see a problem with this page? Request a review
Data sources
Bibliographic data: Semantic Scholar, OpenAlex, Crossref.
Contains information from the Semantic Scholar Academic Graph Datasets, made available under the ODC Attribution License (ODC-BY 1.0).
Semantic Scholar’s data is described in: Kinney, R., et al. (2023). The Semantic Scholar Open Data Platform. arXiv:2301.10140.
