

The DOI matches its Crossref record; 36 of the 36 references it cites were found in a registry or an index.
Characterization of mRNA and microRNA in human mast cell-derived exosomes and their transfer to other mast cells and blood CD34 progenitor cells
Open accessAbstract
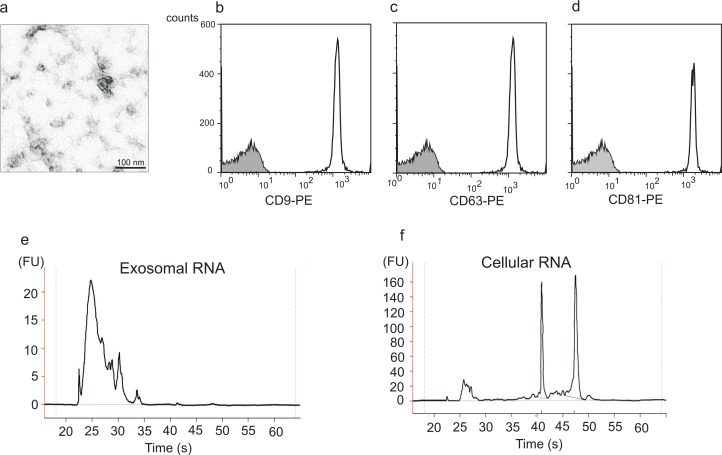
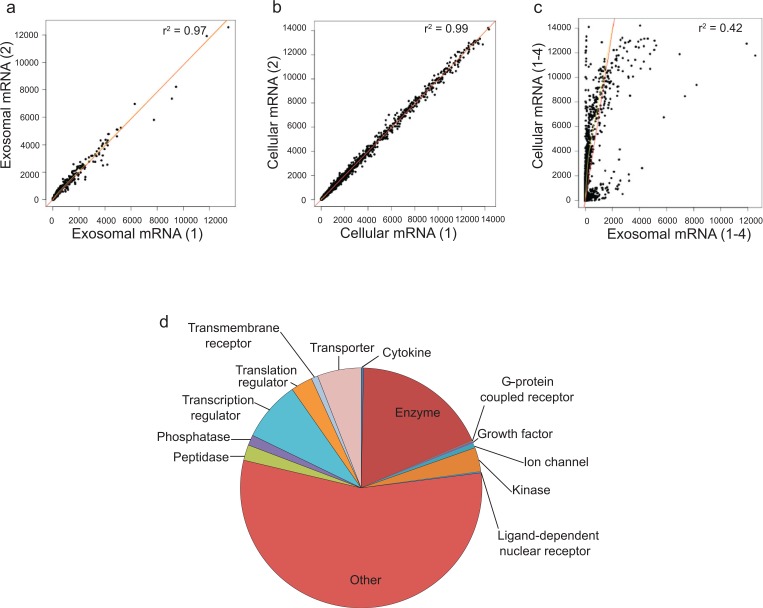
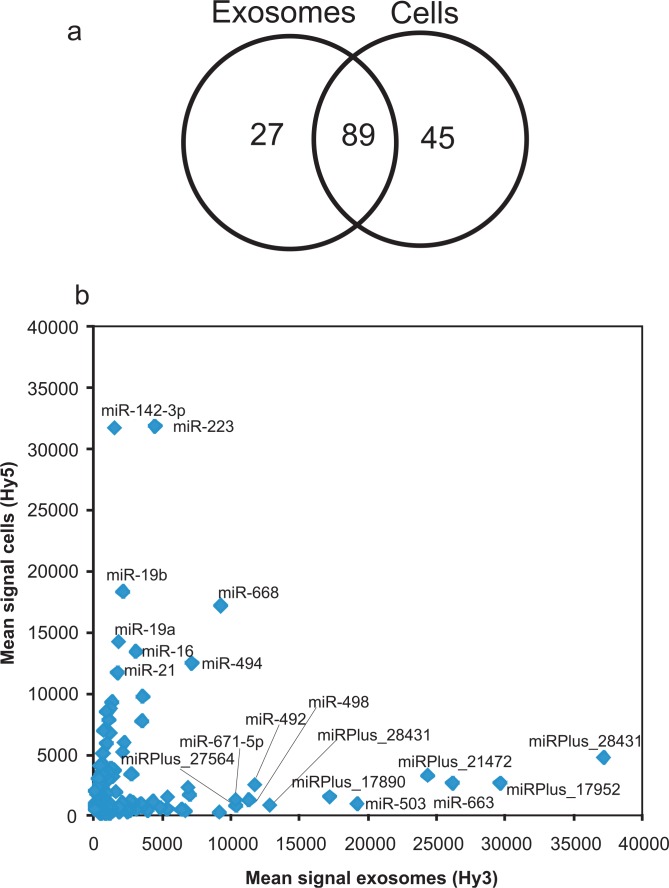
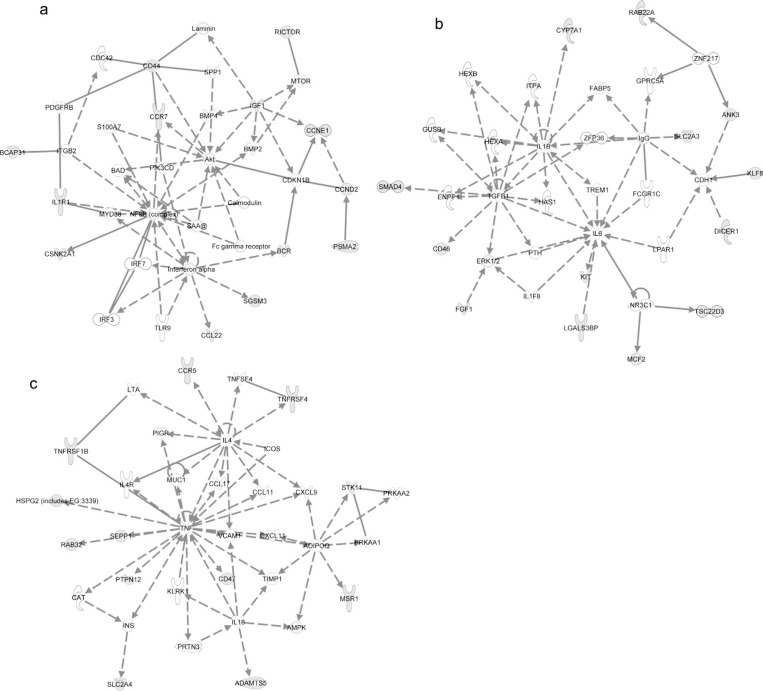
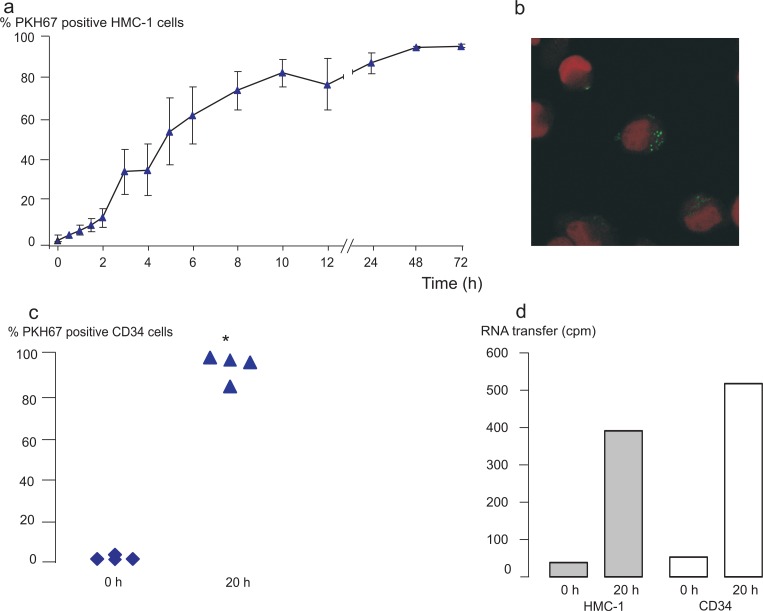
Background: Exosomes are nanosized vesicles of endocytic origin that are released into the extracellular environment by many different cells. It has been shown that exosomes from various cellular origins contain a substantial amount of RNA (mainly mRNA and microRNA). More importantly, exosomes are capable of delivering their RNA content to target cells, which is a novel way of cell‐to‐cell communication. The aim of this study was to evaluate whether exosomal shuttle RNA could play a role in the communication between human mast cells and between human mast cells and human CD34 + progenitor cells. Methods: The mRNA and microRNA content of exosomes from a human mast cell line, HMC‐1, was analysed by using microarray technology. Co‐culture experiments followed by flow cytometry analysis and confocal microscopy as well as radioactive labeling experiments were performed to examine the uptake of these exosomes and the shuttle of the RNA to other mast cells and CD34 + progenitor cells. Results: In this study, we show that human mast cells release RNA‐containing exosomes, with the capacity to shuttle RNA between cells. Interestingly, by using microRNA microarray analysis, 116 microRNAs could be identified in the exosomes and 134 microRNAs in the donor mast cells. Furthermore, DNA microarray experiments revealed the presence of approximately 1800 mRNAs in the exosomes, which represent 15% of the donor cell mRNA content. In addition, transfer experiments revealed that exosomes can shuttle RNA between human mast cells and to CD34 + hematopoietic progenitor cells. Conclusion: These findings suggest that exosomal shuttle RNA (esRNA) can play a role in the communication between cells, including mast cells and CD34 + progenitor cells, implying a role in cells maturation process.
Overview
The claims and statistics of this paper haven’t been checked yet.
Run the check — free, no account needed. It reads the open-access text and checks the sources it cites.
Integrity signals
Registry
Cites
Statistics
Figures
Verification
Claims the paper makes
The claims and statistics of this paper haven’t been checked yet.
Run the check — free, no account needed. It reads the open-access text and checks the sources it cites.
Claims other papers make about this one
Each is checked against this paper’s own text: does it say what the citing paper says it does?
In the citing paper
“Recent studies indicate that they contain proteins, nucleic acids and miRNAs (Ekström et al., 2012; Costa-Silva et al., 2015; Simons and Raposo, 2009).”
From Tumor microenvironment derived exosomes pleiotropically modulate cancer cell metabolism (2016) · cites this paper as Ekström et al., 2012
Self-check
Percentages, sums and reported differences re-computed from the paper’s own numbers.
The self-check needs the paper’s full text.
Citations
Cites
1 retracted
RETRACTED: MicroRNA signatures of tumor-derived exosomes as diagnostic biomarkers of ovarian cancer
Taylor, D. D., & Gerçel-Taylor, Ç. (2008) · Gynecologic Oncology · doi:10.1016/j.ygyno.2008.04.033 · Cited by 2,333
RetractedValadi, H., Ekström, K., Bossios, A., Sjöstrand, M., Lee, J. J., & Lötvall, J. O. (2007) · Nature Cell Biology · doi:10.1038/ncb1596 · Cited by 12,834
Self-citationSkog, J., Würdinger, T., van Rijn, S., Meijer, D. H., Gainche, L., Curry, W. T., Carter, B. S., Krichevsky, A. M., & Breakefield, X. O. (2008) · Nature Cell Biology · doi:10.1038/ncb1800 · Cited by 5,001
Delivery of siRNA to the mouse brain by systemic injection of targeted exosomes
Alvarez-Erviti, L., Seow, Y., Yin, H., Betts, C., Lakhal, S., & Wood, M. J. A. (2011) · Nature Biotechnology · doi:10.1038/nbt.1807 · Cited by 4,930
Combinatorial microRNA target predictions
Krek, A., Grün, D., Poy, M. N., Wolf, R., Rosenberg, L., Epstein, E. J., MacMenamin, P., da Piedade, I., Gunsalus, K. C., Stoffel, M., et al. (2005) · Nature Genetics · doi:10.1038/ng1536 · Cited by 4,603
B lymphocytes secrete antigen-presenting vesicles.
Raposo, G., Nijman, H. W., Stoorvogel, W., Liejendekker, R., Harding, C. V., Melief, C. J., & Geuze, H. J. (1996) · The Journal of experimental medicine · doi:10.1084/jem.183.3.1161 · Cited by 3,546
Identification and proteomic profiling of exosomes in human urine
Pisitkun, T., Shen, R., & Knepper, M. A. (2004) · Proceedings of the National Academy of Sciences · doi:10.1073/pnas.0403453101 · Cited by 2,162
Pan, B., & Johnstone, R. M. (1983) · Cell · doi:10.1016/0092-8674(83)90040-5 · Cited by 2,042
Secretory Mechanisms and Intercellular Transfer of MicroRNAs in Living Cells
Kosaka, N., Iguchi, H., Yoshioka, Y., Takeshita, F., Matsuki, Y., & Ochiya, T. (2010) · Journal of Biological Chemistry · doi:10.1074/jbc.m110.107821 · Cited by 1,934
Functional delivery of viral miRNAs via exosomes
Pegtel, D. M., Cosmopoulos, K., Thorley‐Lawson, D. A., van Eijndhoven, M. A. J., Hopmans, E. S., Lindenberg, J. L., de Gruijl, T. D., Würdinger, T., & Middeldorp, J. M. (2010) · Proceedings of the National Academy of Sciences · doi:10.1073/pnas.0914843107 · Cited by 1,672
Research works printed but not linked: 1
- Karlsson M, 2001, “Tolerosomes” are produced by intestinal epithelial cells, 31, 2892
Cited by
Sorted by citations
Biological properties of extracellular vesicles and their physiological functions
Yáñez‐Mó, M., Siljander, P. R. ‐., Andreu, Z., Bedina Zavec, A., Borràs, F. E., Buzas, E. I., Buzas, K., Casal, E., Cappello, F., Carvalho, J., et al. (2015) · Journal of Extracellular Vesicles · doi:10.3402/jev.v4.27066 · Cited by 5,926
Self-citationWitwer, K. W., Buzás, E. I., Bemis, L., Bora, A., Lässer, C., Lötvall, J. O., Hoen, E. N. M. N., Piper, M. G., Sivaraman, S., Skog, J., et al. (2013) · Journal of Extracellular Vesicles · doi:10.3402/jev.v2i0.20360 · Cited by 2,513
Self-citationExosome and Exosomal MicroRNA: Trafficking, Sorting, and Function
Zhang, J., Li, S., Li, L., Li, M., Guo, C., Yao, J., & Mi, S. (2015) · Genomics, Proteomics & Bioinformatics · doi:10.1016/j.gpb.2015.02.001 · Cited by 1,901
RNA delivery by extracellular vesicles in mammalian cells and its applications
O’Brien, K., Breyne, K., Ughetto, S., Laurent, L. C., & Breakefield, X. O. (2020) · Nature Reviews Molecular Cell Biology · doi:10.1038/s41580-020-0251-y · Cited by 1,811
Crescitelli, R., Lässer, C., Szabó, T. G., Kittel, A., Eldh, M., Dianzani, I., Buzás, E. I., & Lötvall, J. (2013) · Journal of Extracellular Vesicles · doi:10.3402/jev.v2i0.20677 · Cited by 876
Self-citationExosomes and microvesicles: extracellular vesicles for genetic information transfer and gene therapy
Lee, Y., Andaloussi, S. E., & Wood, M. J. A. (2012) · Human Molecular Genetics · doi:10.1093/hmg/dds317 · Cited by 958
Tumor microenvironment derived exosomes pleiotropically modulate cancer cell metabolism
Zhao, H., Yang, L., Baddour, J., Achreja, A., Bernard, V., Moss, T., Marini, J. C., Tudawe, T., Seviour, E. G., San Lucas, F. A., et al. (2016) · eLife · doi:10.7554/elife.10250 · Cited by 927
Lai, C. P., Kim, E. Y., Badr, C. E., Weissleder, R., Mempel, T. R., Tannous, B. A., & Breakefield, X. O. (2015) · Nature Communications · doi:10.1038/ncomms8029 · Cited by 574
Kim, D., Kang, B., Kim, O. Y., Choi, D., Lee, J., Kim, S. R., Go, G., Yoon, Y. J., Kim, J. H., Jang, S. C., et al. (2013) · Journal of Extracellular Vesicles · doi:10.3402/jev.v2i0.20384 · Cited by 597
Self-citationStem Cell-Derived Exosomes as Nanotherapeutics for Autoimmune and Neurodegenerative Disorders
Riazifar, M., Mohammadi, M. R., Pone, E. J., Yeri, A., Lässer, C., Segaliny, A. I., McIntyre, L. L., Shelke, G. V., Hutchins, E., Hamamoto, A., et al. (2019) · ACS Nano · doi:10.1021/acsnano.9b01004 · Cited by 551
Self-citationExosome-based immunotherapy: a promising approach for cancer treatment
Xu, Z., Zeng, S., Gong, Z., & Yan, Y. (2020) · Molecular Cancer · doi:10.1186/s12943-020-01278-3 · Cited by 482
Cvjetkovic, A., Lötvall, J. O., & Lässer, C. (2014) · Journal of Extracellular Vesicles · doi:10.3402/jev.v3.23111 · Cited by 515
Self-citationShelke, G. V., Lässer, C., Gho, Y. S., & Lötvall, J. O. (2014) · Journal of Extracellular Vesicles · doi:10.3402/jev.v3.24783 · Cited by 455
Self-citationMast Cell Mediators: Their Differential Release and the Secretory Pathways Involved
Moon, T. C., Befus, A. D., & Kulka, M. (2014) · Frontiers in Immunology · doi:10.3389/fimmu.2014.00569 · Cited by 455
Lamichhane, T. N., Raiker, R. S., & Jay, S. M. (2015) · Molecular Pharmaceutics · doi:10.1021/acs.molpharmaceut.5b00364 · Cited by 426
Wu, Y., Deng, W., & Klinke, D. J. (2015) · The Analyst · doi:10.1039/c5an00688k · Cited by 382
KRAS-dependent sorting of miRNA to exosomes
Cha, D. J., Franklin, J. L., Dou, Y., Liu, Q., Higginbotham, J. N., Beckler, M. D., Weaver, A. M., Vickers, K. C., Prasad, N., Levy, S., et al. (2015) · eLife · doi:10.7554/elife.07197 · Cited by 373
Stem Cell Extracellular Vesicles: Extended Messages of Regeneration
Riazifar, M., Pone, E. J., Lötvall, J. O., & Zhao, W. (2016) · The Annual Review of Pharmacology and Toxicology · doi:10.1146/annurev-pharmtox-061616-030146 · Cited by 330
Self-citationEnrichment of selective miRNAs in exosomes and delivery of exosomal miRNAs in vitro and in vivo
Zhang, D., Lee, H., Zhu, Z., Minhas, J., & Jin, Y. (2016) · American Journal of Physiology-Lung Cellular and Molecular Physiology · doi:10.1152/ajplung.00423.2016 · Cited by 324
Statello, L., Maugeri, M., Garre, E., Nawaz, M., Wahlgren, J., Papadimitriou, A., Lundqvist, C., Lindfors, L., Collén, A., Sunnerhagen, P., et al. (2018) · PLOS ONE · doi:10.1371/journal.pone.0195969 · Cited by 242
Self-citationDiagnostic and Prognostic Potential of Extracellular Vesicles in Peripheral Blood
Revenfeld, A. L., Bæk, R., Nielsen, M. H., Stensballe, A., Varming, K., & Jørgensen, M. M. (2014) · Clinical Therapeutics · doi:10.1016/j.clinthera.2014.05.008 · Cited by 265
Emerging roles of exosomes during epithelial–mesenchymal transition and cancer progression
Greening, D. W., Gopal, S. K., Mathias, R. A., Liu, L., Sheng, J., Zhu, H., & Simpson, R. J. (2015) · Seminars in Cell and Developmental Biology · doi:10.1016/j.semcdb.2015.02.008 · Cited by 224
Monocyte Exosomes Stimulate the Osteogenic Gene Expression of Mesenchymal Stem Cells
Ekström, K. M., Omar, O., Granéli, C., Wang, X., Vazirisani, F., & Thomsen, P. (2013) · PLoS ONE · doi:10.1371/journal.pone.0075227 · Cited by 219
Self-citationSecreted microvesicular miR-31 inhibits osteogenic differentiation of mesenchymal stem cells
Weilner, S., Schraml, E., Wieser, M., Messner, P., Schneider, K. H., Wassermann, K. J., Mičutková, L., Fortschegger, K., Maier, A. B., Westendorp, R. G. J., et al. (2016) · Aging Cell · doi:10.1111/acel.12484 · Cited by 216
The roles of exosomal miRNAs and lncRNAs in lung diseases
Yang, L., Yin, Z., Fan, J., Zhang, S., & Yang, W.-B. (2019) · Signal Transduction and Targeted Therapy · doi:10.1038/s41392-019-0080-7 · Cited by 190
Exosomes and Their MicroRNA Cargo: New Players in Peripheral Nerve Regeneration
Qing, L., Chen, H. A., Tang, J., & Jia, X. (2018) · Neurorehabilitation and neural repair · doi:10.1177/1545968318798955 · Cited by 182
Exosomes Generated From iPSC-Derivatives
Jung, J., Fu, X., & Yang, P. C.-M. (2017) · Circulation Research · doi:10.1161/circresaha.116.309307 · Cited by 174
Large Extracellular Vesicles: Have We Found the Holy Grail of Inflammation?
Słomka, A., Urban, S. K., Kornek, M., Żekanowska, E., & Kornek, M. (2018) · Frontiers in Immunology · doi:10.3389/fimmu.2018.02723 · Cited by 165
Immunomodulatory role of microRNAs transferred by extracellular vesicles
Fernández‐Messina, L., Gutiérrez‐Vázquez, C., Rivas‐García, E., Sánchez‐Madrid, F., & de la Fuente, H. (2015) · Biology of the Cell · doi:10.1111/boc.201400081 · Cited by 157
Martínez, C., Rodiño‐Janeiro, B. K., Lobo, B., Stanifer, M. L., Klaus, B., Granzow, M., González-Castro, A. M., Salvo‐Romero, E., Alonso, C., Pigrau, M., et al. (2017) · Gut · doi:10.1136/gutjnl-2016-311477 · Cited by 143
Safwat, A. M., Sabry, D., Ragiae, A., Amer, E., Mahmoud, R., & Shamardan, R. (2018) · Journal of Circulating Biomarkers · doi:10.1177/1849454418807827 · Cited by 141
Unpacking extracellular vesicles: RNA cargo loading and function
Dellar, E. R., Hill, C., Melling, G. E., Carter, D. R. F., & Baena-López, L. A. (2022) · Journal of Extracellular Biology · doi:10.1002/jex2.40 · Cited by 145
Roles of Exosomes Derived From Immune Cells in Cardiovascular Diseases
Wu, R., Gao, W., Kang, Y., & Ge, J. (2019) · Frontiers in Immunology · doi:10.3389/fimmu.2019.00648 · Cited by 134
Emerging technologies in extracellular vesicle-based molecular diagnostics
Jia, S., Zocco, D., Samuels, M. L., Chou, M. F., Chammas, R. J., Skog, J., Zarovni, N., Momen‐Heravi, F., & Kuo, W. P. (2014) · Expert Review of Molecular Diagnostics · doi:10.1586/14737159.2014.893828 · Cited by 127
Sources and Functions of Extracellular Small RNAs in Human Circulation
Fritz, J. V., Heintz-Buschart, A., Ghosal, A., Wampach, L., Etheridge, A., Galas, D., & Wilmes, P. (2016) · Annual Review of Nutrition · doi:10.1146/annurev-nutr-071715-050711 · Cited by 121
Xiao, H. F., Lässer, C., Shelke, G. V., Wang, J., Rådinger, M., Lunavat, T. R., Malmhäll, C., Lin, L., Li, J., Li, L., et al. (2014) · Cell Communication and Signaling · doi:10.1186/preaccept-1817458803126023 · Cited by 128
Self-citationDesigner exosomes as next-generation cancer immunotherapy
Bell, B. M., Kirk, I. D., Hiltbrunner, S., Gabrielsson, S., & Bultema, J. J. (2015) · Nanomedicine Nanotechnology Biology and Medicine · doi:10.1016/j.nano.2015.09.011 · Cited by 123
Secretory microRNAs as biomarkers of cancer
Kai, K., Dittmar, R. L., & Sen, S. (2017) · Seminars in Cell and Developmental Biology · doi:10.1016/j.semcdb.2017.12.011 · Cited by 118
Li, J., Zhang, Y., Dong, P.-Y., Yang, G.-M., & Gurunathan, S. (2023) · Biomedicine & Pharmacotherapy · doi:10.1016/j.biopha.2023.115087 · Cited by 115
Geis-Asteggiante, L., Belew, A. T., Clements, V. K., Edwards, N. J., Ostrand-Rosenberg, S., El-Sayed, N. M., & Fenselau, C. (2018) · Journal of Proteome Research · doi:10.1021/acs.jproteome.7b00646 · Cited by 104
The New Deal: A Potential Role for Secreted Vesicles in Innate Immunity and Tumor Progression
Benito‐Martín, A., Giannatale, A. D., Ceder, S., & Peinado, H. (2015) · Frontiers in Immunology · doi:10.3389/fimmu.2015.00066 · Cited by 101
Association of Extracellular Membrane Vesicles with Cutaneous Wound Healing
Than, U. T. T., Guanzon, D., Leavesley, D. I., & Parker, T. J. (2017) · International Journal of Molecular Sciences · doi:10.3390/ijms18050956 · Cited by 103
Endzeliņš, E., Melne, V., Kalniņa, Z., Lietuvietis, V., Riekstiņa, U., Llorente, A., & Linē, A. (2016) · Molecular Cancer · doi:10.1186/s12943-016-0523-5 · Cited by 104
Role of Extracellular RNA in Atherosclerotic Plaque Formation in Mice
Simsekyilmaz, S., Cabrera-Fuentes, H. A., Meiler, S. U., Sawa Kostin, D., Baumer, Y., Liehn, E. A., Weber, C., Boisvert, W. A., Preissner, K. T., & Zernecke, A. (2013) · Circulation · doi:10.1161/circulationaha.113.002562 · Cited by 98
The pathogenic, therapeutic and diagnostic role of exosomal microRNA in the autoimmune diseases
Mirzaei, R., Zamani, F., Hajibaba, M., Rasouli‐Saravani, A., Noroozbeygi, M., Gorgani, M., Hosseini‐Fard, S. R., Jalalifar, S., Ajdarkosh, H., Abedi, S. H., et al. (2021) · Journal of Neuroimmunology · doi:10.1016/j.jneuroim.2021.577640 · Cited by 95
Exosomal miRNAs in hepatocellular carcinoma development and clinical responses
Li, S., Yao, J., Xie, M., Liu, Y., & Zheng, M. (2018) · Journal of Hematology & Oncology · doi:10.1186/s13045-018-0579-3 · Cited by 97
Biogenesis, delivery, and function of extracellular RNA
Patton, J. G., Franklin, J. L., Weaver, A. M., Vickers, K. C., Zhang, B., Coffey, R. J., Ansel, K. M., Blelloch, R. H., Goga, A., Huang, B., et al. (2015) · Journal of Extracellular Vesicles · doi:10.3402/jev.v4.27494 · Cited by 92
Exosome as a Delivery Vehicle for Cancer Therapy
Moon, B., & Chang, S. (2022) · Cells · doi:10.3390/cells11030316 · Cited by 88
The HIV Nef protein modulates cellular and exosomal miRNA profiles in human monocytic cells
Aqil, M., Naqvi, A. R., Mallik, S., Bandyopadhyay, S., Maulik, U., & Jameel, S. (2014) · Journal of Extracellular Vesicles · doi:10.3402/jev.v3.23129 · Cited by 89
Iftikhar, H., & Carney, G. E. (2016) · BioEssays · doi:10.1002/bies.201500130 · Cited by 87
Mast cell secretome: Soluble and vesicular components
Vukman, K. V., Försönits, A. I., Oszvald, Á., Tóth, E. Á., & Buzás, E. I. (2017) · Seminars in Cell and Developmental Biology · doi:10.1016/j.semcdb.2017.02.002 · Cited by 85
Probert, C., Dottorini, T., Speakman, A., Hunt, S., Nafee, T. M., Fazeli, A., Wood, S. L., Brown, J. E., & James, V. H. (2018) · Oncogene · doi:10.1038/s41388-018-0540-5 · Cited by 83
Role of Extracellular Vesicles in Epithelial Ovarian Cancer: A Systematic Review
Lucidi, A., Buca, D. I. P., Ronsini, C., Tinari, S., Bologna, G., Buca, D., Leombroni, M., Liberati, M., D’Antonio, F., Scambia, G., et al. (2020) · International Journal of Molecular Sciences · doi:10.3390/ijms21228762 · Cited by 82
Emam, S. E., Ando, H., Lila, A. S. A., Shimizu, T., Ukawa, M., Okuhira, K., Ishima, Y., Mahdy, M. A., Ghazy, F.-E. S., & Ishida, T. (2018) · Biological and Pharmaceutical Bulletin · doi:10.1248/bpb.b17-00919 · Cited by 81
Exosome regulation of immune response mechanism: Pros and cons in immunotherapy
Essola, J. M., Zhang, M., Yang, H., Li, F., Xia, B., Mavoungou, J. F., Hussain, A., & Huang, Y. (2023) · Bioactive Materials · doi:10.1016/j.bioactmat.2023.09.018 · Cited by 82
Shen, M., & Ren, X. (2018) · Cancer Letters · doi:10.1016/j.canlet.2018.05.040 · Cited by 78
Emam, S. E., Lila, A. S. A., Elsadek, N. E., Ando, H., Shimizu, T., Okuhira, K., Ishima, Y., Mahdy, M. A., Ghazy, F.-E. S., & Ishida, T. (2019) · European Journal of Pharmaceutics and Biopharmaceutics · doi:10.1016/j.ejpb.2019.10.005 · Cited by 78
Extracellular vesicles as new pharmacological targets to treat atherosclerosis
Yin, M., Loyer, X., & Boulanger, C. M. (2015) · European Journal of Pharmacology · doi:10.1016/j.ejphar.2015.06.047 · Cited by 75
Examining the evidence for extracellular RNA function in mammals
Gruner, H. N., & McManus, M. T. (2021) · Nature Reviews Genetics · doi:10.1038/s41576-021-00346-8 · Cited by 76
Basics and applications of tumor-derived extracellular vesicles
Tai, Y.-L., Chu, P.-Y., Lee, B., Chen, K., Yang, C., Kuo, W., & Shen, T. (2019) · Journal of Biomedical Science · doi:10.1186/s12929-019-0533-x · Cited by 72
Su, J., Chen, S., Dou, Y., Zhao, Z., Jia, X., Ding, X., & Song, S. (2022) · Analytical Chemistry · doi:10.1021/acs.analchem.1c04910 · Cited by 71
Osteoarthritic Subchondral Bone Release Exosomes That Promote Cartilage Degeneration
Wu, X., Crawford, R., Xiao, Y., Mao, X., & Prasadam, I. (2021) · Cells · doi:10.3390/cells10020251 · Cited by 69
Mast cells, basophils and B cell connection network
Merluzzi, S., Betto, E., Ceccaroni, A. A., Magris, R., Giunta, M., & Mion, F. (2014) · Molecular Immunology · doi:10.1016/j.molimm.2014.02.016 · Cited by 73
Lázaro‐Ibáñez, E., Lunavat, T. R., Jang, S. C., Escobedo‐Lucea, C., Cruz, J. O. L., Siljander, P. R. M., Lötvall, J. O., & Yliperttula, M. L. (2017) · BMC Cancer · doi:10.1186/s12885-017-3087-x · Cited by 68
Self-citationPreissner, K. T., Fischer, S., & Deindl, E. (2020) · Frontiers in Cell and Developmental Biology · doi:10.3389/fcell.2020.619221 · Cited by 67
Characterization of mRNA profiles of the exosome-like vesicles in porcine follicular fluid
Matsuno, Y., Kanke, T., Maruyama, N., Fujii, W., Naito, K., & Sugiura, K. (2019) · PLoS ONE · doi:10.1371/journal.pone.0217760 · Cited by 68
Stem cell-derived exosomes as a therapeutic tool for cardiovascular disease
Suzuki, E., Fujita, D., Takahashi, M., Oba, S., & Nishimatsu, H. (2016) · World Journal of Stem Cells · doi:10.4252/wjsc.v8.i9.297 · Cited by 63
Rashed, M. H., Kanlikilicer, P., Rodriguez‐Aguayo, C., Pichler, M., Bayraktar, R., Bayraktar, E., Ivan, C., Filant, J., da Silva, A. M., Aslan, B., et al. (2017) · Oncotarget · doi:10.18632/oncotarget.15525 · Cited by 63
T he roles of extracellular vesicle micro RNA s in the central nervous system
Blandford, S. N., Galloway, D. A., & Moore, C. S. (2018) · Glia · doi:10.1002/glia.23445 · Cited by 62
Azimi, M., Ghabaee, M., Moghadasi, A. N., Noorbakhsh, F., & Izad, M. H. (2018) · Immunologic Research · doi:10.1007/s12026-018-9008-5 · Cited by 60
Exosomes as Natural Nanocarriers for RNA-Based Therapy and Prophylaxis
Gorshkov, A. N., Purvinsh, L. V., Brodskaia, A. V., & Vasin, A. V. (2022) · Nanomaterials · doi:10.3390/nano12030524 · Cited by 60
Soares, V. Y. R., Atai, N. A., Fujita, T., Dilwali, S., Sivaraman, S., Landegger, L. D., Hochberg, F. H., Oliveira, C. A. P. C., Bahmad, F., Breakefield, X. O., et al. (2016) · Neuro-Oncology · doi:10.1093/neuonc/now099 · Cited by 58
Lindner, K., Haier, J., Wang, Z., Watson, D. I., Hussey, D. J., & Hummel, R. (2014) · Clinical Science · doi:10.1042/cs20140089 · Cited by 55
Nazimek, K., Bryniarski, K., & Askenase, P. W. (2016) · International Archives of Allergy and Immunology · doi:10.1159/000449249 · Cited by 56
Pagel, J. I., Tschernatsch, M., Sperandio, M., Preissner, K. T., Fischer, S., Grantzow, T., & Deindl, E. (2012) · Thrombosis and Haemostasis · doi:10.1160/th12-03-0186 · Cited by 54
Fischer, S., Gesierich, S., Griemert, B., Schänzer, A., Acker, T., Augustin, H. G., Olsson, A.-K., & Preissner, K. T. (2013) · Cancer Research · doi:10.1158/0008-5472.can-12-4657 · Cited by 53
Blázquez, R., Sanchez-Margallo, F. M., Álvarez, V., Usón, A., Marinaro, F., & Casado, J. G. (2018) · Acta Biomaterialia · doi:10.1016/j.actbio.2018.02.014 · Cited by 53
Extracellular Vesicles: A Therapeutic Option for Liver Fibrosis
Bruno, S., Chiabotto, G., & Camussi, G. (2020) · International Journal of Molecular Sciences · doi:10.3390/ijms21124255 · Cited by 54
“Small Talk” in the Innate Immune System via RNA-Containing Extracellular Vesicles
van der Grein, S. G., & Hoen, E. N. M. N. (2014) · Frontiers in Immunology · doi:10.3389/fimmu.2014.00542 · Cited by 54
Emerging mechanisms contributing to mast cell-mediated pathophysiology with therapeutic implications
Falduto, G. H., Pfeiffer, A., Luker, A. J., Metcalfe, D. D., & Olivera, A. (2020) · Pharmacology & Therapeutics · doi:10.1016/j.pharmthera.2020.107718 · Cited by 50
microRNAs in the tumor microenvironment: solving the riddle for a better diagnostics
Challagundla, K. B., Fanini, F., Vannini, I., Wise, P. M., Murtadha, M., Malinconico, L., Cimmino, A., & Fabbri, M. (2014) · Expert Review of Molecular Diagnostics · doi:10.1586/14737159.2014.922879 · Cited by 50
Zhang, W., Zhu, Y., Liu, H., Zhang, Y., Liu, H., Adegboro, A. A., Dang, R., Dai, L., Wanggou, S., & Li, X. (2024) · npj Precision Oncology · doi:10.1038/s41698-024-00570-5 · Cited by 49
Development of a magnetic bead-based method for the collection of circulating extracellular vesicles
Shih, C.-L., Chong, K., Hsu, S.-C., Chien, H.-J., Ma, C., Chang, J. W., Yu, C., & Chiou, C.-C. (2015) · New Biotechnology · doi:10.1016/j.nbt.2015.09.003 · Cited by 48
Wu, Y., Deng, W., McGinley, E. C., & Klinke, D. J. (2016) · Pigment Cell & Melanoma Research · doi:10.1111/pcmr.12564 · Cited by 48
Cai, M., Shi, Y., Zheng, T., Hu, S., Du, K., Ren, A., Jia, X., Chen, S., Wang, J., & Lai, S. (2020) · International Immunopharmacology · doi:10.1016/j.intimp.2020.106493 · Cited by 48
Espinosa‐Riquer, Z. P., Segura-Villalobos, D., Ramírez-Moreno, I. G., Pérez‐Rodríguez, M. J., Lamas, M., & González‐Espinosa, C. (2020) · Cells · doi:10.3390/cells9112411 · Cited by 49
Relevance Function of Linc-ROR in the Pathogenesis of Cancer
Chen, W., Yang, J., Fang, H., Li, L., & Sun, J. (2020) · Frontiers in Cell and Developmental Biology · doi:10.3389/fcell.2020.00696 · Cited by 46
The release of tryptase from mast cells promote tumor cell metastasis via exosomes
Xiao, H. F., He, M., Xie, G., Liu, Y., Zhao, Y., Xiong, Y., Li, X., & Zhang, M. (2019) · BMC Cancer · doi:10.1186/s12885-019-6203-2 · Cited by 46
Exosome- and extracellular vesicle-based approaches for the treatment of lysosomal storage disorders
Lü, B., Ku, J., Flojo, R. A. B., Olson, C., Bengford, D., & Marriott, G. (2022) · Advanced Drug Delivery Reviews · doi:10.1016/j.addr.2022.114465 · Cited by 47
Emam, S. E., Ando, H., Lila, A. S. A., Shimizu, T., Okuhira, K., Ishima, Y., Mahdy, M. A., Ghazy, F.-E. S., Sagawa, I., & Ishida, T. (2018) · Scientific Reports · doi:10.1038/s41598-018-32861-w · Cited by 44
RetractedImpact of extracellular RNA on endothelial barrier function
Fischer, S., Cabrera-Fuentes, H. A., Noll, T., & Preissner, K. T. (2014) · Cell and Tissue Research · doi:10.1007/s00441-014-1850-8 · Cited by 43
Extracellular vesicles of stromal origin target and support hematopoietic stem and progenitor cells
Stik, G., Créquit, S., Petit, L., Durant, J., Charbord, P., Jaffredo, T., & Durand, C. (2017) · The Journal of Cell Biology · doi:10.1083/jcb.201601109 · Cited by 43
Laurenzana, I., Lamorte, D., Trino, S., Luca, L. D., Ambrosino, C., Zoppoli, P., Ruggieri, V., Vecchio, L. D., Musto, P., Caivano, A., et al. (2018) · Stem Cells International · doi:10.1155/2018/9863194 · Cited by 44
Chiabotto, G., Ceccotti, E., Tapparo, M., Camussi, G., & Bruno, S. (2021) · Frontiers in Cell and Developmental Biology · doi:10.3389/fcell.2021.777462 · Cited by 44
Hu, L., Si, L., Dai, X., Dong, H., Ma, Z., Sun, Z., Li, N., Sha, H., Chen, Y., Qian, Y., et al. (2021) · Journal of Neuroinflammation · doi:10.1186/s12974-021-02110-5 · Cited by 41
FcεRI Signaling in the Modulation of Allergic Response: Role of Mast Cell-Derived Exosomes
Lecce, M., Molfetta, R., Milito, N. D., Santoni, A., & Paolini, R. (2020) · International Journal of Molecular Sciences · doi:10.3390/ijms21155464 · Cited by 40
Shefler, I., Salamon, P., & Mekori, Y. A. (2021) · International Journal of Molecular Sciences · doi:10.3390/ijms22179176 · Cited by 38
Extracellular Vesicles as Carriers of Non-coding RNAs in Liver Diseases
Yang, J., Li, C., Zhang, L., & Wang, X. (2018) · Frontiers in Pharmacology · doi:10.3389/fphar.2018.00415 · Cited by 38
Extracellular nucleic acids as novel alarm signals in the vascular system
Fischer, S., & Preissner, K. T. (2013) · Hämostaseologie · doi:10.5482/hamo-13-01-0001 · Cited by 37
Budgude, P., Kale, V. P., & Vaidya, A. (2020) · Cell Biology International · doi:10.1002/cbin.11313 · Cited by 36
Metadata
- Authors
- Ekström, K., Valadi, H., Sjöstrand, M., Malmhäll, C., Bossios, A., Eldh, M., & Lötvall, J.
- Affiliations
- University of Gothenburg (SE)
- Corresponding author
- Lötvall, Jan
- Venue
- Journal of Extracellular Vesicles
- Publisher
- Wiley
- Published
- 2012-01
- Volume
- 1
- Issue
- 1
- ISSN
- 2001-3078 (ISSN-L)
- PMC
- PMC3760639
- OpenAlex
- W2132589340
- Cited by
- 201
- References
- 36
- Citations by year
- 2026: 3 · 2025: 7 · 2024: 10 · 2023: 17 · 2022: 15 · 2021: 15 · 2020: 23 · 2019: 15 · 2018: 19 · 2017: 14 · 2016: 17 · 2015: 20 · 2014: 14 · 2013: 8 · 2012: 4
- FWCI
- 5.91
- Type
- journal article
- Language
- en
- Open access
- gold
- doi.org
- Licence
- Locations
- Journal of Extracellular Vesicles (publishedVersion, cc-by-nc)
- Europe PMC (PubMed Central) (publishedVersion, cc-by)
- PubMed Central (publishedVersion, cc-by)
- PubMed (publishedVersion)
- Funders
- Vetenskapsrådet (K2008‐57X‐20676‐01‐3)
- Topics
- Life Sciences › Biochemistry, Genetics and Molecular Biology › Molecular Biology › Extracellular vesicles in disease
- Life Sciences › Biochemistry, Genetics and Molecular Biology › Cell Biology › Cellular transport and secretion
- Life Sciences › Immunology and Microbiology › Immunology › Mast cells and histamine
- Keywords
- exosomes, mast cells, microRNA, mRNA, cell-to-cell communication, CD34+ hematopoietic progenitor cells, HMC-1 cell line, extracellular vesicles, exosome uptake
About these checks
Registry, retraction, Cites and statistics results are computed, not judged, with one exception: a printed reference that no index lists is read once by a model before it counts as a citation error. Claims are extracted by a model and kept only when their quote appears verbatim in the text; each cited source is then checked, with a model’s help, for whether it says what the claim relies on. Those verdicts can be wrong — read the claim’s quote and the cited source before relying on one.
Statistics and arithmetic are recomputed, not judged.
Confidence bands are shown only for fields calibrated on our annotated test set. None is calibrated yet, so no band is shown.
What counts as a claim ›How we measure confidence ›How we check this ›
Are you an author, or do you see a problem with this page? Request a review
