

The DOI matches its Crossref record; 53 of the 53 references it cites were found in a registry or an index.
CREB stimulates GPX4 transcription to inhibit ferroptosis in lung adenocarcinoma
Open accessAbstract
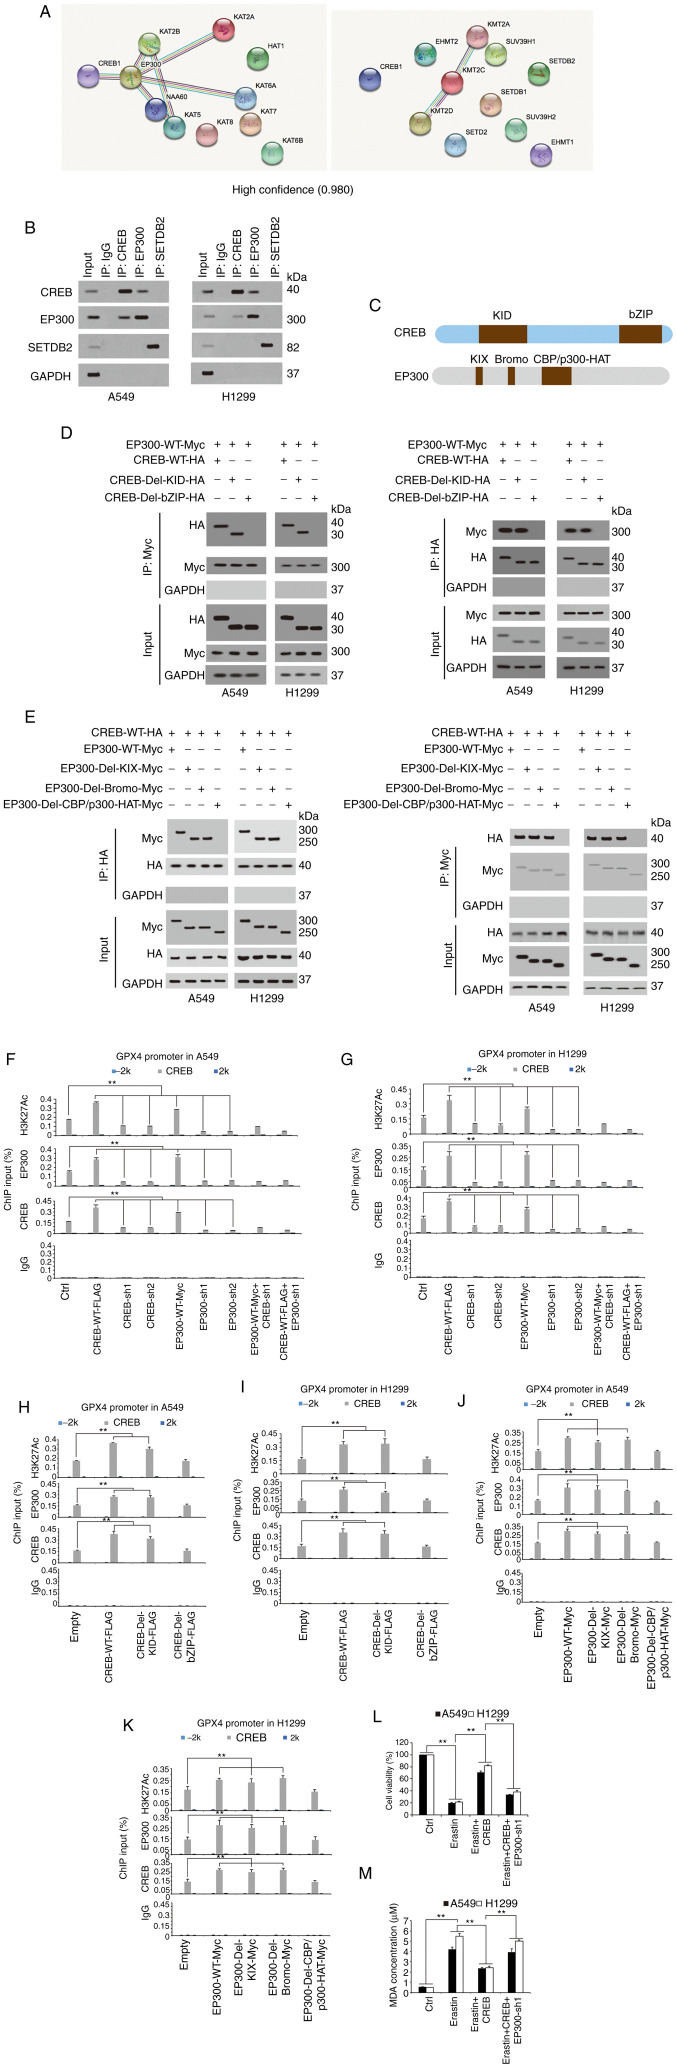
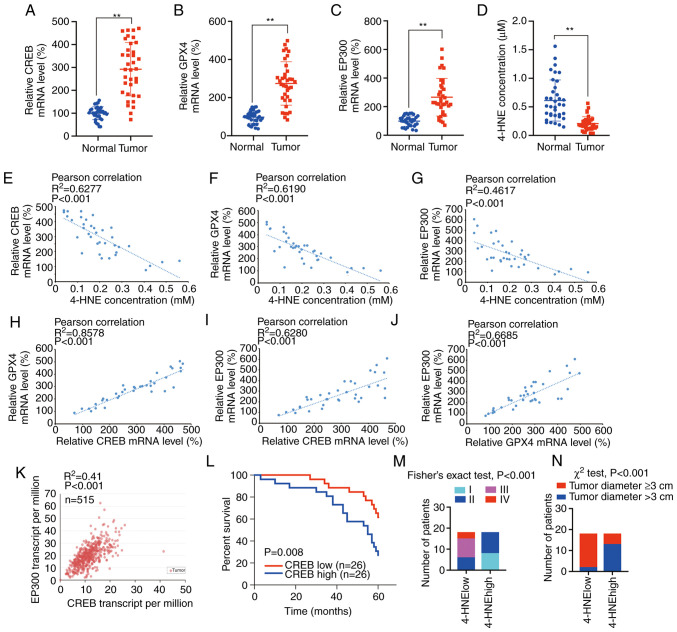
Ferroptosis is a new form of regulated cell death and closely related to cancer. However, the mechanism underlying the regulation of ferroptosis in lung adenocarcinoma (LUAD) remains unclear. IB, IHC and ELISA were performed to analyze protein expression. RT‑qPCR was used to analyze mRNA expression. Cell viability, 3D cell growth, MDA, the generation of lipid ROS and the Fe2+ concentration were measured to evaluate the responses to the induction of ferroptosis. Measurement of luciferase activity and ChIP were used to analyze the promoter activity regulated by the transcriptional regulator. Co‑IP assays were performed to identify protein‑protein interactions. In the present study, it was revealed that cAMP response element‑binding protein (CREB) was highly expressed in LUAD, and knockdown of CREB inhibited cell viability and growth by promoting apoptosis‑ and ferroptosis‑like cell death, concurrently. It was observed that CREB suppressed lipid peroxidation by binding the promoter region of glutathione peroxidase 4 (GPX4), and this binding could be enhanced by E1A binding protein P300 (EP300). The bZIP domain in CREB and the CBP/p300‑HAT domain in EP300 were essential for CREB‑EP300 binding in LUAD cells. Finally, it was revealed that CREB, GPX4, EP300 and 4‑HNE were closely related to tumor size and stage, and tumors with a higher degree of malignancy were more likely to have a low degree of lipid peroxidation. Therefore, targeting this CREB/EP300/GPX4 axis may provide new strategies for treating LUAD.
Overview
The claims and statistics of this paper haven’t been checked yet.
Run the check — free, no account needed. It reads the open-access text and checks the sources it cites.
Integrity signals
Registry
Cites
Statistics
Figures
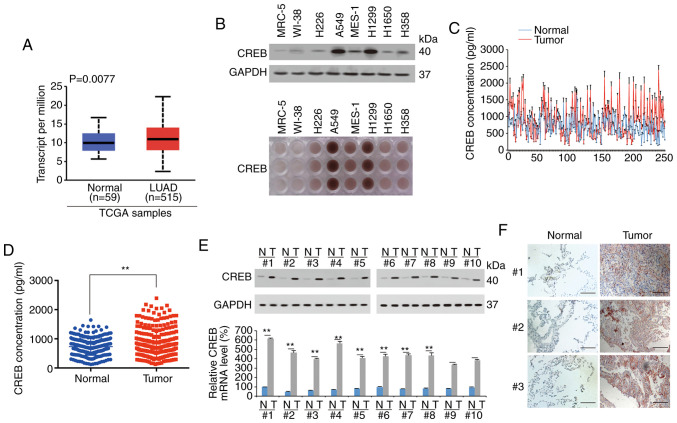
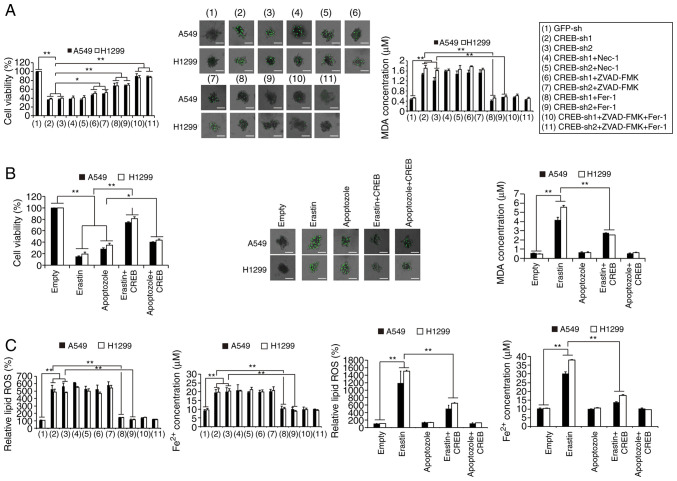
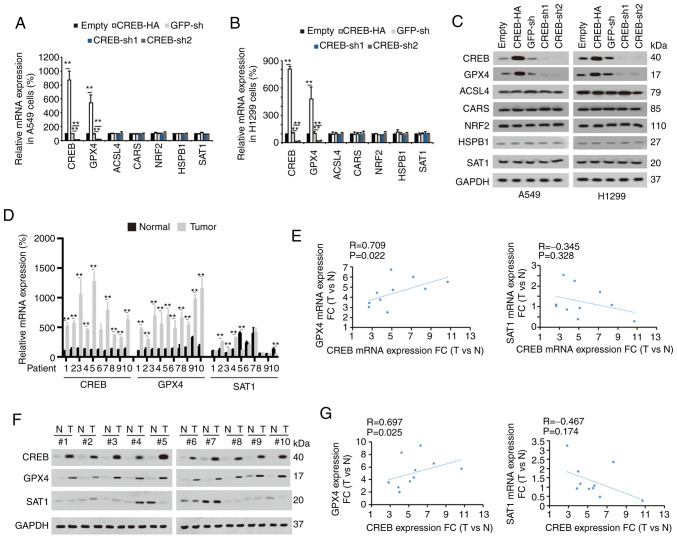
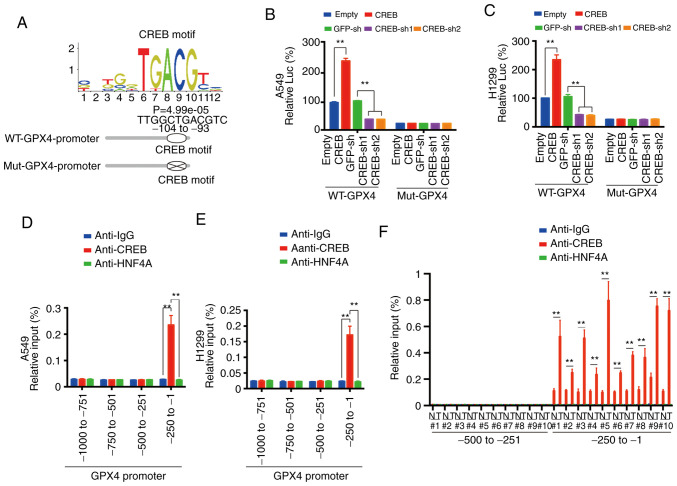
Verification
Claims the paper makes
The claims and statistics of this paper haven’t been checked yet.
Run the check — free, no account needed. It reads the open-access text and checks the sources it cites.
Claims other papers make about this one
Each is checked against this paper’s own text: does it say what the citing paper says it does?
The cited source says what the claim attributes to it.
In the citing paper
“Several transcription factors including AP-1 (60, 61), CREB (62, 63), ATF4 (64), and NRF2 (45, 65, 66) have been shown to regulate either directly or indirectly GPX4 levels in different cellular contexts.”
From Secreted Apoe rewires melanoma cell state vulnerability to ferroptosis (2024) · cites this paper as [62]
Self-check
Percentages, sums and reported differences re-computed from the paper’s own numbers.
The self-check needs the paper’s full text.
Citations
Cites
Analysis of Relative Gene Expression Data Using Real-Time Quantitative PCR and the 2−ΔΔCT Method
Livak, K. J., & Schmittgen, T. D. (2001) · Methods · doi:10.1006/meth.2001.1262 · Cited by 180,860
Ferroptosis: An Iron-Dependent Form of Nonapoptotic Cell Death
Dixon, S. J., Lemberg, K. M., Lamprecht, M. R., Skouta, R., Zaitsev, E. M., Gleason, C. E., Patel, D. N., Bauer, A. J., Cantley, A. M., Yang, W. S., et al. (2012) · Cell · doi:10.1016/j.cell.2012.03.042 · Cited by 18,691
Szklarczyk, D., Gable, A. L., Lyon, D., Junge, A., Wyder, S., Huerta-Cepas, J., Simonovic, M., Doncheva, N. T., Morris, J. H., Bork, P., et al. (2019) · Nucleic Acids Research · doi:10.1093/nar/gky1131 · Cited by 17,749
Regulation of Ferroptotic Cancer Cell Death by GPX4
Yang, W. S., SriRamaratnam, R., Welsch, M. E., Shimada, K., Skouta, R., Viswanathan, V. S., Cheah, J. H., Clemons, P. A., Shamji, A. F., Clish, C. B., et al. (2014) · Cell · doi:10.1016/j.cell.2013.12.010 · Cited by 7,713
UniProt: a worldwide hub of protein knowledge
The UniProt Consortium (2019) · Nucleic Acids Research · doi:10.1093/nar/gky1049 · Cited by 7,698
Ferroptosis: A Regulated Cell Death Nexus Linking Metabolism, Redox Biology, and Disease
Stockwell, B. R., Friedmann Angeli, J. P., Bayir, H., Bush, A. I., Conrad, M., Dixon, S. J., Fulda, S., Gascón, S., Hatzios, S. K., Kagan, V. E., et al. (2017) · Cell · doi:10.1016/j.cell.2017.09.021 · Cited by 7,695
UALCAN: A Portal for Facilitating Tumor Subgroup Gene Expression and Survival Analyses
Chandrashekar, D. S., Bashel, B., Balasubramanya, S. A. H., Creighton, C. J., Ponce-Rodriguez, I., Chakravarthi, B. V. S. K., & Varambally, S. (2017) · Neoplasia · doi:10.1016/j.neo.2017.05.002 · Cited by 6,086
ACSL4 dictates ferroptosis sensitivity by shaping cellular lipid composition
Doll, S., Proneth, B., Tyurina, Y. Y., Panzilius, E., Kobayashi, S., Ingold, I., Irmler, M., Beckers, J., Aichler, M., Walch, A., et al. (2017) · Nature Chemical Biology · doi:10.1038/nchembio.2239 · Cited by 4,293
Inactivation of the ferroptosis regulator Gpx4 triggers acute renal failure in mice
Friedmann Angeli, J. P., Schneider, M., Proneth, B., Tyurina, Y. Y., Tyurin, V. A., Hammond, V. J., Herbach, N., Aichler, M., Walch, A., Eggenhofer, E., et al. (2014) · Nature Cell Biology · doi:10.1038/ncb3064 · Cited by 3,732
The CoQ oxidoreductase FSP1 acts parallel to GPX4 to inhibit ferroptosis
Bersuker, K., Hendricks, J. M., Li, Z., Magtanong, L., Ford, B., Tang, P. H., Roberts, M. A., Tong, B., Maimone, T. J., Zoncu, R., et al. (2019) · Nature · doi:10.1038/s41586-019-1705-2 · Cited by 3,703
Cited by
Sorted by citations
GPX4: The hub of lipid oxidation, ferroptosis, disease and treatment
Liu, Y., Wan, Y., Jiang, Y., Zhang, L., & Cheng, W. (2023) · Biochimica et Biophysica Acta (BBA) - Reviews on Cancer · doi:10.1016/j.bbcan.2023.188890 · Cited by 546
Li, F., Long, H., Zhou, Z.-W., Luo, H., Xu, S., & Gao, L. (2022) · Frontiers in Pharmacology · doi:10.3389/fphar.2022.910292 · Cited by 476
GPX4, ferroptosis, and diseases
Zhang, W., Liu, Y., Yan, L., Zhu, C., & Zou, Z. (2024) · Biomedicine & Pharmacotherapy · doi:10.1016/j.biopha.2024.116512 · Cited by 474
Ferroptosis: when metabolism meets cell death
Zheng, J., & Conrad, M. (2024) · Physiological Reviews · doi:10.1152/physrev.00031.2024 · Cited by 286
Wang, Y., Hu, J., Wu, S., Fleishman, J. S., Li, Y., Xu, Y.-S., Zou, W., Wang, J., Feng, Y., Chen, J., et al. (2023) · Signal Transduction and Targeted Therapy · doi:10.1038/s41392-023-01720-0 · Cited by 225
Self-citationXia, P., Zhang, H., Lu, H., Xu, K., Jiang, X. W., Jiang, Y., Gongye, X., Chen, Z., Liu, J., Chen, X., et al. (2023) · 癌症:英文版 · doi:10.1002/cac2.12403 · Cited by 200
Chen, J., Ou, Z., Gao, T., Yang, Y., Shu, A., Xu, H., Chen, Y., & Lv, Z. (2022) · Biomedicine & Pharmacotherapy · doi:10.1016/j.biopha.2022.113953 · Cited by 184
Self-citationTargeting GPX4 in human cancer: Implications of ferroptosis induction for tackling cancer resilience
Lee, J., & Roh, J. (2023) · Cancer Letters · doi:10.1016/j.canlet.2023.216119 · Cited by 152
cAMP-PKA/EPAC signaling and cancer: the interplay in tumor microenvironment
Zhang, H., Liu, Y., Liu, J., Chen, J., Wang, J., Hua, H. M., & Jiang, Y. (2024) · Journal of Hematology & Oncology · doi:10.1186/s13045-024-01524-x · Cited by 155
Self-citationThe role of ferroptosis in lung cancer
Wu, S., Zhu, C., Tang, D., Dou, Q. P., Shen, J., & Chen, X. (2021) · Biomarker Research · doi:10.1186/s40364-021-00338-0 · Cited by 137
Cui, J., Wang, Y., Tian, X., Miao, Y., Ma, L., Zhang, C., Xu, X., Wang, J., Fang, W., & Zhang, X. (2023) · Antioxidants and Redox Signaling · doi:10.1089/ars.2023.0237 · Cited by 140
Self-citationRegulation of Ferroptosis in Lung Adenocarcinoma
Wei, X., Li, X., Hu, S., Cheng, J., & Cai, R. (2023) · International Journal of Molecular Sciences · doi:10.3390/ijms241914614 · Cited by 126
Histone lactylation-driven B7-H3 expression promotes tumor immune evasion
Ma, Z., Yang, J., Jia, W., Li, L., Li, Y., Hu, J., Luo, W., Li, R., Ye, D., & Lan, P. (2025) · Theranostics · doi:10.7150/thno.105947 · Cited by 113
Talukdar, P. D., & Chatterji, U. (2023) · Signal Transduction and Targeted Therapy · doi:10.1038/s41392-023-01651-w · Cited by 103
Xing, N., Du, Q., Guo, S., Xiang, G., Zhang, Y., Meng, X., Li, X., & Wang, S. (2023) · Cell Death Discovery · doi:10.1038/s41420-023-01407-z · Cited by 91
A white paper on Phospholipid Hydroperoxide Glutathione Peroxidase (GPx4) forty years later
Ursini, F., Bosello-Travain, V., Cozza, G., Miotto, G., Roveri, A., Toppo, S., & Maiorino, M. (2022) · Free Radical Biology and Medicine · doi:10.1016/j.freeradbiomed.2022.06.227 · Cited by 85
Exposure to low-dose cadmium induces testicular ferroptosis
Xiong, L., Zhou, B., Young, J. L., Wintergerst, K. A., & Cai, L. (2022) · Ecotoxicology and Environmental Safety · doi:10.1016/j.ecoenv.2022.113373 · Cited by 73
Old wine in new bottles: Kaempferol is a promising agent for treating the trilogy of liver diseases
Xiao, X., Hu, Q., Deng, X., Shi, K., Zhang, W., Jiang, Y., Ma, X., Zeng, J., & Wang, X. (2021) · Pharmacological Research · doi:10.1016/j.phrs.2021.106005 · Cited by 63
Understanding the mechanistic regulation of ferroptosis in cancer: the gene matters
Gao, M., Fan, K., Chen, Y., Zhang, G., Chen, J., & Zhang, Y. (2022) · Journal of genetics and genomics/Journal of Genetics and Genomics · doi:10.1016/j.jgg.2022.06.002 · Cited by 57
Lv, Y., Chen, D., Tian, X., Xiao, J., Xu, C., Du, L., Li, J., Zhou, S., Chen, Y., Zhuang, R., et al. (2023) · Journal of Translational Medicine · doi:10.1186/s12967-023-04111-9 · Cited by 52
Self-citationWei, S., Yu, Z., Shi, R., An, L., Zhang, Q., Zhang, Q., Zhang, T., Zhang, J., & Wang, H. (2022) · BMC Cancer · doi:10.1186/s12885-022-09986-3 · Cited by 48
Liu, L., Lu, L., Zhao, Q., Kou, Q.-J., Jiang, Z.-Z., Gui, R., Luo, Y., & Zhao, Q. (2021) · Frontiers in Cell and Developmental Biology · doi:10.3389/fcell.2021.756340 · Cited by 46
COPZ1 regulates ferroptosis through NCOA4-mediated ferritinophagy in lung adenocarcinoma
Wu, A., Yang, H., Xiao, T., Gu, W., Li, H., & Chen, P. (2024) · Biochimica et Biophysica Acta (BBA) - General Subjects · doi:10.1016/j.bbagen.2024.130706 · Cited by 46
PM2 .5 exposure‐induced ferroptosis in neuronal cells via inhibiting ERK / CREB pathway
Xiong, Q., Tian, X., Xu, C., Ma, B., Liu, W. D., Sun, B., Ru, Q., & Shu, X. (2022) · Environmental Toxicology · doi:10.1002/tox.23586 · Cited by 40
Self-citationSelf-engineered lipid peroxidation nano-amplifier for ferroptosis-driven antitumor therapy
Sun, X., Yang, X., Wang, J., Shang, Y., Wang, P., Sheng, X., Liu, X., Sun, J., He, Z., Zhang, S., et al. (2022) · Chemical Engineering Journal · doi:10.1016/j.cej.2022.138991 · Cited by 38
Self-citationMa, X., Xu, J., Gao, N., Tian, J., & Song, T. (2023) · Molecular and Cellular Probes · doi:10.1016/j.mcp.2023.101899 · Cited by 37
He, L., Yang, Y., Chen, J., Zou, P., & Li, J. (2021) · Molecular Medicine Reports · doi:10.3892/mmr.2021.12307 · Cited by 36
Self-citationInhibition of ferroptosis reverses heart failure with preserved ejection fraction in mice
Xiong, Y., Liu, X., Jiang, L., Hao, T., Wang, Y., & Li, T. (2024) · Journal of Translational Medicine · doi:10.1186/s12967-023-04734-y · Cited by 35
Ferroptosis in Lung Cancer: From Molecular Mechanisms to Prognostic and Therapeutic Opportunities
Tabnak, P., HajiEsmailPoor, Z., & Soraneh, S. (2021) · Frontiers in Oncology · doi:10.3389/fonc.2021.792827 · Cited by 35
Targeting ALDH1A1 to enhance the efficacy of KRAS-targeted therapy through ferroptosis
Bian, Y., Shan, G., Bi, G., Liang, J., Hu, Z., Sui, Q., Shi, H., Zheng, Z., Yao, G., Wang, Q., et al. (2024) · Redox Biology · doi:10.1016/j.redox.2024.103361 · Cited by 34
Wang, L., Huang, H., Li, X., Ouyang, L., Wei, X., Xie, J., Liu, D., Tan, P., & Hu, Z. (2023) · Chinese Medicine · doi:10.1186/s13020-023-00838-1 · Cited by 34
Miao, H., Ren, Q., Li, H., Zeng, M., Chen, D. S., Xu, C., Chen, Y., & Wen, Z. (2022) · BMC Cancer · doi:10.1186/s12885-022-09314-9 · Cited by 33
Ferroptosis and Its Potential Role in Lung Cancer: Updated Evidence from Pathogenesis to Therapy
Chen, K., Zhang, S., Jiao, J., & Zhao, S. (2021) · Journal of Inflammation Research · doi:10.2147/jir.s347955 · Cited by 29
Nie, J., Zhang, P., Liang, C., Yu, Y., & Wang, X. (2023) · Free Radical Biology and Medicine · doi:10.1016/j.freeradbiomed.2023.06.006 · Cited by 28
Self-citationNiu, R., Lan, J., Liang, D., Xiang, L., Wu, J., Zhang, X., Li, Z., Chen, H., Geng, L., Xu, W., et al. (2024) · Cell Communication and Signaling · doi:10.1186/s12964-024-01836-y · Cited by 30
Self-citationSui, X., Hu, N., Zhang, Z., Wang, Y., Wang, P., & Xiu, G. (2021) · Pathology International · doi:10.1111/pin.13158 · Cited by 27
Pan, W., Xiang, L., Liang, X., Du, W., Zhao, J., Zhang, S., Zhou, X., Geng, L., Gong, S., & Xu, W. (2023) · Mediators of Inflammation · doi:10.1155/2023/6623329 · Cited by 27
Knockdown of SETD2 promotes erastin-induced ferroptosis in ccRCC
Xue, W., Jian, W., Meng, Y., Wang, T., Cai, L., Yu, Y., Yu, Y., Xia, Z., & Zhang, C. (2023) · Cell Death and Disease · doi:10.1038/s41419-023-06057-8 · Cited by 31
Self-citationSecreted Apoe rewires melanoma cell state vulnerability to ferroptosis
More, S., Bonnereau, J., Wouters, D., Spotbeen, X., Karras, P., Rizzollo, F., Killian, T., Venken, T., Naulaerts, S., Vervoort, E., et al. (2024) · Science Advances · doi:10.1126/sciadv.adp6164 · Cited by 25
Decoding GPX4 regulation in ferroptosis: mechanisms and therapeutic implications
Chen, X. (2026) · Trends in Molecular Medicine · doi:10.1016/j.molmed.2026.01.008 · Cited by 25
Pea (Pisum sativum) peel extract attenuates DOX-induced oxidative myocardial injury
Abdelghffar, E. A. R., Obaid, W. A., Elgamal, A. M., Daoud, R., Sobeh, M., & Raey, M. A. E. (2021) · Biomedicine & Pharmacotherapy · doi:10.1016/j.biopha.2021.112120 · Cited by 25
Ye, H., Ding, X., Lv, X., Du, Y., Guo, R., Qiu, J., Li, R., & Cao, L. (2024) · Journal of Translational Medicine · doi:10.1186/s12967-024-05714-6 · Cited by 25
MMP9 drives ferroptosis by regulating GPX4 and iron signaling
Gawargi, F. I., & Mishra, P. K. (2024) · iScience · doi:10.1016/j.isci.2024.110622 · Cited by 23
Ferroptosis-based drug delivery system as a new therapeutic opportunity for brain tumors
Yao, Y., Ji, P., Chen, H., Ge, J., Xu, Y., Wang, P., Li, X., & Yan, Z. (2023) · Frontiers in Oncology · doi:10.3389/fonc.2023.1084289 · Cited by 21
PTGER3 knockdown inhibits the vulnerability of triple‐negative breast cancer to ferroptosis
Wang, S., Zhang, Y., Zhang, D., Meng, J., Che, N., Zhao, X., & Liu, T. (2024) · Cancer Science · doi:10.1111/cas.16169 · Cited by 20
Varlamova, E. G. (2025) · Journal of Trace Elements in Medicine and Biology · doi:10.1016/j.jtemb.2025.127620 · Cited by 20
Fei, X., Hu, C., Wang, X., Lu, C., Chen, H., Sun, B., & Li, C. (2021) · Frontiers in Cell and Developmental Biology · doi:10.3389/fcell.2021.751490 · Cited by 18
Wang, X., Liu, X., & Wang, H. (2022) · Cancer Gene Therapy · doi:10.1038/s41417-022-00497-8 · Cited by 18
Ferroptosis and its emerging role in esophageal cancer
Maimaitizunong, R., Wang, K., & Li, H. (2022) · Frontiers in Molecular Biosciences · doi:10.3389/fmolb.2022.1027912 · Cited by 18
Zhang, T., Luu, M. D. A., Dolga, A. M., Eisel, U. L. M., & Schmidt, M. (2023) · Frontiers in Physiology · doi:10.3389/fphys.2023.1207280 · Cited by 16
Natural products and ferroptosis: A novel approach for heart failure management
Zhang, Z., Yang, Z., Wang, S., Wang, X., & Mao, J. (2025) · Phytomedicine · doi:10.1016/j.phymed.2025.156783 · Cited by 17
Function and regulation of GPX4 in the development and progression of fibrotic disease
Li, Z., Zhu, Z., Liu, Y., Liu, Y., & Zhao, H. W. (2022) · Journal of Cellular Physiology · doi:10.1002/jcp.30780 · Cited by 16
Unravelling the signaling power of pollutants
Manzano-Covarrubias, A. L., Yan, H., Luu, M. D. A., Gadjdjoe, P. S., Dolga, A. M., & Schmidt, M. (2023) · Trends in Pharmacological Sciences · doi:10.1016/j.tips.2023.09.002 · Cited by 18
Singh, T., Beatty, A., & Peterson, J. R. (2022) · Cell Death Discovery · doi:10.1038/s41420-022-01044-y · Cited by 16
FOXO: a key target in regulating aging and age-related diseases
Wang, W., Zhu, H., Jiang, Q., Shi, Y., & Wang, X. (2026) · Biogerontology · doi:10.1007/s10522-025-10380-2 · Cited by 18
Asakawa, A., Kawade, G., Kurata, M., Fukuda, S., Onishi, I., Kinowaki, Y., Ishibashi, S., Ikeda, M., Watabe, S., Kobayashi, M., et al. (2022) · Lung Cancer · doi:10.1016/j.lungcan.2022.01.012 · Cited by 15
Yu, T., Yu, Y., Ma, Y., & Chen, G. (2023) · Allergologia et Immunopathologia · doi:10.15586/aei.v51i4.873 · Cited by 15
Self-citationEmerging mechanisms of ferroptosis and its implications in lung cancer
Li, Q., Song, Q., Pei, H., & Chen, Y. (2024) · Chinese Medical Journal · doi:10.1097/cm9.0000000000003048 · Cited by 16
Regulators of epigenetic change in ferroptosis‑associated cancer (Review)
Wu, J., Zhu, S., Wang, P., Wang, J., Huang, J., Wang, T., Guo, L., Liang, D., Meng, Q., & Pan, H. (2022) · Oncology Reports · doi:10.3892/or.2022.8430 · Cited by 16
Self-citationShi, Z., Zhang, H., Shen, Y., Zhang, S., Zhang, X., Xu, Y., & Sun, D. (2023) · Thoracic Cancer · doi:10.1111/1759-7714.15037 · Cited by 14
Self-citationGuo, M., Liu, M., Li, W., Wang, C., Zhang, L., & Zhang, H. (2024) · Journal of Cancer Research and Clinical Oncology · doi:10.1007/s00432-024-05658-w · Cited by 20
Downregulation of 4-HNE and FOXO4 collaboratively promotes NSCLC cell migration and tumor growth
Zhong, T., Li, Y., Jin, M., Liu, J., Wu, Z.-Y., Zhu, F., Zhao, L., Fan, Y., Xu, L., & Ji, J. (2024) · Cell Death and Disease · doi:10.1038/s41419-024-06948-4 · Cited by 14
Lu, Y., Zhu, F., Zhou, X., Li, Y., Rong, G., Liu, N., Hong, J., & Cheng, Y. (2024) · Nano Letters · doi:10.1021/acs.nanolett.4c05012 · Cited by 13
Liu, W., Yu, W., Zhou, L., Ling, D., Xu, Y., & He, F. (2024) · BMC Oral Health · doi:10.1186/s12903-024-04107-x · Cited by 12
Tetrandrine citrate suppresses lung adenocarcinoma growth via SLC7A11/GPX4-mediated ferroptosis
Mo, X., Hu, D., Yuan, K., Luo, J., Huang, C., & Xu, M. Q. (2023) · Discover Oncology · doi:10.1007/s12672-023-00691-6 · Cited by 12
Ramkumar, K. M., Susindran, O. T., Ganesh, G. V., Harithpriya, K., & Paulmurugan, R. (2024) · Analytical Chemistry · doi:10.1021/acs.analchem.4c03065 · Cited by 12
ZIP8 modulates ferroptosis to drive esophageal carcinoma progression
Yang, Z., Zhao, K., Li, X., Yanzhang, R., Zhang, H., Yin, Y., Yan, M., Fang, S., Li, T., Li, H., et al. (2025) · Cell Death and Disease · doi:10.1038/s41419-025-07692-z · Cited by 11
Hu, Z., & Zhou, G. (2022) · Computational and Mathematical Methods in Medicine · doi:10.1155/2022/9588740 · Cited by 10
Stachura, P., Liu, W., Xu, H. C., Wlodarczyk, A., Stencel, O., Pandey, P., Vogt, M., Bhatia, S., Picard, D. J., Remke, M., et al. (2023) · Molecular Cancer · doi:10.1186/s12943-023-01833-8 · Cited by 9
Zhang, J.-T., Wang, D., Chen, X.-X., Ji, L.-Y., Yu, M.-O., Guo, M.-H., Zhang, D.-J., Chen, W.-D., & Xu, F. (2022) · Frontiers in Genetics · doi:10.3389/fgene.2022.825685 · Cited by 7
Silencing of CircTRIM25/miR-138-5p/CREB1 axis promotes chondrogenesis in osteoarthritis
He, C., Zeng, Z., Yang, Y., Ye, S., Wu, Q., Liu, X., Liu, C., Zeng, W., & Liu, S. (2024) · Autoimmunity · doi:10.1080/08916934.2024.2361749 · Cited by 9
Self-citationZhan, S., Qiu, M., Wei, X., Wei, J., Qin, L., Jiang, B., Wen, Q., Chen, P., Lin, Q., Wei, X., et al. (2023) · Cancer Medicine · doi:10.1002/cam4.6848 · Cited by 9
Geng, H., Ma, L., Wu, L., Yao, C., Wang, C., Gan, X., Li, Y., & Chen, F. (2025) · Frontiers in Oncology · doi:10.3389/fonc.2025.1594234 · Cited by 9
Self-citationLiu, Z., Jing, C., & Zhang, W. (2024) · Cellular and Molecular Biology · doi:10.14715/cmb/2024.70.2.5 · Cited by 8
Liu, Y., Liu, J., Hu, N., Li, Z., Liu, A., Luo, R., Du, S., Guo, D., Li, J., & Duan, J. (2024) · Journal of Ethnopharmacology · doi:10.1016/j.jep.2024.119300 · Cited by 8
Geng, H., Xue, Y., Yan, B., Lu, Z., Yang, H., Li, P., & Zhou, J. (2024) · Biological Procedures Online · doi:10.1186/s12575-024-00259-w · Cited by 8
Cao, L., Wang, Y., Liu, J., Bai, X., & Chi, X. (2024) · American Journal of Reproductive Immunology · doi:10.1111/aji.13864 · Cited by 7
CircSCUBE3 promoted ferroptosis to inhibit lung adenocarcinoma progression
Fu, H., & Zhao, Q. (2024) · Cellular and Molecular Biology · doi:10.14715/cmb/2024.70.2.23 · Cited by 7
Rabeprazole suppressed gastric intestinal metaplasia through activation of GPX4-mediated ferroptosis
Xie, J., Liang, X., Xie, F., Huang, C., Lin, Z., Xie, S., Yang, F., Zheng, F., Geng, L., Xu, W., et al. (2024) · Frontiers in Pharmacology · doi:10.3389/fphar.2024.1409001 · Cited by 6
Inhibition of miR-9-3p facilitates ferroptosis by activating SAT1/p53 pathway in lung adenocarcinoma
Wu, A., Zhang, A., Wang, T., Chen, J., & Shi, J. (2024) · Translational Lung Cancer Research · doi:10.21037/tlcr-24-762 · Cited by 6
Emerging strategies for enhanced glutathione biosynthesis and its biomedical applications
Wang, Y., Ma, R., Zhou, J., Tan, Z., Hong-liang, L., Shi, H. S., & Zhang, Y. (2025) · Journal of Biotechnology · doi:10.1016/j.jbiotec.2025.11.016 · Cited by 5
Prognostic markers of ferroptosis-related long non-coding RNA in lung adenocarcinomas
Mao, K., Tang, R. N., Wu, Y., Zhang, Z., Gao, Y., & Huang, H. (2023) · Frontiers in Genetics · doi:10.3389/fgene.2023.1118273 · Cited by 5
Zhou, W., Bai, C., Long, C., Hu, L., & Zheng, Y. (2021) · Frontiers in Oncology · doi:10.3389/fonc.2021.720400 · Cited by 5
GATA1 activates HSD17B6 to improve efficiency of cisplatin in lung adenocarcinoma via DNA damage
Shao, X., Hou, H. W., Chen, H., Xia, W., Geng, X., & Wang, J. (2024) · Genes and Environment · doi:10.1186/s41021-024-00321-9 · Cited by 5
Self-citationJin, J., Wang, K., Lu, C., Yao, C., & Xie, F. (2026) · Cell Cycle · doi:10.1080/15384101.2026.2627885 · Cited by 4
Zhang, L., Gao, S., Xiong, X., Liu, X., Li, R., Wang, X., Han, L., Xiao, X., Wang, X., Li, W., et al. (2025) · Advanced Science · doi:10.1002/advs.202504817 · Cited by 4
Wang, X., Song, D., Zhou, Z., Jiang, Z., Zhang, N., Zhang, H., & Xia, D. (2023) · PubMed Central · Cited by 3
Li, R., Tong, R., Zhang, J. L., Zhang, Z., Deng, M., & Hou, G. (2024) · Journal of Cancer Research and Clinical Oncology · doi:10.1007/s00432-024-05774-7 · Cited by 3
Wei, S., Yu, Z., Shi, R., An, L., Zhang, Q., Zhang, Q., Zhang, T., Zhang, J., & Wang, H. (2022) · Research Square · doi:10.21203/rs.3.rs-1550688/v1 · Cited by 3
Hu, N., Xin, N., Wang, Y., Liu, D., Zhao, Y., Xu, M., Li, F., Miao, J., Ji, S., & Wang, L. (2025) · Ecotoxicology and Environmental Safety · doi:10.1016/j.ecoenv.2025.118625 · Cited by 2
Feng, L., Han, S., Li, Y., Zhan, S., Li, L., Wang, Y., & Feng, J. (2025) · European Journal of Pharmacology · doi:10.1016/j.ejphar.2025.178385 · Cited by 2
A CREB5-NR4A1 checkpoint protects against disc degeneration by controlling ferroptosis
Huang, Y., Xiao, B., Liang, H., Zhu, Y., Yang, S., Li, S., Shi, Y., Wang, X., & Wang, X. (2026) · Osteoarthritis and Cartilage · doi:10.1016/j.joca.2026.03.115 · Cited by 2
Yang, X., Guo, C., Lu, Y., Zhou, R., Liu, Z., Yang, Z., Xu, S., & Li, W. (2026) · Journal of Translational Medicine · doi:10.1186/s12967-026-08247-2 · Cited by 2
Bibliometric analysis of ferroptosis: a comprehensive evaluation of its contribution to lung cancer
Yao, F., Guo, F., Sun, C., Wang, E., Wang, H., & Li, N. (2025) · Frontiers in Genetics · doi:10.3389/fgene.2024.1449491 · Cited by 1
Zhang, C., Li, X., Feng, C., Sha, H., Luo, X., Ai, S., Zou, G., Zhang, J., & Liang, H. (2025) · Water Biology and Security · doi:10.1016/j.watbs.2025.100422 · Cited by 1
Zinc oxide nanoparticles as emerging modulators of ferroptosis in cancer therapy
Kumari, N., Sivasubramanian, N., Prabhune, N. M., & Prabhu, S. (2025) · Journal of Drug Delivery Science and Technology · doi:10.1016/j.jddst.2025.107697 · Cited by 1
Du, L., Xu, G., Zhang, X., Zhang, Z., Yang, Y., Teng, H., & Yang, T. (2024) · Global Medical Genetics · doi:10.1055/s-0044-1789199 · Cited by 1
Self-citationZhang, Y. (2021) · Research Square · doi:10.21203/rs.3.rs-1058834/v1 · Cited by 1
Zhang, J., Wang, D., Chen, X., Yu, M., Guo, M., Zhang, D., Chen, W., & Xu, F. (2022) · Research Square · doi:10.21203/rs.3.rs-1311625/v1
Guo, M., Li, W., Liu, M., Wang, C., Zhang, L., & Zhang, H. (2022) · Research Square · doi:10.21203/rs.3.rs-1631687/v1
Metadata
- Authors
- Wang, Z., Zhang, X., Tian, X., Yang, Y., Ma, L., Wang, J., & Yu, Y.
- Affiliations
- Shanghai University of Traditional Chinese Medicine (CN)
- Shanghai Jiao Tong University (CN)
- Tongji University (CN)
- Corresponding author
- Wang, Jiayi
- Yu, Yongchun
- Venue
- Oncology Reports
- Publisher
- Spandidos Publications
- Published
- 2021-04-02
- Volume
- 45
- Issue
- 6
- ISSN
- 1021-335X (ISSN-L)
- 1791-2431
- PMC
- PMC8042667
- OpenAlex
- W3146768338
- Cited by
- 122
- References
- 53
- Citations by year
- 2026: 14 · 2025: 16 · 2024: 34 · 2023: 25 · 2022: 22 · 2021: 11
- FWCI
- 15.75
- Type
- journal article
- Language
- en
- Open access
- hybrid
- doi.org
- Licence
- cc-by-nc-nd
- Locations
- Oncology Reports (publishedVersion, cc-by-nc-nd)
- PubMed Central (publishedVersion, cc-by-nc-nd)
- PubMed (publishedVersion)
- Funders
- National Natural Science Foundation of China (81871907, 81822029, 81902869, 81902315, 81774291, 81672332)
- Shanghai Education Development Foundation (18CG16)
- Shanghai Municipal Education Commission
- Shanghai Chest Hospital (2018YNJCQ06)
- Topics
- Life Sciences › Biochemistry, Genetics and Molecular Biology › Cancer Research › Ferroptosis and cancer prognosis
- Life Sciences › Biochemistry, Genetics and Molecular Biology › Molecular Biology › Cell death mechanisms and regulation
- Health Sciences › Medicine › Hematology › Iron Metabolism and Disorders
- Keywords
- CREB, GPX4, ferroptosis, lung adenocarcinoma, EP300, lipid peroxidation, transcriptional regulation, 4-hydroxynonenal, apoptosis, bZIP domain, protein-protein interaction, tumor malignancy
- MeSH terms
- Adenocarcinoma of Lung, Ferroptosis, Phospholipid Hydroperoxide Glutathione Peroxidase, Humans, Lung, Lung Neoplasms, Promoter Regions, Genetic, Protein Binding, Lipid Peroxidation, Transcriptional Activation, Gene Expression Regulation, Neoplastic, Cyclic AMP Response Element-Binding Protein, Cell Line, Tumor, E1A-Associated p300 Protein, Gene Knockdown Techniques, HEK293 Cells, Datasets as Topic
About these checks
Registry, retraction, Cites and statistics results are computed, not judged, with one exception: a printed reference that no index lists is read once by a model before it counts as a citation error. Claims are extracted by a model and kept only when their quote appears verbatim in the text; each cited source is then checked, with a model’s help, for whether it says what the claim relies on. Those verdicts can be wrong — read the claim’s quote and the cited source before relying on one.
Statistics and arithmetic are recomputed, not judged.
Confidence bands are shown only for fields calibrated on our annotated test set. None is calibrated yet, so no band is shown.
What counts as a claim ›How we measure confidence ›How we check this ›
Are you an author, or do you see a problem with this page? Request a review
