Cited by 40

The DOI matches its Crossref record; 3 of the 3 references it cites were found in a registry or an index.

The human transcriptome is enriched for miRNA-binding sites located in cooperativity-permitting distance

Rinck, Andrea, Preusse, Martin, Laggerbauer, Bernhard, Lickert, Heiko, Engelhardt, Stefan, Theis, Fabian J.·2013·RNA Biology

Overview

The claims and statistics of this paper haven’t been checked yet.

Run the check — free, no account needed. It reads the open-access text and checks the sources it cites.

A few free checks a day · papers already verified open instantly · results are public

Integrity signals

Registry

Crossref · 10.4161/rna.24955

Cites

3 of 3 references verified0 citation errors · 0 not checkable

Statistics

Figures

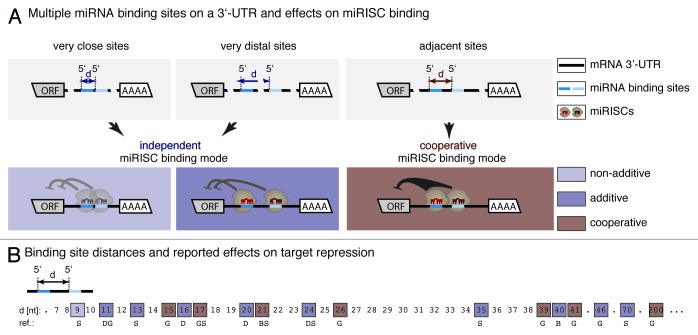
Figure 1. Distance between multiple miRNA binding sites as predictor of cooperative target regulation. (A) Concerted miRNA target regulation (in the context of miRISCs) may be described by independent or cooperative activities. An independent mode of repression has been described for very close and for very distant sites. Non-additive effects would be expected if overly close sites exclude simultaneous binding of miRNAs. Additive effects may occur when miRNAs occupy sites autonomously without activity-enhancing interactions between their miRISCs. In contrast, cooperative activity has been shown for miRNAs, whose binding sites on a specific mRNA are within a certain distance referred to as cooperativity range. The term cooperativity refers to a synergistic effect amplifying miRNA-mediated repression to an extent greater than expected from independent sites. (B) Summary of previous experimental studies investigating distance-dependency of cooperative target repression by multiple small RNA binding sites. Inter-site distances (d) tested in the reports (squares) are shown as the distance between adjacent miRNA 5′ ends on the respective mRNA target. Square colors, light and dark blue indicate that the repressive effect of multiple binding sites was weaker/similar or stronger than for a single target site. Brown squares emphasize 5′-to-5′ distances for which repression has been reported significantly greater than expected from additive effects (cooperative miRISC binding mode). The accumulation of cooperative regulation for distances between 15‒26 nucleotides indicates that directly adjacent miRISCs (with certain variations) have the highest potential to repress their target in a cooperative way. Cooperative regulation outside of the core cooperativity range might occur due to secondary structure formations of the target sequence. D, Doench et al.;43 S, Saetrom et al.;41 G, Grimson et al.;23 B, Broderick et al.42
Figure 1. Distance between multiple miRNA binding sites as predictor of cooperative target regulation. (A) Concerted miRNA target regulation (in the context of miRISCs) may be described by independent or cooperative activities. An independent mode of repression has been described for very close and for very distant sites. Non-additive effects would be expected if overly close sites exclude simultaneous binding of miRNAs. Additive effects may occur when miRNAs occupy sites autonomously without activity-enhancing interactions between their miRISCs. In contrast, cooperative activity has been shown for miRNAs, whose binding sites on a specific mRNA are within a certain distance referred to as cooperativity range. The term cooperativity refers to a synergistic effect amplifying miRNA-mediated repression to an extent greater than expected from independent sites. (B) Summary of previous experimental studies investigating distance-dependency of cooperative target repression by multiple small RNA binding sites. Inter-site distances (d) tested in the reports (squares) are shown as the distance between adjacent miRNA 5′ ends on the respective mRNA target. Square colors, light and dark blue indicate that the repressive effect of multiple binding sites was weaker/similar or stronger than for a single target site. Brown squares emphasize 5′-to-5′ distances for which repression has been reported significantly greater than expected from additive effects (cooperative miRISC binding mode). The accumulation of cooperative regulation for distances between 15‒26 nucleotides indicates that directly adjacent miRISCs (with certain variations) have the highest potential to repress their target in a cooperative way. Cooperative regulation outside of the core cooperativity range might occur due to secondary structure formations of the target sequence. D, Doench et al.;43 S, Saetrom et al.;41 G, Grimson et al.;23 B, Broderick et al.42CC BY-NC · PubMed Central
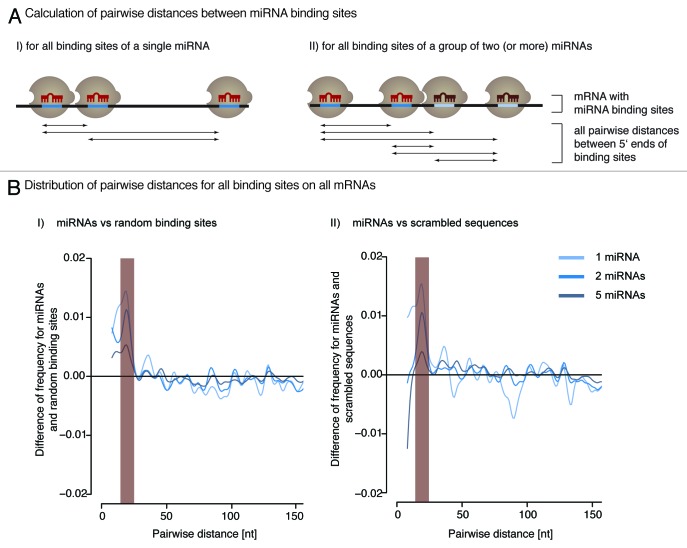
Figure 2. Naturally occurring miRNA binding sites are more frequently spaced within the cooperativity range (15‒26 nucleotides) than expected by chance. (A) The pairwise distance between all binding sites of a single (I) or multiple (II) miRNAs is calculated for each mRNA 3′-UTR. (B) The distribution of pairwise distances shows an enrichment of the cooperativity permitting distance for miRNAs compared with randomly picked sites (I) and predicted binding sites of scrambled sequences (II) (p < 2.2 × 10⁻¹⁶, Wilcoxon Rank Sum test).
Figure 2. Naturally occurring miRNA binding sites are more frequently spaced within the cooperativity range (15‒26 nucleotides) than expected by chance. (A) The pairwise distance between all binding sites of a single (I) or multiple (II) miRNAs is calculated for each mRNA 3′-UTR. (B) The distribution of pairwise distances shows an enrichment of the cooperativity permitting distance for miRNAs compared with randomly picked sites (I) and predicted binding sites of scrambled sequences (II) (p < 2.2 × 10⁻¹⁶, Wilcoxon Rank Sum test).CC BY-NC · PubMed Central
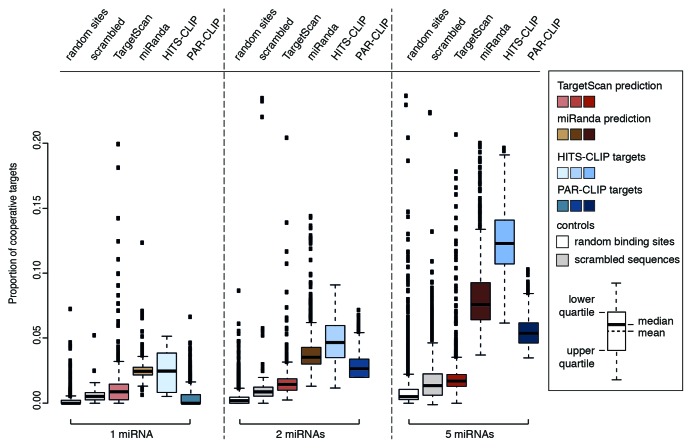
Figure 3. The fraction of cooperative targets per total targets grows for increasing numbers of miRNAs. Analysis of cooperative targets was performed with computationally predicted (TargetScan, red; miRanda, brown) and experimentally identified (HITS-CLIP, light blue; PAR-CLIP, dark blue) target sets. The proportion of cooperative targets is plotted for single miRNAs and sampled groups of two and five miRNAs. The mean is always higher for existing miRNAs than either of the controls (p < 2.2 × 10⁻¹⁶, tested with Wilcoxon Rank Sum test), except PAR-CLIP data for single miRNAs. This indicates that they are more often located in a potential cooperative distance than expected by chance.
Figure 3. The fraction of cooperative targets per total targets grows for increasing numbers of miRNAs. Analysis of cooperative targets was performed with computationally predicted (TargetScan, red; miRanda, brown) and experimentally identified (HITS-CLIP, light blue; PAR-CLIP, dark blue) target sets. The proportion of cooperative targets is plotted for single miRNAs and sampled groups of two and five miRNAs. The mean is always higher for existing miRNAs than either of the controls (p < 2.2 × 10⁻¹⁶, tested with Wilcoxon Rank Sum test), except PAR-CLIP data for single miRNAs. This indicates that they are more often located in a potential cooperative distance than expected by chance.CC BY-NC · PubMed Central
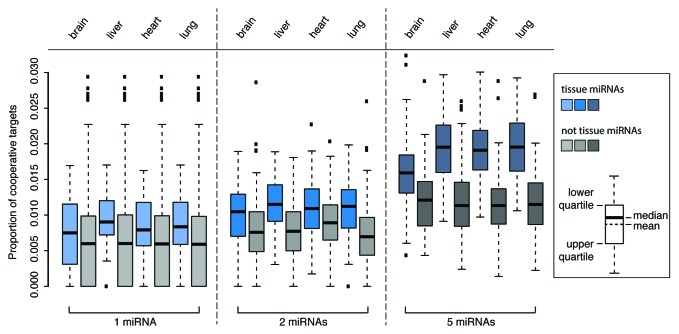
Figure 4. Functionally related miRNAs show an enrichment of target sites within the cooperativity range. Fraction of potentially cooperative targets for miRNAs in four exemplary tissues (blue) compared with a control set of miRNAs not expressed within the respective tissue (gray). Targeting within the cooperativity permitting distance is over-represented for co-expressed miRNAs (one-sided Wilcoxon Rank Sum test with p < 2.2 × 10⁻¹⁶).
Figure 4. Functionally related miRNAs show an enrichment of target sites within the cooperativity range. Fraction of potentially cooperative targets for miRNAs in four exemplary tissues (blue) compared with a control set of miRNAs not expressed within the respective tissue (gray). Targeting within the cooperativity permitting distance is over-represented for co-expressed miRNAs (one-sided Wilcoxon Rank Sum test with p < 2.2 × 10⁻¹⁶).CC BY-NC · PubMed Central
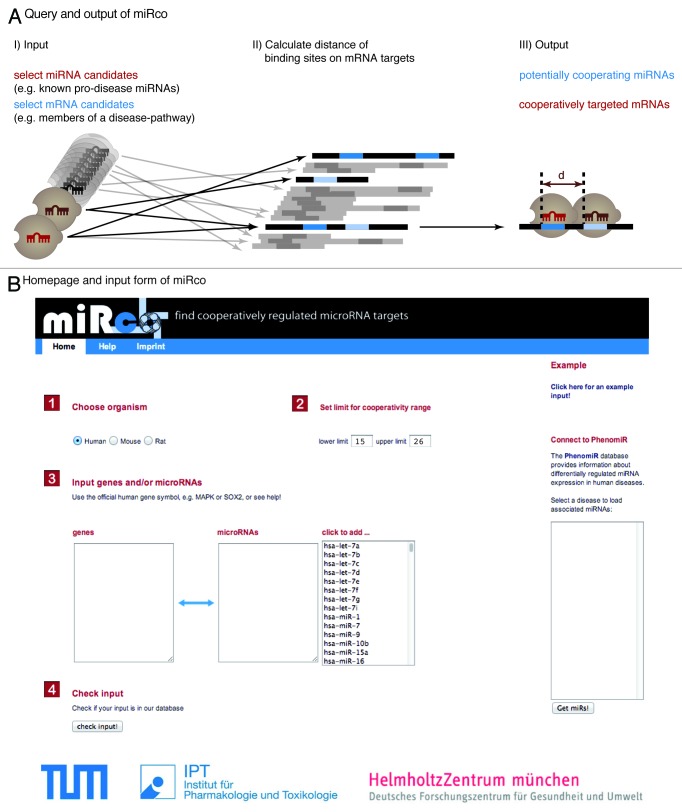
Figure 5. Functionality of the miRco web application. (A) A search for cooperative miRNA-target interactions is performed by selecting miRNA candidates, relevant target genes or both. The user is able to specify parameters for the range in which the spacing between two adjacent miRISC binding sites (d) is assumed to lead to cooperative target repression. Default values are 15‒26 nucleotides. Predictions for three species are available: human, mouse and rat. (B) Screenshot of the user interface of the online tool.
Figure 5. Functionality of the miRco web application. (A) A search for cooperative miRNA-target interactions is performed by selecting miRNA candidates, relevant target genes or both. The user is able to specify parameters for the range in which the spacing between two adjacent miRISC binding sites (d) is assumed to lead to cooperative target repression. Default values are 15‒26 nucleotides. Predictions for three species are available: human, mouse and rat. (B) Screenshot of the user interface of the online tool.CC BY-NC · PubMed Central

Verification

Claims the paper makes

The claims and statistics of this paper haven’t been checked yet.

Run the check — free, no account needed. It reads the open-access text and checks the sources it cites.

A few free checks a day · papers already verified open instantly · results are public

Claims other papers make about this one

Each is checked against this paper’s own text: does it say what the citing paper says it does?

Self-check

Percentages, sums and reported differences re-computed from the paper’s own numbers.

The self-check needs the paper’s full text.

Citations

Cites

Show all 3 references

Research works printed but not linked: 56

  1. 10.1016/j.cell.2009.01.002 · DOI · Paper page
  2. 10.1038/nrm2619 · DOI
  3. 10.1073/pnas.0608791103 · DOI
  4. 10.1038/nm.2577 · DOI
  5. 10.1073/pnas.1016611107 · DOI
  6. 10.1523/JNEUROSCI.3883-11.2011 · DOI · Paper page
  7. 10.1038/ncb2211 · DOI
  8. 10.1038/icb.2011.114 · DOI
  9. 10.1016/j.yjmcc.2011.07.010 · DOI
  10. 10.1016/j.molcel.2010.11.038 · DOI · Paper page
  11. 10.1016/j.molcel.2010.03.007 · DOI
  12. 10.1161/CIRCULATIONAHA.112.000882 · DOI
  13. 10.1016/j.ceb.2009.04.009 · DOI · Paper page
  14. 10.1073/pnas.0707594105 · DOI
  15. 10.1038/nature07242 · DOI · Paper page
  16. 10.1261/rna.1399509 · DOI
  17. 10.1038/nature09267 · DOI · Paper page
  18. 10.1038/nsmb.1921 · DOI
  19. 10.1038/nrg2290 · DOI
  20. 10.1016/j.cell.2004.12.035 · DOI · Paper page
  21. 10.1016/j.molcel.2007.06.017 · DOI · Paper page
  22. 10.1101/gr.082701.108 · DOI · Paper page
  23. 10.1371/journal.pbio.0020363 · DOI · Paper page
  24. 10.1093/nar/gkm995 · DOI
  25. 10.1186/gb-2010-11-8-r90 · DOI · Paper page
  26. Chi SW, 2009, Nature, 460, 479, 10.1038/nature08170 · DOI · Paper page
  27. 10.1016/j.cell.2010.03.009 · DOI · Paper page
  28. 10.1038/nsmb.1838 · DOI · Paper page
  29. 10.1371/journal.pgen.1002363 · DOI
  30. Kowarsch A, Marr C, Schmidl D, Ruepp A, Theis FJ. Tissue-Specific Target Analysis of Disease-Associated MicroRNAs in Human Signaling Pathways. Morris RJ, ed.PLoS ONE. 2010;5(6):e11154. · DOI
  31. 10.1261/rna.2474511 · DOI
  32. 10.1038/nature07228 · DOI · Paper page
  33. 10.1016/S0092-8674(03)01018-3 · DOI · Paper page
  34. 10.1016/j.ydbio.2003.12.003 · DOI
  35. 10.1016/0092-8674(93)90529-Y · DOI · Paper page
  36. 10.1016/0092-8674(93)90530-4 · DOI · Paper page
  37. 10.1093/nar/gkh968 · DOI
  38. 10.1101/gad.1064703 · DOI
  39. 10.1093/nar/gkm133 · DOI
  40. 10.1261/rna.2778911 · DOI
  41. 10.1101/gad.1184404 · DOI
  42. Hill AV, 1910, J Physiol, 40, 190, 10.1113/jphysiol.1910.sp001366 · DOI
  43. 10.1038/nsmb.2115 · DOI
  44. 10.1093/bioinformatics/btp649 · DOI
  45. 10.1186/gb-2010-11-1-r6 · DOI
  46. 10.1158/0008-5472.CAN-06-2698 · DOI · Paper page
  47. 10.1261/rna.804508 · DOI · Paper page
  48. 10.1016/S0076-6879(06)11019-8 · DOI
  49. 10.1161/CIRCRESAHA.112.269035 · DOI
  50. 10.1016/j.stem.2011.03.001 · DOI
  51. 10.1016/j.stem.2011.05.001 · DOI
  52. Jiang P, 2012, MicroRNA, 1, 70, 10.2174/2211536611201010070 · DOI · Paper page
  53. 10.2174/138920312801619394 · DOI
  54. 10.1101/gr.103259.109 · DOI
  55. 10.1093/nar/gkq1056 · DOI
  56. 10.1080/01621459.1972.10481279 · DOI

Cited by

Sorted by citations

Metadata

Authors
Rinck, A., Preusse, M., Laggerbauer, B., Lickert, H., Engelhardt, S., & Theis, F. J.
Venue
RNA Biology
Published
2013-07
Volume
10
Issue
7
Pages
1125-1135
ISSN
  • 1547-6286
  • 1555-8584
Cited by
40
References
3
Language
en

About these checks

Registry, retraction, Cites and statistics results are computed, not judged, with one exception: a printed reference that no index lists is read once by a model before it counts as a citation error. Claims are extracted by a model and kept only when their quote appears verbatim in the text; each cited source is then checked, with a model’s help, for whether it says what the claim relies on. Those verdicts can be wrong — read the claim’s quote and the cited source before relying on one.

Statistics and arithmetic are recomputed, not judged.

Confidence bands are shown only for fields calibrated on our annotated test set. None is calibrated yet, so no band is shown.

What counts as a claim ›How we measure confidence ›How we check this ›

Are you an author, or do you see a problem with this page? Request a review