

The DOI matches its Crossref record; 35 of the 35 references it cites were found in a registry or an index; none of the 35 sources its claims cite is checked for support yet.
The Burden of Hospital Morbidity and Mortality in Ghana: A Four-Year Retrospective Analysis of National Data
Open accessAbstract
Background: Understanding hospital admission and mortality trends is essential for enhancing health system performance in low- and middle-income countries. In Ghana, systemic challenges such as unequal access to care, workforce shortages, and changing disease patterns – exacerbated by the COVID-19 pandemic – underscore the need for comprehensive health data analysis. This study examines national hospital morbidity and mortality trends from 2019 to 2023, identifying demographic and clinical factors that predict mortality to inform policy and health system reforms. Methods: A retrospective analysis was performed using data from Ghana’s District Health Information Management System-2 (DHIMS-2), covering 2,357,535 hospital admissions across 15 regions from 2019 to 2023. Descriptive statistics and multivariate logistic regression were employed to investigate patterns in morbidity, mortality, and associated risk factors, based on patient demographics, insurance status, disease classification (ICD-11), and length of hospital stay. Results: Hospital mortality throughout the study period was 2.6%. Infectious and parasitic diseases were the primary causes of admission (30.1%), while diseases of the nervous system exhibited the highest case fatality rate (13.8%). Mortality was significantly greater from 2020 to 2023 compared with 2019, with the highest odds observed in 2023 (AOR = 1.50; 95% CI: 1.46–1.54). Advanced age (≥65 years), male sex, lack of insurance, short hospital stays (<1 day), and comorbid conditions were all linked to higher mortality. Admissions due to neoplasms, circulatory, respiratory, and neurological conditions demonstrated notably high adjusted odds of mortality. Conversely, admissions covered by health insurance, female patients, and those with stays of 3–7 days had a reduced mortality risk. Conclusion: This national review highlights ongoing gaps in the health system that lead to hospital mortality, especially for complex conditions and vulnerable groups. While the National Health Insurance Scheme looks protective, disparities still exist across age, sex, region, and disease types. Urgent investments in diagnostic and critical care, along with expanding insurance coverage and regional resource distribution, are needed to reduce preventable hospital deaths in Ghana.
Overview
CoChat Summary
TL;DR
This retrospective analysis of 2,357,535 Ghanaian hospital admissions from 2019–2023 found an overall hospital mortality rate of 2.6%, with mortality odds rising significantly after 2019 and peaking in 2023. Infectious/parasitic diseases caused most admissions, but nervous system diseases had the highest case fatality rate, and older age, male sex, lack of insurance, short stays, and comorbidities predicted higher mortality.
Key findings
- Among 2,357,535 admissions, 61,192 (2.6%) died; infectious or parasitic diseases accounted for 30.1% of admissions, while diseases of the nervous system had the highest case fatality rate at 13.8%.
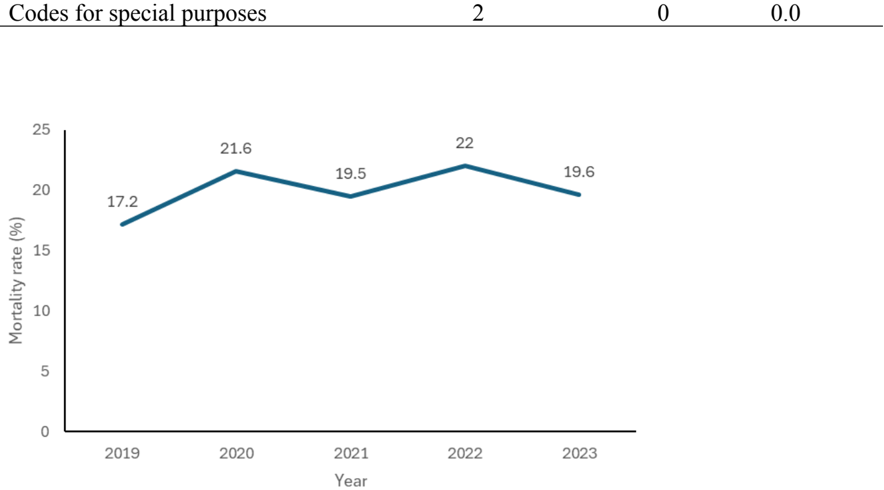
- Mortality odds were significantly higher in 2020–2023 than in 2019: 2020 AOR = 1.29 (95% CI 1.26–1.33), 2021 AOR = 1.27 (1.23–1.30), 2022 AOR = 1.30 (1.26–1.33), and 2023 AOR = 1.50 (1.46–1.54), all p < 0.001.
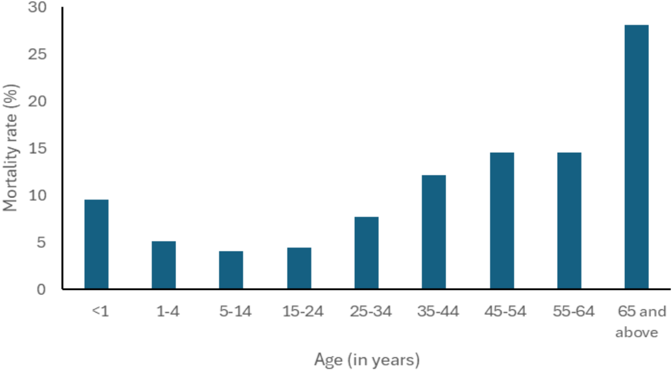
- Higher adjusted mortality odds were found for age ≥65 years (AOR = 2.41; 95% CI 2.23–2.60), another diagnosis besides the primary diagnosis (AOR = 1.40; 1.38–1.43), and admissions due to nervous system diseases (AOR = 4.01; 3.88–4.14), respiratory diseases (AOR = 2.00; 1.93–2.06), neoplasms (AOR = 1.74; 1.64–1.85), and circulatory diseases (AOR = 1.20; 1.16–1.24) compared with infectious/parasitic diseases.
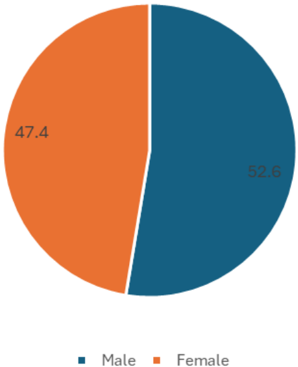
- Protective factors included health insurance (AOR = 0.68; 95% CI 0.67–0.70), female sex (AOR = 0.74; 0.72–0.75), and hospital stays of 3–7 days versus <1 day (AOR = 0.29; 0.28–0.30); Greater Accra had the highest mortality proportion (27.7%) and AOR = 1.90 (1.76–2.06) versus Ahafo, while Savannah had lower odds (AOR = 0.57; 0.48–0.67).
Methods
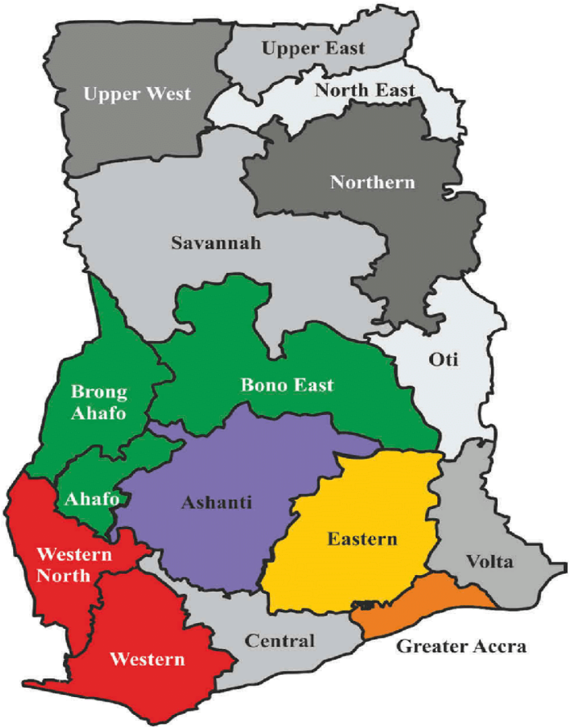
- Retrospective analysis of nationally representative DHIMS-2 data covering 2,357,535 hospital admissions from 2019 to 2023 across 15 of Ghana’s 16 regions; the North East Region was excluded because of incomplete data.
- Explanatory variables included year of admission, age, occupation, marital status, education, facility type/status, region, and health insurance status; outcome was dichotomous mortality, with morbidity and case fatality classified using ICD-11 broad categories.
- Descriptive statistics by person, place, and time were used, followed by bivariate and multivariable logistic regression; variables with p < 0.05 in bivariate analysis entered the adjusted model, with adjusted odds ratios reported at a 5% significance level and 95% confidence intervals.
Limitations
- The paper states that hospital-only data may miss deaths occurring outside health facilities; ICD-11 and administrative data may introduce coding errors and misclassification; detailed clinical data such as laboratory results and comorbidities beyond the second diagnosis were lacking; socioeconomic variables including housing, income, and urban/rural residence were omitted; and North East Region data were excluded due to insufficiency.
- Evident from the text: the retrospective observational design cannot establish causality, and DHIMS-2 excludes leading teaching hospitals for specific indicators, so some national admissions may be incompletely captured.
Model-written summary. Check it against the paper before relying on it.
Integrity signals
Registry
Cites
Statistics
Figures
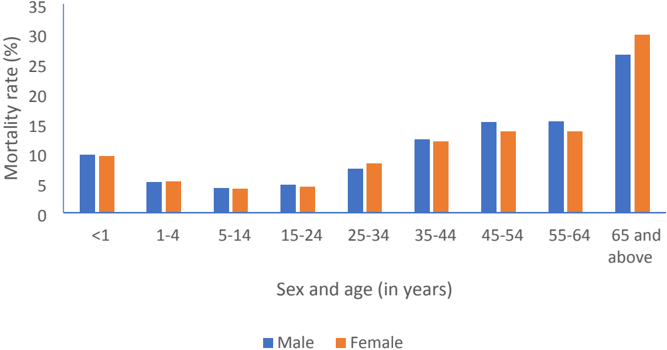
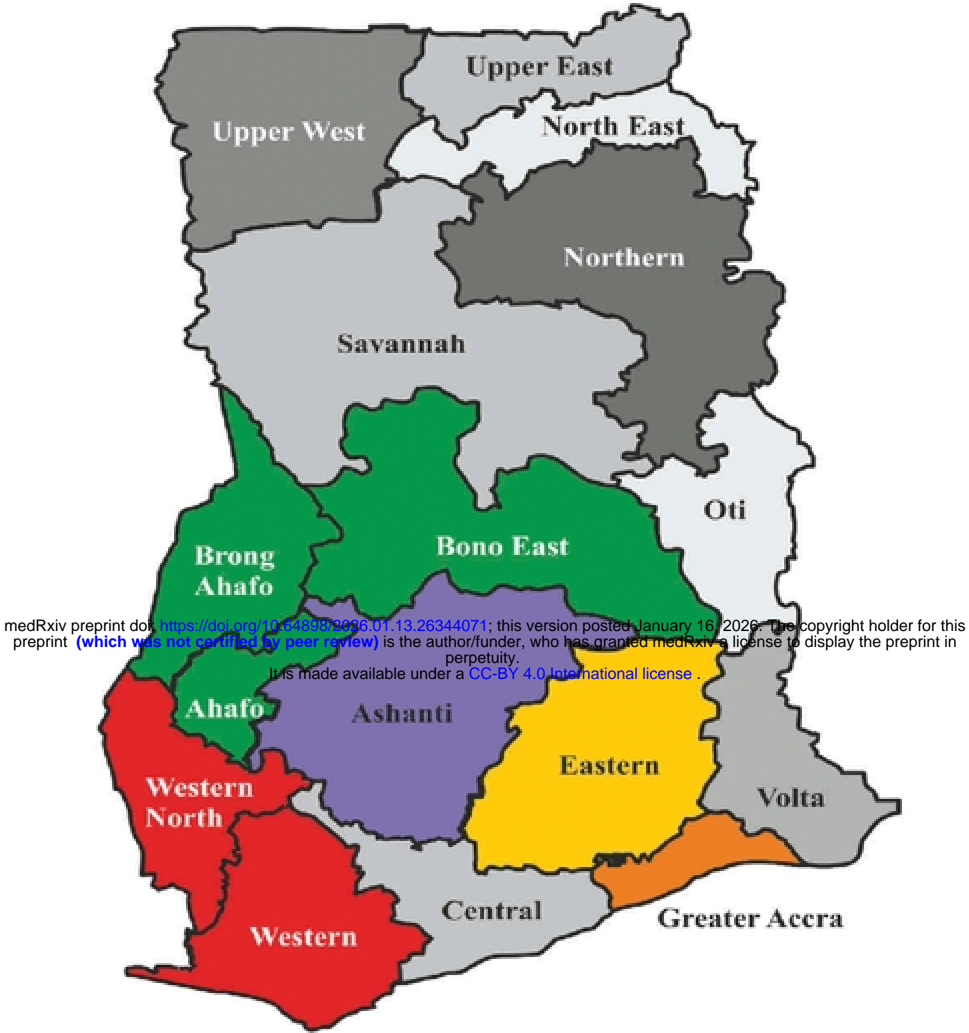
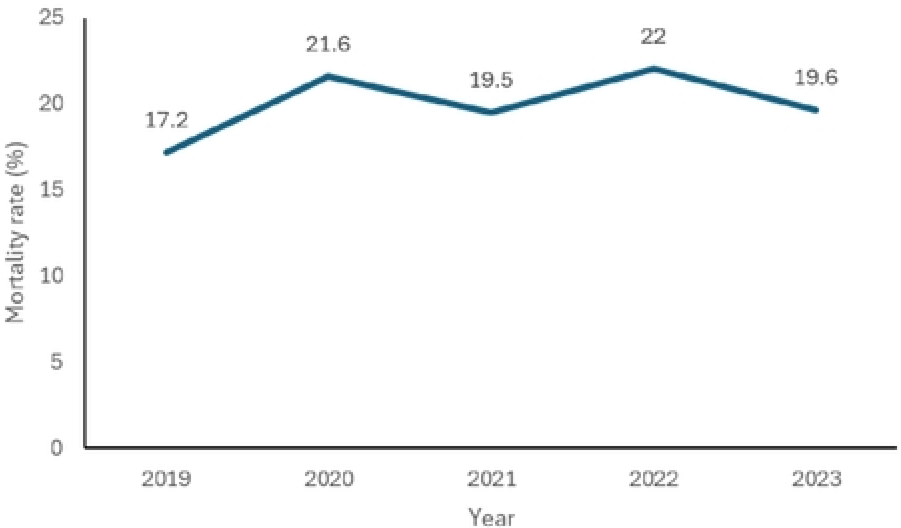
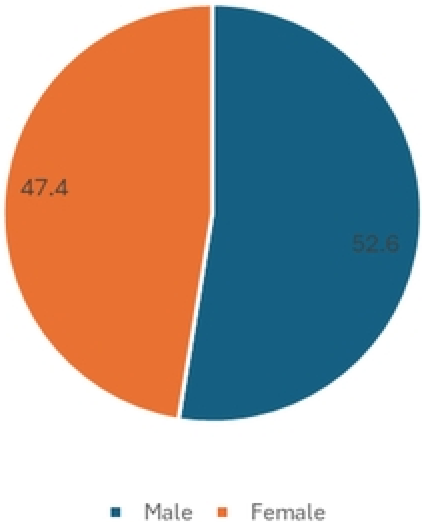
Verification
Claims the paper makes
64 Own result · 10 Check pending · 10 Not checked yet · 9 Own interpretation · 6 Own method · 2 Sources not found
A result the paper reports from its own data — it cites no other source for it, so there is none to check. The quote shows it is in the paper.
In the paper
“admissions in Greater Accra were almost two times more likely (AOR=1.90;95% CI: 1.76-2.06;p<0.001)”
§ The Burden of Hospital Morbidity and Mortality in Ghana: A Four-Year Retrospective Analysis of National Data > Results
plainstates an association- Asserted: passes — The authors put it forward as true.
- Checkable: passes — It can be checked against evidence.
- Load-bearing: unclear — It is unclear whether the paper’s conclusions depend on it.
- Based: passes — The paper gives a reason why it holds.
- Rests on an assumption not shown here.
A result the paper reports from its own data — it cites no other source for it, so there is none to check. The quote shows it is in the paper.
In the paper
“admissions in 2021 were 1.27 times more likely (AOR=1.27;95% CI: 1.23-1.30;p<0.001)”
§ The Burden of Hospital Morbidity and Mortality in Ghana: A Four-Year Retrospective Analysis of National Data > Results
plainstates an association- Asserted: passes — The authors put it forward as true.
- Checkable: passes — It can be checked against evidence.
- Load-bearing: passes — The paper’s conclusions depend on it.
- Based: passes — The paper gives a reason why it holds.
- Rests on an assumption not shown here.
A result the paper reports from its own data — it cites no other source for it, so there is none to check. The quote shows it is in the paper.
In the paper
“admissions in 2023 were 1.5 times more likely (AOR=1.50;95% CI: 1.46-1.54;p<0.001) to result in mortality as compared to hospital admissions in 2019.”
§ The Burden of Hospital Morbidity and Mortality in Ghana: A Four-Year Retrospective Analysis of National Data > Results
plainstates an association- Asserted: passes — The authors put it forward as true.
- Checkable: passes — It can be checked against evidence.
- Load-bearing: passes — The paper’s conclusions depend on it.
- Based: passes — The paper gives a reason why it holds.
- Rests on an assumption not shown here.
A result the paper reports from its own data — it cites no other source for it, so there is none to check. The quote shows it is in the paper.
In the paper
“persons who spent more than one week on admission were 39% less likely (AOR=0.61;95% CI: 0.59-0.62;p<0.001)”
§ The Burden of Hospital Morbidity and Mortality in Ghana: A Four-Year Retrospective Analysis of National Data > Results
plainstates an association- Asserted: passes — The authors put it forward as true.
- Checkable: passes — It can be checked against evidence.
- Load-bearing: unclear — It is unclear whether the paper’s conclusions depend on it.
- Based: passes — The paper gives a reason why it holds.
- Rests on an assumption not shown here.
A result the paper reports from its own data — it cites no other source for it, so there is none to check. The quote shows it is in the paper.
In the paper
“hospital admissions due to neoplasms were 1.74 times more likely (AOR=1.74;95% CI: 1.64-1.85;p<0.001)”
§ The Burden of Hospital Morbidity and Mortality in Ghana: A Four-Year Retrospective Analysis of National Data > Results
plainstates an association- Asserted: passes — The authors put it forward as true.
- Checkable: passes — It can be checked against evidence.
- Load-bearing: passes — The paper’s conclusions depend on it.
- Based: passes — The paper gives a reason why it holds.
- Rests on an assumption not shown here.
66 more claims
Create a free account to see all 101 claims and to verify the 27 references still open.
- It may state two separate claims as one. 22
- Probably not a substantial claim. 15
Self-check
Percentages, sums and reported differences re-computed from the paper’s own numbers.
Each contradiction between two passages listed here was confirmed by an independent check.
Rated minor: it would not touch a result — a value no result rests on, a p-value that stays on the same side of the significance level, or a conflict that is clerical, resolved elsewhere in the paper, or outside its own findings.
In the paper
§ The Burden of Hospital Morbidity and Mortality in Ghana: A Four-Year Retrospective Analysis of National Data
“The Burden of Hospital Morbidity and Mortality in Ghana: A Four-Year Retrospective Analysis of National Data”
§ The Burden of Hospital Morbidity and Mortality in Ghana: A Four-Year Retrospective Analysis of National Data > Study design
“A retrospective analysis of nationally representative data from 2,357,535 hospital admissions that occurred during the five years from 2019 to 2023”
Rated minor: it would not touch a result — a value no result rests on, a p-value that stays on the same side of the significance level, or a conflict that is clerical, resolved elsewhere in the paper, or outside its own findings.
In the paper
§ The Burden of Hospital Morbidity and Mortality in Ghana: A Four-Year Retrospective Analysis of National Data > Trends in Morbidity and Mortality
“the odds of mortality rose year-on-year”
§ The Burden of Hospital Morbidity and Mortality in Ghana: A Four-Year Retrospective Analysis of National Data > Results
“2020 1.42 (1.38, 1.45) <0.001* 1.29 (1.26, 1.33) <0.001* 2021 1.58 (1.54, 1.62) <0.001* 1.27 (1.23, 1.30) <0.001*”
Citations
Cites
Vos, T., Lim, S. S., Abbafati, C., Abbas, K. M., Abbasi, M., Abbasifard, M., Abbasi-Kangevari, M., Abbastabar, H., Abd-Allah, F., Abdelalim, A., et al. (2020) · The Lancet · doi:10.1016/s0140-6736(20)30925-9 · Cited by 19,358
Global Burden of Cardiovascular Diseases and Risk Factors, 1990–2019
Roth, G. A., Mensah, G. A., Johnson, C. O., Addolorato, G., Ammirati, E., Baddour, L. M., Barengo, N. C., Beaton, A. Z., Benjamin, E. J., Benziger, C. P., et al. (2020) · Journal of the American College of Cardiology · doi:10.1016/j.jacc.2020.11.010 · Cited by 11,449
Barnett, K., Mercer, S. W., Norbury, M., Watt, G., Wyke, S., & Guthrie, B. (2012) · The Lancet · doi:10.1016/s0140-6736(12)60240-2 · Cited by 6,972
High-quality health systems in the Sustainable Development Goals era: time for a revolution
Kruk, M. E., Gage, A. D., Arsenault, C., Jordan, K., Leslie, H. H., Roder-DeWan, S., Adeyi, O., Barker, P., Daelmans, B., Doubova, S. V., et al. (2018) · The Lancet Global Health · doi:10.1016/s2214-109x(18)30386-3 · Cited by 4,057
Closing the gap in a generation: health equity through action on the social determinants of health
Marmot, M., Friel, S., Bell, R., Houweling, T. A., & Taylor, S. (2008) · The Lancet · doi:10.1016/s0140-6736(08)61690-6 · Cited by 3,247
Feigin, V. L., Abajobir, A. A., Abate, K. H., Abd-Allah, F., Abdulle, A. M., Abera, S. F., Abyu, G. Y., Ahmed, M. B., Aichour, A. N., Aichour, I., et al. (2017) · The Lancet Neurology · doi:10.1016/s1474-4422(17)30299-5 · Cited by 2,275
Ranney, M. L., Griffeth, V., & Jha, A. K. (2020) · New England Journal of Medicine · doi:10.1056/nejmp2006141 · Cited by 2,018
The burden of disease in older people and implications for health policy and practice
Prince, M. J., Wu, F., Guo, Y., Gutierrez Robledo, L. M., O'Donnell, M., Sullivan, R., & Yusuf, S. (2015) · The Lancet · doi:10.1016/s0140-6736(14)61347-7 · Cited by 1,989
Kassebaum, N. J., Smith, A. G. C., Bernabé, E., Fleming, T. D., Reynolds, A. E., Vos, T., Murray, C. J. L., Marcenes, W., Collaborators, G. 2. O. H., Abyu, G. Y., et al. (2017) · Journal of Dental Research · doi:10.1177/0022034517693566 · Cited by 1,981
Understanding differences in health behaviors by education
Cutler, D. M., & Lleras-Muney, A. (2010) · Journal of Health Economics · doi:10.1016/j.jhealeco.2009.10.003 · Cited by 1,920
Education and Health: Evaluating Theories and Evidence
Cutler, D., & Lleras-Muney, A. (2006) · doi:10.3386/w12352 · Cited by 1,507
Progress on catastrophic health spending in 133 countries: a retrospective observational study
Wagstaff, A., Flores, G., Hsu, J., Smitz, M.-F., Chepynoga, K., Buisman, L. R., van Wilgenburg, K., & Eozenou, P. (2018) · The Lancet Global Health · doi:10.1016/s2214-109x(17)30429-1 · Cited by 1,019
Kruk, M. E., Gage, A. D., Joseph, N. T., Danaei, G., García-Saisó, S., & Salomon, J. A. (2018) · The Lancet · doi:10.1016/s0140-6736(18)31668-4 · Cited by 885
Roelfs, D. J., Shor, E., Davidson, K. W., & Schwartz, J. E. (2011) · Social Science & Medicine · doi:10.1016/j.socscimed.2011.01.005 · Cited by 516
The rising burden of non-communicable diseases in sub-Saharan Africa
Bigna, J. J., & Noubiap, J. J. (2019) · The Lancet Global Health · doi:10.1016/s2214-109x(19)30370-5 · Cited by 409
Universal health coverage and universal access
Evans, D. B., Hsu, J., & Boerma, T. (2013) · Bulletin of the World Health Organization · doi:10.2471/blt.13.125450 · Cited by 274
Aranda, Z., Bindé, T., Tashman, K. C., Tadikonda, A., Mawindo, B., Maweu, D., Boley, E. J., Mphande, I., Dumbuya, I., Montaño, M., et al. (2022) · BMJ Global Health · doi:10.1136/bmjgh-2021-007247 · Cited by 220
Lewis, A. K., Harding, K. E., Snowdon, D. A., & Taylor, N. F. (2018) · BMC Health Services Research · doi:10.1186/s12913-018-3669-6 · Cited by 171
Okereke, M., Ukor, N. A., Adebisi, Y. A., Ogunkola, I. O., Favour Iyagbaye, E., Adiela Owhor, G., & Lucero‐Prisno, D. E. (2021) · The International Journal of Health Planning and Management · doi:10.1002/hpm.3067 · Cited by 167
COVID-19 threatens health systems in sub-Saharan Africa: the eye of the crocodile
Paintsil, E. (2020) · Journal of Clinical Investigation · doi:10.1172/jci138493 · Cited by 129
Dunlay, S. M., & Roger, V. L. (2012) · Current Heart Failure Reports · doi:10.1007/s11897-012-0107-7 · Cited by 111
Haileamlak, A. (2021) · Ethiopian Journal of Health Sciences · doi:10.4314/ejhs.v31i6.1 · Cited by 101
Asamani, J. A., Ismaila, H., Plange, A., Ekey, V. F., Ahmed, A.-M., Chebere, M., Awoonor-Williams, J. K., & Nabyonga-Orem, J. (2021) · Human Resources for Health · doi:10.1186/s12960-021-00590-3 · Cited by 67
Providing Neurocritical Care in Resource-Limited Settings: Challenges and Opportunities
Prust, M. L., Mbonde, A., Rubinos, C., Shrestha, G. S., Komolafe, M., Saylor, D., & Mangat, H. S. (2022) · Neurocritical Care · doi:10.1007/s12028-022-01568-2 · Cited by 67
Gender differences in symptoms of myocardial ischaemia
Mackay, M. H., Ratner, P. A., Johnson, J. L., Humphries, K. H., & Buller, C. E. (2011) · European Heart Journal · doi:10.1093/eurheartj/ehr358 · Cited by 66
Homer, C. S. E., Castro Lopes, S., Nove, A., Michel-Schuldt, M., McConville, F., Moyo, N. T., Bokosi, M., & ten Hoope-Bender, P. (2018) · BMC Pregnancy and Childbirth · doi:10.1186/s12884-018-1686-4 · Cited by 56
Lee, A., & Cho, J. (2016) · International Journal for Equity in Health · doi:10.1186/s12939-016-0483-9 · Cited by 52
Duan, W., Zheng, A., Mu, X., Li, M., Liu, C., Huang, W., & Wang, X. (2017) · Health and Quality of Life Outcomes · doi:10.1186/s12955-017-0709-6 · Cited by 26
Awor, S., Abola, B., Byanyima, R. K., Orach, C. G., Kiondo, P., Kaye, D. K., Ogwal-Okeng, J. W., & Nakimuli, A. (2023) · BMC Pregnancy and Childbirth · doi:10.1186/s12884-023-05420-z · Cited by 24
Turkal, R., Turan, C. A., Elbasan, O., Aytan, S., Çakmak, B., Gözaydınoğlu, B., Takır, D. C., Ünlü, O., Bahramzada, G., Tekin, A. F., et al. (2022) · BMC Pregnancy and Childbirth · doi:10.1186/s12884-022-04608-z · Cited by 23
Borgstein, A., Zhang, B., Lam, C. S. C., Gushu, M. B., Liomba, A. W. M., Malenga, A., Pensulo, P., Tebulo, A., Small, D. S., Taylor, T. E., et al. (2022) · Malaria Journal · doi:10.1186/s12936-022-04080-2 · Cited by 14
Narh, C. T., Der, J. B., Ofosu, A., Blettner, M., & Wollschlaeger, D. (2022) · JCO Global Oncology · doi:10.1200/go.21.00416 · Cited by 4
Kaijage, A., Mgale, Y. J., & Dimoso, P. (2023) · Open Journal of Social Sciences · doi:10.4236/jss.2023.116013 · Cited by 4
Sex Differences: Potential Impact in Vascular Physiopathology or Ischemic Heart Disease
Kingma Jr, J. G. (2022) · Cardiology & Vascular Research · doi:10.33425/2639-8486.1134 · Cited by 2
Mind the gap: Access to specialized neurological care in Africa
Charway-Felli, A. (2023) · Journal of the Neurological Sciences · doi:10.1016/j.jns.2023.121047 · Cited by 1
Research works printed but not linked: 4
- N. J. Blanchet , G. Fink , I. Osei-Akoto , and N. J. Blanchet , “The Effect of Ghana’s National Health Insurance Scheme on Health Care Utilisation,” vol. 46, 2012.
- 2021, Population and Housing Census - Ghana Statistical Service.”, Accessed: Apr, 14, 2025
- “(PDF) Optical screening for presence of banned Sudan III and Sudan IV dyes in edible palm oils.” Accessed: Apr. 13, 2025. [Online]. Available: https://www.researchgate.net/publication/339392037_Optical_screening_for_presence_of_banned_Sudan_III_and_Sudan_IV_dyes_in_edible_palm_oils
- 10.1016/j.jacc.2020.11.010 · DOI · Paper page
Cited by
Still being checked.
Metadata
- Authors
- Manyeh, A. K., Odopey, C. T., Ackon, A. N. E., Gmayinaam, V. U., Dzissem, P., Acquah, E., & Immurana, M.
- Affiliations
- University of Health and Allied Sciences (GH)
- University of Health and Allied Sciences, Institute of Health Research, Ho, Ghana
- Corresponding author
- Odopey, Christopher Tetteh
- ORCID
- Venue
- medRxiv
- Publisher
- openRxiv
- Published
- 2026-01-16
- OpenAlex
- W7124604516
- Semantic Scholar
- 2a1c54aca51ca0ec5da015e460a894e519ee2793
- Cited by
- 0
- References
- 35
- Type
- posted content
- Language
- en
- Open access
- green
- doi.org
- Licence
- Locations
- medRxiv (submittedVersion, cc-by)
- Topics
- Health Sciences › Medicine › Public Health, Environmental and Occupational Health › Global Health and Epidemiology
- Health Sciences › Medicine › Public Health, Environmental and Occupational Health › Healthcare Systems and Reforms
- Health Sciences › Medicine › Epidemiology › Chronic Disease Management Strategies
- Keywords
- in-hospital mortality, hospital morbidity, hospitalization, mortality risk factors, length of hospital stay, health insurance coverage, National Health Insurance Scheme, infectious and parasitic diseases, neurological disorders, comorbidities, age and sex disparities, Ghana, health system performance, COVID-19 pandemic
About these checks
Registry, retraction, Cites and statistics results are computed, not judged, with one exception: a printed reference that no index lists is read once by a model before it counts as a citation error. Claims are extracted by a model and kept only when their quote appears verbatim in the text; each cited source is then checked, with a model’s help, for whether it says what the claim relies on. Those verdicts can be wrong — read the claim’s quote and the cited source before relying on one.
A language model drew the claims from the paper on 2026-11-12, under version 3 of the claim definition (model deepseek-v4.1-flash, prompt extract-v3).
A second model labelled each claim on 2026-11-12 (model jev-1.13-20260917, definition revision gold-guideline-v0.2).
Statistics and arithmetic are recomputed, not judged.
Confidence bands are shown only for fields calibrated on our annotated test set. None is calibrated yet, so no band is shown.
What counts as a claim ›How we measure confidence ›How we check this ›
Are you an author, or do you see a problem with this page? Request a review
Data sources
Bibliographic data: Semantic Scholar, OpenAlex, Crossref.
Contains information from the Semantic Scholar Academic Graph Datasets, made available under the ODC Attribution License (ODC-BY 1.0).
Semantic Scholar’s data is described in: Kinney, R., et al. (2023). The Semantic Scholar Open Data Platform. arXiv:2301.10140.
