

Sensitivity Analysis in Observational Research: Introducing the E-Value
Open accessThe DOI matches its Crossref record; 58 of the 59 references it cites were found in a registry or an index.
Abstract
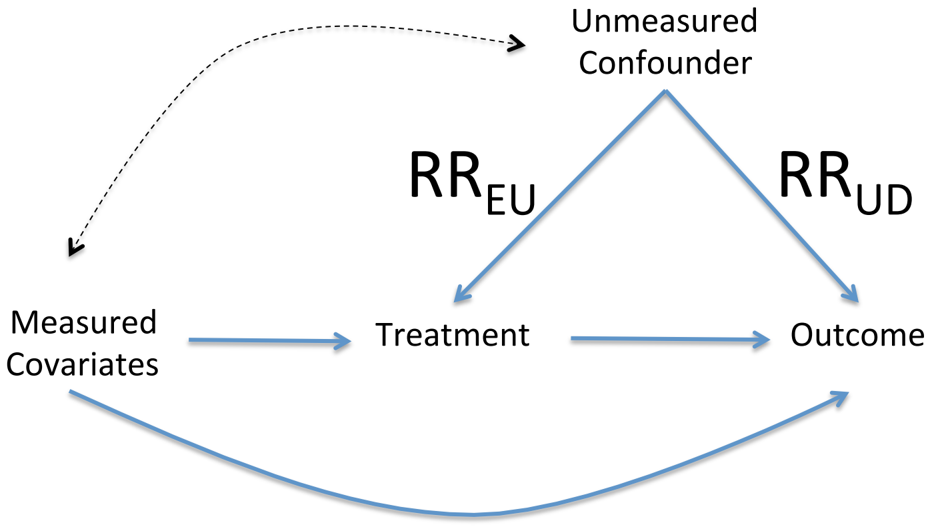
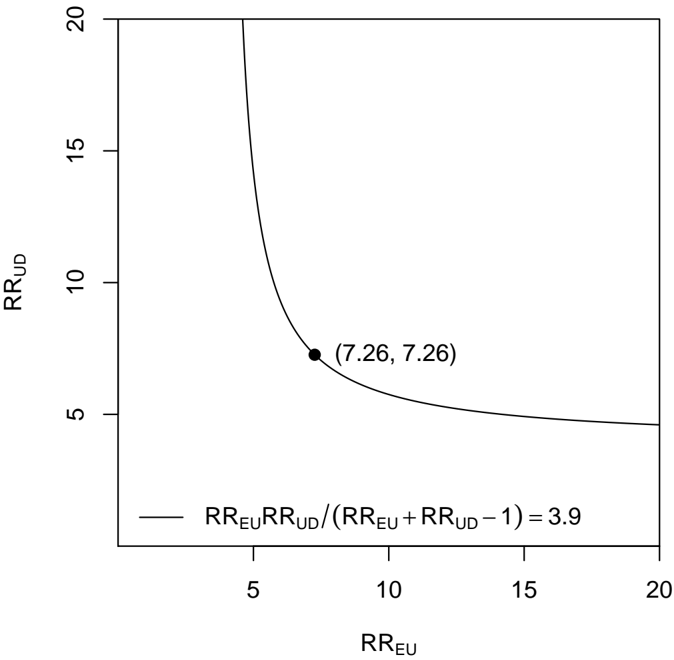
Sensitivity analysis is useful in assessing how robust an association is to potential unmeasured or uncontrolled confounding. This article introduces a new measure called the "E-value," which is related to the evidence for causality in observational studies that are potentially subject to confounding. The E-value is defined as the minimum strength of association, on the risk ratio scale, that an unmeasured confounder would need to have with both the treatment and the outcome to fully explain away a specific treatment-outcome association, conditional on the measured covariates. A large E-value implies that considerable unmeasured confounding would be needed to explain away an effect estimate. A small E-value implies little unmeasured confounding would be needed to explain away an effect estimate. The authors propose that in all observational studies intended to produce evidence for causality, the E-value be reported or some other sensitivity analysis be used. They suggest calculating the E-value for both the observed association estimate (after adjustments for measured confounders) and the limit of the confidence interval closest to the null. If this were to become standard practice, the ability of the scientific community to assess evidence from observational studies would improve considerably, and ultimately, science would be strengthened.
Overview
The claims and statistics of this paper haven’t been checked yet.
Free: it reads the open-access text and checks the first 5 claims that cite a source we can check. Create a free account to check every claim.
Integrity signals
Registry
Cites
Statistics
Figures
Verification
Claims the paper makes
The claims and statistics of this paper haven’t been checked yet.
Free: it reads the open-access text and checks the first 5 claims that cite a source we can check. Create a free account to check every claim.
Claims other papers make about this one
Each is checked against this paper’s own text: does it say what the citing paper says it does?
The cited source says what the claim attributes to it.
In the citing paper
“Quantitative bias analyses, such as the calculation of E-values to estimate the strength of unmeasured confounding required to explain away an observed association, provide useful context for the robustness of findings.64”
From Artificial Intelligence in Oncology: Practical Applications Across Clinical Care, Scholarship, and Translation. (2026) · cites this paper as [64]
The cited source says what the claim attributes to it.
In the citing paper
“We performed the sensitivity analysis using the E value [29] to evaluate the robustness of our findings to potential unmeasured confounding, with the calculation based on the observed odds ratio (OR) point estimate for rare outcome (<15%) or the square root of OR otherwise.”
The cited source says what the claim attributes to it.
In the citing paper
“To further assess the robustness of our findings to potential unmeasured confounding, we conducted an E-value analysis, a quantitative method for sensitivity analysis in observational research [31].”
From Acute Respiratory Tract Infection and Sudden Sensorineural Hearing Loss: A Multinational Cohort Study (2025) · cites this paper as [31]
In the citing paper
“We also computed E-values: indicators of how robust findings are to potential unmeasured confounding”
From Leading a meaningful life at older ages and its relationship with social engagement, prosperity, health, biology, and time use (2019) · cites this paper as [12]
Self-check
Percentages, sums and reported differences re-computed from the paper’s own numbers.
The self-check needs the paper’s full text.
Citations
Cites
Borenstein, M., Hedges, L. V., Higgins, J. P. T., & Rothstein, H. R. (2009) · doi:10.1002/9780470743386 · Cited by 14,225
The environment and disease: association or causation?
Hill, A. B. (2015) · Journal of the Royal Society of Medicine · doi:10.1177/0141076814562718 · Cited by 7,285
The Environment and Disease: Association or Causation?
Hill, A. B. (1965) · Proceedings of the Royal Society of Medicine · doi:10.1177/003591576505800503 · Cited by 6,974 · cited 1×
“Sensitivity analysis makes clear quantitatively why Bradford Hill's criterion of “strength of association” (12) is important in establishing that a given association is, in fact, causal.”
BackgroundThe ASA Statement on p -Values: Context, Process, and Purpose
Wasserstein, R. L., & Lazar, N. A. (2016) · The American Statistician · doi:10.1080/00031305.2016.1154108 · Cited by 6,306 · cited 2×
“While potentially subject to mis-use and misinterpretation (1,5-12), the p-value can be informative as a continuous measure of evidence as to whether an association is present.”
BackgroundCausal Inference for Statistics, Social, and Biomedical Sciences: An Introduction
Imbens, G. W., & Rubin, D. B. (2015) · doi:10.1017/cbo9781139025751 · Cited by 4,210
Statistical tests, P values, confidence intervals, and power: a guide to misinterpretations
Greenland, S., Senn, S. J., Rothman, K. J., Carlin, J. B., Poole, C., Goodman, S. N., & Altman, D. G. (2016) · European Journal of Epidemiology · doi:10.1007/s10654-016-0149-3 · Cited by 3,200
Explanation in Causal Inference: Methods for Mediation and Interaction
VanderWeele, T. J. (2015) · Cited by 2,217
Self-citationSmithson, M. (2000) · SAGE Publications Ltd eBooks · doi:10.4135/9781446218525 · Cited by 1,871
Fundamentals of Biostatistics.
Cornell, R. G., & Rosner, B. (1987) · Journal of the American Statistical Association · doi:10.2307/2289416 · Cited by 1,603
Breastfeeding and Maternal and Infant Health Outcomes In Developed Countries
(2007) · AAP Grand Rounds · doi:10.1542/gr.18-2-15 · Cited by 1,540 · cited 2×
“A study by the Agency for Healthcare Research and Quality (42) reported the association between breastfeeding and childhood leukemia as RR=0.”
MethodInfluential
Research works printed but not linked: 3
- Greenland S, 2011, Jurimetrics, 51, 11329
- Cornfield J, 1959, J Natl Cancer Inst, 22, 173
- Schlesselman JJ, 1978, Am J Epidemiol, 108, 3
Cited by
Items 401–500 of 1,031
Cai, M., Lin, X., Wang, X., Zhang, S., Wang, C., Zhang, Z., Pan, J., & Lin, H. (2023) · The Lancet Regional Health - Western Pacific · doi:10.1016/j.lanwpc.2022.100679 · Cited by 78
Lyu, H., Zhao, S. S., Zhang, L., Wei, J., Li, X., Li, H., Liu, Y., Yin, P., Norvang, V., Yoshida, K., et al. (2023) · BMJ · doi:10.1136/bmj-2022-073435 · Cited by 75
Li, J., Tang, W., Li, S., He, C., Dai, Y., Feng, S., Zeng, C., Yang, T., Meng, Q., Meng, J., et al. (2023) · Ecotoxicology and Environmental Safety · doi:10.1016/j.ecoenv.2023.115371 · Cited by 64
Forke, C. M., Catallozzi, M., Localio, A. R., Grisso, J. A., Wiebe, D. J., & Fein, J. A. (2019) · Preventive Medicine Reports · doi:10.1016/j.pmedr.2019.100942 · Cited by 63
“We use propensity scores and inverse probability of treatment weighting to control for multiple confounders and sensitivity analysis to guide interpretation (Rubin, 2006; VanderWeele and Ding, 2017).”
BackgroundMethodNoninvasive Ventilation Use in Critically Ill Patients with Acute Asthma Exacerbations
Althoff, M. D., Holguín, F., Yang, F., Grunwald, G. K., Moss, M., Vandivier, R. W., Ho, P. M., Kiser, T. H., & Burnham, E. L. (2020) · American Journal of Respiratory and Critical Care Medicine · doi:10.1164/rccm.201910-2021oc · Cited by 64
The role of financial literacy for financial resilience in middle-age and older adulthood
Białowolski, P., Cwynar, A., & Węziak‐Białowolska, D. (2022) · International Journal of Bank Marketing · doi:10.1108/ijbm-10-2021-0453 · Cited by 95
Shah, V. V., Villaflores, C. W. A., Chuong, L., Leuchter, R. K., Kilaru, A. S., Vangala, S., & Sarkisian, C. A. (2022) · JAMA Network Open · doi:10.1001/jamanetworkopen.2022.37783 · Cited by 62
“001 2 2622 (16) 1758 (15) 864 (17) 3 11 116 (65) 7603 (64) 3513 (68) 4 3098 (18) 2349 (20) 749 (14) 5 143 (1) 101 (1) 42 (1) Distance to emergency department, median (IQR), miles 10 (6-21) 9 (6-20) 11 (7-23) .”
Ahmadi, M. N., Rezende, L. F. M., Ferrari, G., Cruz, B. D. P., Lee, I.-M. M., & Stamatakis, E. (2024) · British Journal of Sports Medicine · doi:10.1136/bjsports-2023-107221 · Cited by 79
“31 To assess the robustness of our findings, we”
BackgroundElsaid, M. I., Li, Y., Bridges, J. F. P., Brock, G., Minacapelli, C. D., & Rustgi, V. K. (2022) · JAMA Network Open · doi:10.1001/jamanetworkopen.2022.35003 · Cited by 63
Selective serotonin reuptake inhibitors and suicidal behaviour: a population-based cohort study
Lagerberg, T., Fazel, S., Sjölander, A., Hellner, C., Lichtenstein, P., & Chang, Z. (2022) · Neuropsychopharmacology · doi:10.1038/s41386-021-01179-z · Cited by 61
Mwananyanda, L. M., Pierre, C. M., Mwansa, J. C. L., Cowden, C., Localio, A. R., Kapasa, M., Machona, S., Lukwesa‐Musyani, C., Chilufya, M., Munanjala, G., et al. (2018) · Clinical Infectious Diseases · doi:10.1093/cid/ciy1114 · Cited by 57
Jeon, H., Kwon, J. S., Park, S., & Shin, J. (2021) · The British Journal of Psychiatry · doi:10.1192/bjp.2020.251 · Cited by 69
“The E-value is the minimum strength of association, which an unmeasured confounder would need to have with both the treatment and outcome on the risk ratio scale, to explain away the observed treatment-outcome association.(15) If the calculated E-value is large, strong unmeasured confounders would be needed to fully e…”
BackgroundWhebell, S. F., Zhang, J., Lewis, R., Berry, M. T., Ledot, S., Retter, A., & Camporota, L. (2022) · Intensive Care Medicine · doi:10.1007/s00134-022-06645-w · Cited by 60
“The E value for each OR estimate of treatment effect was calculated to estimate unmeasured confounding [23, 24].”
BackgroundMethodAhrens, E., Tartler, T. M., Suleiman, A., Wachtendorf, L. J., Ma, H., Chen, G., Kendale, S. M., Kienbaum, P., Subramaniam, B., Wagner, S., et al. (2022) · British Journal of Anaesthesia · doi:10.1016/j.bja.2022.08.032 · Cited by 64
Kuang, M., Yang, R., Huang, X., Wang, C., Sheng, G., Xie, G., & Zou, Y. (2023) · Journal of Translational Medicine · doi:10.1186/s12967-023-04159-7 · Cited by 64
“Following the suggestions of VanderWeele and Ding [32], since the E-values corresponding to the TyG index and TyG-related parameters were relatively large in the current study, this suggested that there was unlikely to be an unmeasured confounder to influence the stability of the association between TyG index and TyG-…”
MethodInfluentialStone, J. C., Glass, K., Munn, Z., Tugwell, P., & Doi, S. A. R. (2020) · Journal of Clinical Epidemiology · doi:10.1016/j.jclinepi.2019.09.010 · Cited by 61
Area-level deprivation and preterm birth: results from a national, commercially-insured population
Mehra, R., Shebl, F. M., Cunningham, S. D., Magriples, U., Barrette, E., Herrera, C., Kozhimannil, K. B., & Ickovics, J. R. (2019) · BMC Public Health · doi:10.1186/s12889-019-6533-7 · Cited by 47
Spence, N. D., Farvid, M. S., Warner, E. T., VanderWeele, T. J., Tworoger, S. S., Argentieri, M. A., & Shields, A. E. (2019) · American Journal of Epidemiology · doi:10.1093/aje/kwz222 · Cited by 64
“We also assessed the sensitivity of our results to potential unmeasured confounding by computing an E value (see VanderWeele and Ding (31) for the formula); E value is the minimum strength of association on the risk ratio scale that an unmeasured confounder would require with both the exposure and the outcome, above a…”
MethodSelf-citationWen, S. W., Miao, Q., Taljaard, M., Lougheed, J., Gaudet, L., Davies, M. J., Lanes, A., Leader, A., Corsi, D. J., Sprague, A. E., et al. (2020) · Archives of Pediatrics and Adolescent Medicine · doi:10.1001/jamapediatrics.2019.6096 · Cited by 60
Yeo, I., Baek, S., Kim, J. H., Elshakh, H., Voronina, A., Lou, M. S., Vapnik, J., Kaler, R., Dai, X., & Goldbarg, S. H. (2021) · Journal of Internal Medicine · doi:10.1111/joim.13241 · Cited by 65
Angriman, F., Rosella, L. C., Lawler, P. R., Ko, D. T., Wunsch, H., & Scales, D. C. (2022) · Intensive Care Medicine · doi:10.1007/s00134-022-06634-z · Cited by 68
“10) [32, 36]; and (b) calculated the E-value in the primary analysis for both the point estimate and lower bound of the 95% confidence interval [44].”
BackgroundPropensity score methods for observational studies with clustered data: A review
Chang, T., & Stuart, E. A. (2022) · Statistics in Medicine · doi:10.1002/sim.9437 · Cited by 79
Wei, Y., Yan, V. K. C., Kang, W. C. M., Wong, I. C. K., Castle, D. J., Gao, L., Chui, C. S. L., Man, K. K. C., Hayes, J., Chang, W. C., et al. (2022) · JAMA Network Open · doi:10.1001/jamanetworkopen.2022.24163 · Cited by 66
Dominici, F., Zanobetti, A., Schwartz, J., Braun, D., Sabath, B. M., & Wu, X. (2022) · PubMed · Cited by 68
Petridou, E. T., Georgakis, M. K., Erdmann, F., Ma, X., Heck, J. E., Auvinen, A. P., Mueller, B. A., Spector, L. G., Roman, E., Metayer, C., et al. (2018) · European Journal of Epidemiology · doi:10.1007/s10654-018-0402-z · Cited by 70
“confounding, the E-value was estimated [30], based on maximally adjusted effect estimates for categories of”
Vargas‐Santos, A. B., Neogi, T., Pinheiro, G. D. R. C., Kapetanovic, M. C., & Turkiewicz, A. (2019) · Arthritis & Rheumatology · doi:10.1002/art.41008 · Cited by 60
“Lastly, we calculated Evalues to assess the potential impact of unmeasured confounding (28).”
MethodHormone replacement therapy and asthma onset in menopausal women: National cohort study
Shah, S. A., Tibble, H., Pillinger, R., McLean, S., Ryan, D. P., Critchley, H., Price, D. B., Hawrylowicz, C. M., Simpson, C. R., Soyiri, I. N., et al. (2020) · Journal of Allergy and Clinical Immunology · doi:10.1016/j.jaci.2020.11.024 · Cited by 63
Wilson, J., Mills, K. L., Freeman, T. P., Sunderland, M., Visontay, R., & Marel, C. (2021) · Addiction · doi:10.1111/add.15581 · Cited by 61
Nakamura, J. S., Delaney, S., Diener, E., VanderWeele, T. J., & Kim, E. S. (2021) · Quality of Life Research · doi:10.1007/s11136-021-02977-0 · Cited by 59
“E values allow us to evaluate the robustness of our results to unmeasured confounding by assessing the minimum strength that unmeasured confounding must have on the risk ratio scale (with both the exposure and the outcome) to entirely explain away the association between the exposure and outcome [32].”
BackgroundInfluentialSelf-citationLangmann, F., Ibsen, D. B., Tjønneland, A. M., Olsen, A., Overvad, K., & Dahm, C. C. (2023) · European Journal of Nutrition · doi:10.1007/s00394-023-03090-3 · Cited by 67
“Lastly, to estimate the minimum strength of association that an unmeasured confounder would need to have to explain away the observed associations, conditioned on measured covariates, E-values were calculated [34].”
BackgroundBody Mass Index, Adverse Pregnancy Outcomes, and Cardiovascular Disease Risk
Khan, S. S., Petito, L. C., Huang, X., Harrington, K. A., McNeil, R. B., Bello, N. A., Merz, C. N. B., Miller, E. C., Ravi, R., Scifres, C., et al. (2023) · Circulation Research · doi:10.1161/circresaha.123.322762 · Cited by 64
Tea consumption and attenuation of biological aging: a longitudinal analysis from two cohort studies
Xiang, Y., Xu, H., Chen, H., Tang, D., Huang, Z., Zhang, Y., Wang, Z., Wang, Z., Yangla, Han, M., et al. (2023) · The Lancet Regional Health - Western Pacific · doi:10.1016/j.lanwpc.2023.100955 · Cited by 87
Baumeister, S. E., Leitzmann, M. F., Linseisen, J., & Schlesinger, S. (2019) · JNCI Journal of the National Cancer Institute · doi:10.1093/jnci/djz111 · Cited by 63
“This approach to sensitivity analysis is a meta-analytic extension of the E-Value, a popular metric that quantifies the minimum strength of association that an unmeasured confounder would need to have with the exposure and the outcome on the relative risk scale to fully account for an observed exposure-outcome associa…”
Muraca, G. M., Liu, S., Sabr, Y., Lisonkova, S., Skoll, A., Brant, R., Cundiff, G. W., Stephansson, O., Razaz, N., & Joseph, K. S. (2019) · Canadian Medical Association Journal · doi:10.1503/cmaj.190366 · Cited by 59
NTR, Doering, S., Lichtenstein, P., Gillberg, C., Middeldorp, C. M., Bartels, M., Kuja‐Halkola, R., & Lundström, S. (2019) · BMC Psychiatry · doi:10.1186/s12888-019-2349-3 · Cited by 69
Shahinfar, H., Jayedi, A., Khan, T. A., & Shab‐Bidar, S. (2021) · Nutrition Metabolism and Cardiovascular Diseases · doi:10.1016/j.numecd.2021.05.014 · Cited by 61
Physical Activity Trajectories and Functional Recovery After Acute Stroke Among Adults in Sweden
Buvarp, D., Viktorisson, A., Axelsson, F., Lehto, E., Lindgren, L., Lundström, E., & Sunnerhagen, K. S. (2023) · JAMA Network Open · doi:10.1001/jamanetworkopen.2023.10919 · Cited by 75
Clinical Knowledge from Observational Studies. Everything You Wanted to Know but Were Afraid to Ask
Gershon, A. S., Jafarzadeh, S. R., Wilson, K. C., & Walkey, A. J. (2018) · American Journal of Respiratory and Critical Care Medicine · doi:10.1164/rccm.201801-0118pp · Cited by 58
The effect of hospital acuity on severe maternal morbidity in high-risk patients
Clapp, M. A., James, K. E., & Kaimal, A. J. (2018) · American Journal of Obstetrics and Gynecology · doi:10.1016/j.ajog.2018.04.015 · Cited by 58
Pollmann, C. T., Dahl, F. A., Røtterud, J. H., Gjertsen, J., & Årøen, A. (2020) · Acta Orthopaedica · doi:10.1080/17453674.2020.1717841 · Cited by 58
“An unobserved confounder that is associated with both early deep SSI and 90-day mortality by an RR of 2.6 each could move the lower bound of the CI to 1 (VanderWeele and Ding 2017).”
BackgroundInfluentialMaraolo, A. E., Giaccone, A., Gentile, I., Saracino, A., & Bavaro, D. F. (2021) · Antibiotics · doi:10.3390/antibiotics10081014 · Cited by 63
“Moreover, for quantitative bias analyses to assess the robustness of the results, the E-value was computed, that was defined as the minimum strength of association that an unmeasured confounder would need to have with both the treatment and the outcome to fully explain away a specific association; in this case, with t…”
MethodFernando, S. M., Scott, M., Talarico, R., Fan, E., McIsaac, D. I., Sood, M. M., Myran, D. T., Herridge, M. S., Needham, D. M., Hodgson, C. L., et al. (2022) · JAMA · doi:10.1001/jama.2022.17714 · Cited by 56
Zou, Y., Lu, S., Li, D., Huang, X., Wang, C., Xie, G., Duan, L., & Yang, H. (2024) · Cardiovascular Diabetology · doi:10.1186/s12933-024-02449-y · Cited by 65
“Thirdly, considering the potential impact of unmeasured confounders, we calculated the minimum E-value needed to quantify the effect of potential confounders on the results based on the final model [31].”
MethodTakada, S., Nyakato, V. N., Nishi, A., O’Malley, A. J., Kakuhikire, B., Perkins, J. M., Bangsberg, D. R., Christakis, N. A., & Tsai, A. C. (2019) · Social Science & Medicine · doi:10.1016/j.socscimed.2019.05.012 · Cited by 65
Kempker, R. R., Mikiashvili, L., Zhao, Y., Benkeser, D. C., Barbakadze, K., Bablishvili, N., Avaliani, Z., Peloquin, C. A., Blumberg, H. M., & Kipiani, M. (2019) · Clinical Infectious Diseases · doi:10.1093/cid/ciz1107 · Cited by 57
“Additionally, in performing a sensitivity analysis, we found E-values that indicate a moderate to strong unknown confounder would be needed to negate our findings.”
MethodInfluentialComparative Effectiveness of Initial Treatment for Infantile Spasms in a Contemporary US Cohort
Grinspan, Z. M., Knupp, K. G., Patel, A. D., Yozawitz, E. G., Wusthoff, C. J., Wirrell, E. C., Valencia, I., Singhal, N. S., Nordli, D. R., Mytinger, J. R., et al. (2021) · Neurology · doi:10.1212/wnl.0000000000012511 · Cited by 58
“Unmeasured Confounding To estimate the amount of unmeasured confounding required to explain away any significant effects, we calculate the E-value.(29) The E-value is the minimum association of an unmeasured set of confounders with the treatment and the outcome required to explain away the finding.”
BackgroundLamichhane, D. K., Jung, D.-Y., Shin, Y., Lee, K., Lee, S., Ahn, K., Kim, K. W., Shin, Y. H., Suh, D. I., Hong, S., et al. (2021) · International Journal of Hygiene and Environmental Health · doi:10.1016/j.ijheh.2021.113823 · Cited by 63
Invasive Hemodynamic Monitoring in Cardiogenic Shock Is Associated With Lower In‐Hospital Mortality
Osman, M., Syed, M., Patel, B. D., Munir, M. B., Kheiri, B., Caccamo, M. A., Sokos, G. G., Balla, S., Basir, M. B., Kapur, N. K., et al. (2021) · Journal of the American Heart Association · doi:10.1161/jaha.121.021808 · Cited by 56
Reitz, K. M., Althouse, A. D., Meyer, J., Arya, S., Goodney, P. P., Shireman, P. K., Hall, D. E., & Tzeng, E. (2021) · JAMA Cardiology · doi:10.1001/jamacardio.2021.3979 · Cited by 58
Gazit, S., Shlezinger, R., Perez, G., Lotan, R., Peretz, A., Ben‐Tov, A., Herzel, E., Alapi, H., Cohen, D., Muhsen, K., et al. (2022) · Annals of Internal Medicine · doi:10.7326/m21-4130 · Cited by 58
“The E-value is defined as the minimum strength of association, on the risk ratio scale, that an unmeasured confounder would need to have with both the exposure and outcome to fully explain away a specific exposure–outcome association, conditional on the measured covariates (40).”
BackgroundUnderstanding how health interventions or exposures produce their effects using mediation analysis
Cashin, A. G., McAuley, J. H., VanderWeele, T. J., & Lee, H. (2023) · BMJ · doi:10.1136/bmj-2022-071757 · Cited by 62
Self-citationGatto, N. M., Reynolds, R. F., & Campbell, U. B. (2019) · Clinical Pharmacology & Therapeutics · doi:10.1002/cpt.1480 · Cited by 56
Walley, A., Lodi, S., Li, Y., Bernson, D., Babakhanlou-Chase, H., Land, T., & Larochelle, M. R. (2020) · Addiction · doi:10.1111/add.14964 · Cited by 48
Zhan, M., Doerfler, R. M., Xie, D., Chen, J., Chen, H., Diamantidis, C. J., Rahman, M., Ricardo, A. C., Sondheimer, J., Strauss, L., et al. (2020) · American Journal of Kidney Diseases · doi:10.1053/j.ajkd.2019.12.010 · Cited by 57
Porcher, R., Desguerre, I., Amthor, H., Chabrol, B., Audic, F., Rivier, F., Isapof, A., Tiffreau, V., Salort‐Campana, E., Leturcq, F., et al. (2021) · European Heart Journal · doi:10.1093/eurheartj/ehab054 · Cited by 60
Anmella, G., Fico, G., Lotfaliany, M., Hidalgo‐Mazzei, D., Soto-Angona, Ó., Giménez‐Palomo, A., Amoretti, S., Murru, A., Raduà, J., Solanes, A., et al. (2021) · Neuroscience & Biobehavioral Reviews · doi:10.1016/j.neubiorev.2021.03.034 · Cited by 60
Cowden, R. G., Davis, E. B., Counted, V., Chen, Y., Rueger, S. Y., VanderWeele, T. J., Lemke, A. W., Glowiak, K. J., & Worthington, E. L. (2021) · Wellbeing Space and Society · doi:10.1016/j.wss.2021.100048 · Cited by 61
Self-citationRisk of Cancer in Inflammatory Bowel Diseases: Umbrella Review and Reanalysis of Meta-analyses
Piovani, D., Hassan, C., Repici, A., Rimassa, L., Carlo‐Stella, C., Nikolopoulos, G. K., Ríboli, E., & Bonovas, S. (2022) · Gastroenterology · doi:10.1053/j.gastro.2022.05.038 · Cited by 61
Shehabi, Y., Neto, A. S., Bellomo, R., Howe, B. D., Arabi, Y. M., Bailey, M., Bass, F. E., Kadiman, S., McArthur, C. J., Reade, M. C., et al. (2022) · American Journal of Respiratory and Critical Care Medicine · doi:10.1164/rccm.202206-1208oc · Cited by 61
Lawal, O. D., Aronow, H. D., Shobayo, F. O., Hume, A. L., Taveira, T. H., Matson, K. L., Zhang, Y., & Wen, X. (2023) · Circulation · doi:10.1161/circulationaha.122.060687 · Cited by 59
Raffetti, E., Donato, F., Speziani, F., Scarcella, C., Gaia, A., & Magoni, M. (2018) · Environment International · doi:10.1016/j.envint.2018.08.022 · Cited by 55
Borowczyk, K., Piechocka, J., Głowacki, R., Dhar, I., Midttun, Ø., Tell, G. S., Ueland, P. M., Nygard, O. K., & Jakubowski, H. (2018) · Journal of Internal Medicine · doi:10.1111/joim.12834 · Cited by 58
Roberts, A. L., Huang, T., Koenen, K. C., Kim, Y., Kubzansky, L. D., & Tworoger, S. S. (2019) · Cancer Research · doi:10.1158/0008-5472.can-19-1222 · Cited by 65
“In E-value analyses, we calculated that an unmeasured confounder, if equally associated with PTSD and ovarian cancer, would have to be associated at HR¼ 3.15 to fully account for the association of high PTSD symptomswith ovarian cancer in the fully adjusted model (33).”
BackgroundMethodInfluentialThe clustering of risk behaviours in adolescence and health consequences in middle age
Akasaki, M., Ploubidis, G. B., Dodgeon, B., & Bonell, C. P. (2019) · Journal of Adolescence · doi:10.1016/j.adolescence.2019.11.003 · Cited by 74
Wallach, J. D., Serghiou, S., Chu, L., Egilman, A. C., Vasiliou, V., Ross, J. S., & Ioannidis, J. P. A. (2020) · BMC Medical Research Methodology · doi:10.1186/s12874-020-0914-6 · Cited by 57
Lorenzo, S. D., Tovoli, F., Mazzotta, A. D., Vasuri, F., Edeline, J., Malvi, D., Boudjéma, K., Renzulli, M., Jeddou, H., D’Errico, A., et al. (2020) · Cancers · doi:10.3390/cancers12113182 · Cited by 57
“The sensitivity analysis was performed calculating the E-value and the limit of its 95% CI closest to the null [33,34].”
MethodResting heart rate and risk of type 2 diabetes: A prospective cohort study and meta-analysis
Lee, D. H., de Rezende, L. F. M., Hu, F. B., Jeon, J. Y., & Giovannucci, E. L. (2019) · Diabetes/Metabolism Research and Reviews · doi:10.1002/dmrr.3095 · Cited by 52
“64 in relation to both RHR and T2D in the multivariable‐adjusted models.(36,37) Interestingly, we found a stronger HR of T2D associated with RHR among those with normal weight or without hypertension.”
MethodMajmundar, M., Doshi, R. P., Kumar, A., Johnston, D., Brockett, J., Kanaa'N, A., Lahorra, J. L., Svensson, L. S., Krishnaswamy, A., Reed, G. R., et al. (2022) · EuroIntervention · doi:10.4244/eij-d-21-00472 · Cited by 56
“To evaluate the robustness of our findings, we conducted a falsifi-cation endpoint and an “E-value” analysis for 30-day and 6-month readmission and in-hospital mortality 18 .”
Extreme heat and its association with social disparities in the risk of spontaneous preterm birth
Cushing, L. J., Morello-Frosch, R. A., & Hubbard, A. (2021) · Paediatric and Perinatal Epidemiology · doi:10.1111/ppe.12834 · Cited by 57
Orlich, M. J., Sabaté, J., Mashchak, A., Fresán, U., Jaceldo-Siegl, K., Miles, F., & Fraser, G. E. (2022) · The American Journal of Clinical Nutrition · doi:10.1093/ajcn/nqac043 · Cited by 54
“34 based on the confidence interval) (28, 29).”
Jain, S., Murphy, T. E., O’Leary, J. R., Leo-Summers, L. S., & Ferrante, L. E. (2022) · Annals of Internal Medicine · doi:10.7326/m21-3086 · Cited by 57
“We additionally assessed for the robustness of our estimates to unmeasured confounding by calculating the E-value for outcomes with positive associations with dual eligibility (47).”
MethodSchuijt, M. T. U., Hol, L., Nijbroek, S. G. L. H., Ahuja, S., van Meenen, D. M. P., Mazzinari, G., Hemmes, S. N. T., Bluth, T., Ball, L., de Abreu, M. G., et al. (2022) · EClinicalMedicine · doi:10.1016/j.eclinm.2022.101397 · Cited by 52
Engström, A., Wintzell, V., Melbye, M., Svanström, H., Eliasson, B., Gudbjörnsdottir, S., Hveem, K., Jonasson, C., Hviid, A., Ueda, P., et al. (2024) · Hepatology · doi:10.1097/hep.0000000000000712 · Cited by 54
“[24] The study was approved by the Regional Ethics Committee in Stockholm, Sweden, and the Regional Committee for Medical and Health Research Ethics, Norway.”
MethodBiałowolski, P., Węziak‐Białowolska, D., & VanderWeele, T. J. (2019) · International Journal of Public Health · doi:10.1007/s00038-019-01214-3 · Cited by 65
“An outcomewide approach was applied, in which multiple outcomes were considered simultaneously for a single exposure (VanderWeele 2017).”
BackgroundMethodSelf-citationChar, S., Fried, J., Melehy, A., Mehta, S., Ning, Y., Kurlansky, P. A., & Takeda, K. (2021) · Journal of Thoracic and Cardiovascular Surgery · doi:10.1016/j.jtcvs.2021.06.024 · Cited by 54
Renzi, M., Forastiere, F., Schwartz, J. D., Davoli, M., Michelozzi, P., & Stafoggia, M. (2019) · Environmental Health Perspectives · doi:10.1289/ehp3759 · Cited by 53
“Tocritically evaluate our fi ndings, we computed the E-value proposed by VanderWeele and Ding in 2017 (VanderWeele and Ding 2017) to evaluate the e ff ect of potential unmeasured confounding.”
Iob, E., Baldwin, J. R., Plomin, R. J., & Steptoe, A. (2021) · Translational Psychiatry · doi:10.1038/s41398-021-01538-w · Cited by 66
“Lastly, we calculated Evalues for all statistically significant associations found in the most restrictive models of the main imputed data analysis [57].”
MethodAmbient PM2.5, ozone and mortality in Chinese older adults: A nationwide cohort analysis (2005–2018)
Zhang, Y., Yin, Z., Li, S., Zhang, J. J., Sun, Z., Liu, K., Shirai, K., Hu, K., Qiu, C., Liu, X., et al. (2023) · Journal of Hazardous Materials · doi:10.1016/j.jhazmat.2023.131539 · Cited by 56
Lophatananon, A., Carr, M., McMillan, B., Dobson, C. B., Itzhaki, R. F., Parisi, R., Ashcroft, D. M., & Muir, K. R. (2023) · BMC Public Health · doi:10.1186/s12889-023-16768-4 · Cited by 58
“The higher the E-value the stronger the confounder associations would have to be to explain away the effect [26].”
BackgroundLow-intensity fires mitigate the risk of high-intensity wildfires in California’s forests
Wu, X., Sverdrup, E., Mastrandrea, M. D., Wara, M. W., & Wager, S. (2023) · Science Advances · doi:10.1126/sciadv.adi4123 · Cited by 77
Outcomes After Initiation of Medications for Alcohol Use Disorder at Hospital Discharge
Bernstein, E. Y., Baggett, T. P., Trivedi, S., Herzig, S. J., & Anderson, T. S. (2024) · JAMA Network Open · doi:10.1001/jamanetworkopen.2024.3387 · Cited by 62
High-Deductible Insurance and Delay in Care for the Macrovascular Complications of Diabetes
Wharam, J. F., Lu, C. Y., Zhang, F., Callahan, M., Xu, X. P., Wallace, J., Soumerai, S. B., Ross‐Degnan, D., & Newhouse, J. P. (2018) · Annals of Internal Medicine · doi:10.7326/m17-3365 · Cited by 58
“E-value calculations indicated that unmeasured confounders with hazard ratios of approximately 1.3 to 1.5 could make our primary findings nonsignificant, but this was after matching and adjustment had controlled for some confounding.”
InfluentialRacial/ethnic disparities in the risk of intracerebral hemorrhage recurrence
Leasure, A. C., King, Z. A., Torres‐Lopez, V., Murthy, S. B., Kamel, H., Shoamanesh, A., Salman, R. A., Rosand, J. M., Ziai, W., Hanley, D. F., et al. (2019) · Neurology · doi:10.1212/wnl.0000000000008737 · Cited by 61
“E-values were calculated for the observed hazard ratios (HRs) and confidence interval (CI) bound closest to the null from multivariable analysis for race/ethnicity and insurance payer to assess the potential contribution of unmeasured confounding.(28)”
MethodComparing Veterans Affairs and Private Sector Perioperative Outcomes After Noncardiac Surgery
George, E., Massarweh, N. N., Youk, A. O., Reitz, K. M., Shinall, M. C., Chen, R., Trickey, A. W., Varley, P. R., Johanning, J. M., Shireman, P. K., et al. (2021) · JAMA Surgery · doi:10.1001/jamasurg.2021.6488 · Cited by 53
Correcting Misinterpretations of the E-Value
VanderWeele, T. J., Mathur, M. B., & Ding, P. (2019) · Annals of Internal Medicine · doi:10.7326/m18-3112 · Cited by 53
Self-citationHospital distance, socioeconomic status, and timely treatment of ischemic stroke
Ader, J., Wu, J., Fonarow, G. C., Smith, E. E., Shah, S. D., Xian, Y., Bhatt, D. L., Schwamm, L. H., Reeves, M. J., Matsouaka, R., et al. (2019) · Neurology · doi:10.1212/wnl.0000000000007963 · Cited by 52
“5.(19) Variance explained by the logistic models was Figure Inclusion/exclusion criteria”
BackgroundKhanna, A. K., Shaw, A., Stapelfeldt, W. H., Boero, I. J., Chen, Q., Stevens, M., Gregory, A. B., & Smischney, N. J. (2021) · Anesthesia & Analgesia · doi:10.1213/ane.0000000000005374 · Cited by 54
Body Mass Index in 1.9 Million Adolescents and Stroke in Young Adulthood
Bardugo, A., Fishman, B., Libruder, C., Tanné, D., Ram, A., Hershkovitz, Y., Zucker, I., Furer, A., Gilon, R., Chodick, G., et al. (2021) · Stroke · doi:10.1161/strokeaha.120.033595 · Cited by 64
Adhikari, B., Delgado‐Ron, J. A., van den Bosch, M. A., Dummer, T., Hong, A., Sandhu, J., Demlow, E., Hu, Y., & Frank, L. D. (2021) · International Journal of Hygiene and Environmental Health · doi:10.1016/j.ijheh.2021.113820 · Cited by 54
Limiting Dynamic Driving Pressure in Patients Requiring Mechanical Ventilation*
Urner, M., Jüni, P., Rojas‐Saunero, L. P., Hansen, B. E., Brochard, L. J., Ferguson, N. D., & Fan, E. (2023) · Critical Care Medicine · doi:10.1097/ccm.0000000000005844 · Cited by 54
“Furthermore, the results were robust in several sensitivity analyses, and we demonstrated that substantial, uncontrolled confounding would be required to explain away our findings (13, 28).”
ResultAggarwal, C., Marmarelis, M. E., Hwang, W., Scholes, D. G., McWilliams, T. L., Singh, A. P., Sun, L., Kosteva, J. A., Costello, M. R., Cohen, R. B., et al. (2023) · JCO Precision Oncology · doi:10.1200/po.23.00191 · Cited by 72
Levy, B. L., Owens, A. M. D., & Sampson, R. J. (2019) · Sociology of Education · doi:10.1177/0038040719850146 · Cited by 59
Coronavirus stigmatization and psychological distress among Asians in the United States
Pan, S. W., Shen, G. C., Liu, C., & Hsi, J. H. (2020) · Ethnicity and Health · doi:10.1080/13557858.2020.1849570 · Cited by 80
Semaglutide or tirzepatide and optic nerve and visual pathway disorders in type 2 diabetes
Wang, L., Volkow, N. D., Kaelber, D. C., & Xu, R. (2025) · JAMA Network Open · doi:10.1001/jamanetworkopen.2025.26327 · Cited by 51
Bramante, C. T., Buse, J. B., Tamaritz, L., Palacio, A., Cohen, K., Vojta, D. D., Liebovitz, D., Mitchell, N. S., Nicklas, J. M., Lingvay, I., et al. (2021) · Journal of Medical Virology · doi:10.1002/jmv.26873 · Cited by 51
“The E‐values indicate that an unmeasured confounder would need a RR magnitude of association with the treatment and outcome, above and beyond the measured confounders, that is greater than or equal to the E‐value.(28) Statistical analyses were performed using Stata MP, version 16 (StataCorp).”
BackgroundMethodInfluentialAssociation between Troponin I Levels during Sepsis and Postsepsis Cardiovascular Complications
Garcia, M. A., Rucci, J. M., Thai, K. K., Lu, Y., Kipnis, P., Go, A. S., Desai, M., Bosch, N. A., Martinez, A., Clancy, H., et al. (2021) · American Journal of Respiratory and Critical Care Medicine · doi:10.1164/rccm.202103-0613oc · Cited by 56
Veronesi, G., Matteis, S. D., Calori, G., Pepe, N., & Ferrario, M. (2022) · Occupational and Environmental Medicine · doi:10.1136/oemed-2021-107833 · Cited by 49
Air quality improvement and cognitive function benefit: Insight from clean air action in China
Hu, X., Nie, Z., Ou, Y., Qian, Z. M., McMillin, S. E., Aaron, H. E., Zhou, Y., Dong, G., & Dong, H. (2022) · Environmental Research · doi:10.1016/j.envres.2022.114200 · Cited by 58
Sensitivity Analyses for Unmeasured Confounders
McGowan, L. D. (2022) · Current Epidemiology Reports · doi:10.1007/s40471-022-00308-6 · Cited by 56
Abe, N., Ide, K., Watanabe, R., Hayashi, T., Iizuka, G., & Kondo, K. (2023) · Journal of the American Geriatrics Society · doi:10.1111/jgs.18269 · Cited by 51
“First, to evaluate the robustness of the estimated associations with unmeasured confounders, we calculated E-values for each exposure-outcome association.(31) E-values quantify the minimum strength required for the association of an unmeasured confounder with both the exposure and outcome, above and beyond the adjuste…”
Method
Metadata
- Authors
- VanderWeele, T. J., & Ding, P.
- Affiliations
- Harvard University (US)
- Venue
- Annals of Internal Medicine
- Publisher
- American College of Physicians
- Published
- 2017-08-15
- Volume
- 167
- Issue
- 4
- Pages
- 268-274
- ISSN
- 0003-4819 (ISSN-L)
- 1539-3704
- OpenAlex
- W2735301415
- Cited by
- 6,350
- References
- 59
- Citations by year
- 2026: 1516 · 2025: 1020 · 2024: 860 · 2023: 736 · 2022: 716 · 2021: 583 · 2020: 498 · 2019: 290 · 2018: 113 · 2017: 15
- FWCI
- 174.58
- Type
- journal article
- Language
- en
- Open access
- green
- nrs.harvard.edu
- Licence
- cc-by
- www.acpjournals.org/journal/aim/text-and-data-mining (tdm)
- Locations
- Annals of Internal Medicine (publishedVersion)
- PubMed (publishedVersion)
- Digital Access to Scholarship at Harvard (DASH) (Harvard University) (submittedVersion, cc-by)
- Funders
- National Institute of Environmental Health Sciences (ES017876)
- Topics
- Physical Sciences › Mathematics › Statistics and Probability › Advanced Causal Inference Techniques
- Physical Sciences › Mathematics › Statistics and Probability › Statistical Methods in Epidemiology
- Social Sciences › Decision Sciences › Statistics, Probability and Uncertainty › Meta-analysis and systematic reviews
- Keywords
- E-value, unmeasured confounding, sensitivity analysis, causal inference, observational studies, relative risk
- MeSH terms
- Humans, Sensitivity and Specificity, Epidemiologic Research Design, Confounding Factors, Epidemiologic, Observational Studies as Topic
About these checks
Registry, retraction, Cites and statistics results are computed, not judged, with one exception: a printed reference that no index lists is read once by a model before it counts as a citation error. Claims are extracted by a model and kept only when their quote appears verbatim in the text; each cited source is then checked, with a model’s help, for whether it says what the claim relies on. Those verdicts can be wrong — read the claim’s quote and the cited source before relying on one.
Statistics and arithmetic are recomputed, not judged.
Confidence bands are shown only for fields calibrated on our annotated test set. None is calibrated yet, so no band is shown.
What counts as a claim ›How we measure confidence ›How we check this ›
Are you an author, or do you see a problem with this page? Request a review
Data sources
Bibliographic data: Semantic Scholar, OpenAlex, Crossref.
Contains information from the Semantic Scholar Academic Graph Datasets, made available under the ODC Attribution License (ODC-BY 1.0).
Semantic Scholar’s data is described in: Kinney, R., et al. (2023). The Semantic Scholar Open Data Platform. arXiv:2301.10140.
