

Sensitivity Analysis in Observational Research: Introducing the E-Value
Open accessThe DOI matches its Crossref record; 58 of the 59 references it cites were found in a registry or an index.
Abstract
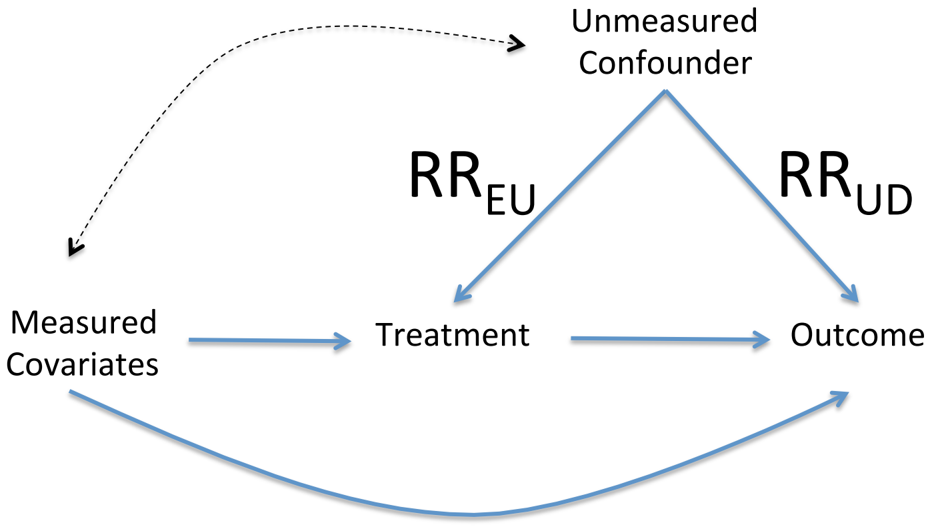
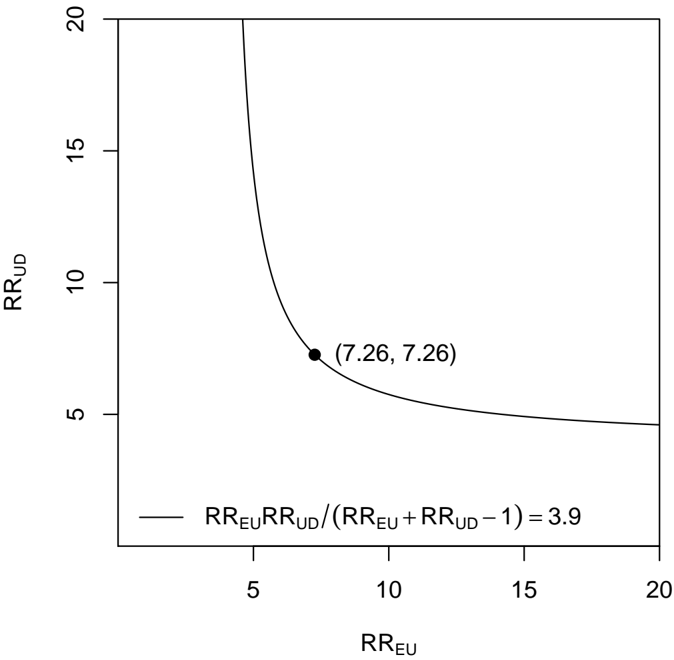
Sensitivity analysis is useful in assessing how robust an association is to potential unmeasured or uncontrolled confounding. This article introduces a new measure called the "E-value," which is related to the evidence for causality in observational studies that are potentially subject to confounding. The E-value is defined as the minimum strength of association, on the risk ratio scale, that an unmeasured confounder would need to have with both the treatment and the outcome to fully explain away a specific treatment-outcome association, conditional on the measured covariates. A large E-value implies that considerable unmeasured confounding would be needed to explain away an effect estimate. A small E-value implies little unmeasured confounding would be needed to explain away an effect estimate. The authors propose that in all observational studies intended to produce evidence for causality, the E-value be reported or some other sensitivity analysis be used. They suggest calculating the E-value for both the observed association estimate (after adjustments for measured confounders) and the limit of the confidence interval closest to the null. If this were to become standard practice, the ability of the scientific community to assess evidence from observational studies would improve considerably, and ultimately, science would be strengthened.
Overview
The claims and statistics of this paper haven’t been checked yet.
Free: it reads the open-access text and checks the first 5 claims that cite a source we can check. Create a free account to check every claim.
Integrity signals
Registry
Cites
Statistics
Figures
Verification
Claims the paper makes
The claims and statistics of this paper haven’t been checked yet.
Free: it reads the open-access text and checks the first 5 claims that cite a source we can check. Create a free account to check every claim.
Claims other papers make about this one
Each is checked against this paper’s own text: does it say what the citing paper says it does?
The cited source says what the claim attributes to it.
In the citing paper
“Quantitative bias analyses, such as the calculation of E-values to estimate the strength of unmeasured confounding required to explain away an observed association, provide useful context for the robustness of findings.64”
From Artificial Intelligence in Oncology: Practical Applications Across Clinical Care, Scholarship, and Translation. (2026) · cites this paper as [64]
The cited source says what the claim attributes to it.
In the citing paper
“We performed the sensitivity analysis using the E value [29] to evaluate the robustness of our findings to potential unmeasured confounding, with the calculation based on the observed odds ratio (OR) point estimate for rare outcome (<15%) or the square root of OR otherwise.”
The cited source says what the claim attributes to it.
In the citing paper
“To further assess the robustness of our findings to potential unmeasured confounding, we conducted an E-value analysis, a quantitative method for sensitivity analysis in observational research [31].”
From Acute Respiratory Tract Infection and Sudden Sensorineural Hearing Loss: A Multinational Cohort Study (2025) · cites this paper as [31]
In the citing paper
“We also computed E-values: indicators of how robust findings are to potential unmeasured confounding”
From Leading a meaningful life at older ages and its relationship with social engagement, prosperity, health, biology, and time use (2019) · cites this paper as [12]
Self-check
Percentages, sums and reported differences re-computed from the paper’s own numbers.
The self-check needs the paper’s full text.
Citations
Cites
Borenstein, M., Hedges, L. V., Higgins, J. P. T., & Rothstein, H. R. (2009) · doi:10.1002/9780470743386 · Cited by 14,225
The environment and disease: association or causation?
Hill, A. B. (2015) · Journal of the Royal Society of Medicine · doi:10.1177/0141076814562718 · Cited by 7,285
The Environment and Disease: Association or Causation?
Hill, A. B. (1965) · Proceedings of the Royal Society of Medicine · doi:10.1177/003591576505800503 · Cited by 6,974 · cited 1×
“Sensitivity analysis makes clear quantitatively why Bradford Hill's criterion of “strength of association” (12) is important in establishing that a given association is, in fact, causal.”
BackgroundThe ASA Statement on p -Values: Context, Process, and Purpose
Wasserstein, R. L., & Lazar, N. A. (2016) · The American Statistician · doi:10.1080/00031305.2016.1154108 · Cited by 6,306 · cited 2×
“While potentially subject to mis-use and misinterpretation (1,5-12), the p-value can be informative as a continuous measure of evidence as to whether an association is present.”
BackgroundCausal Inference for Statistics, Social, and Biomedical Sciences: An Introduction
Imbens, G. W., & Rubin, D. B. (2015) · doi:10.1017/cbo9781139025751 · Cited by 4,210
Statistical tests, P values, confidence intervals, and power: a guide to misinterpretations
Greenland, S., Senn, S. J., Rothman, K. J., Carlin, J. B., Poole, C., Goodman, S. N., & Altman, D. G. (2016) · European Journal of Epidemiology · doi:10.1007/s10654-016-0149-3 · Cited by 3,200
Explanation in Causal Inference: Methods for Mediation and Interaction
VanderWeele, T. J. (2015) · Cited by 2,217
Self-citationSmithson, M. (2000) · SAGE Publications Ltd eBooks · doi:10.4135/9781446218525 · Cited by 1,871
Fundamentals of Biostatistics.
Cornell, R. G., & Rosner, B. (1987) · Journal of the American Statistical Association · doi:10.2307/2289416 · Cited by 1,603
Breastfeeding and Maternal and Infant Health Outcomes In Developed Countries
(2007) · AAP Grand Rounds · doi:10.1542/gr.18-2-15 · Cited by 1,540 · cited 2×
“A study by the Agency for Healthcare Research and Quality (42) reported the association between breastfeeding and childhood leukemia as RR=0.”
MethodInfluential
Research works printed but not linked: 3
- Greenland S, 2011, Jurimetrics, 51, 11329
- Cornfield J, 1959, J Natl Cancer Inst, 22, 173
- Schlesselman JJ, 1978, Am J Epidemiol, 108, 3
Cited by
Items 1,001–1,031 of 1,031
Blair, A., Pan, S. Y., Subedi, R., Yang, F.-J., Aitken, N., & Steensma, C. (2022) · Canada Communicable Disease Report · doi:10.14745/ccdr.v48i01a05 · Cited by 27
“Higher e-values indicate that relatively strong confounding associations would be needed to completely explain away the observed exposure–outcome association (38).”
BackgroundInfluentialRisk for preeclampsia following exposure to PM2.5 during pregnancy
Daniel, S., Kloog, I., Factor-Litvak, P., Levy, A., Lunenfeld, E., & Kioumourtzoglou, M.-A. (2021) · Environment International · doi:10.1016/j.envint.2021.106636 · Cited by 26
Lai, H.-W., See, C. Y., Chen, J.-Y., & Wu, V.-C. (2024) · Cardiovascular Diabetology · doi:10.1186/s12933-024-02364-2 · Cited by 25
“We computed E-values using the methodology proposed by Vander Weele and Ding [25].”
MethodAlruwaili, A., King, J. A., Deighton, K., Kelly, B. M., Liao, Z., Innes, A., Henson, J., Yates, T., Johnson, W., Thivel, D., et al. (2024) · Addiction · doi:10.1111/add.16584 · Cited by 24
Cerebrovascular disease after placental abruption: A population-based prospective cohort study
Ananth, C. V., Hansen, A. V., Elkind, M. S. V., Williams, M. A., Rich-Edwards, J. W., & Nybo Andersen, A.-M. (2019) · Neurology · doi:10.1212/wnl.0000000000008122 · Cited by 23
“To assess whether unmeasured confounding may have affected the associations, we calculated the E-value.28 The E-value is defined as the minimum strength of association on the HR scale that an unmeasured confounder would need to have with both the exposure and the outcome, conditional on the measured covariates, to ful…”
Probing the digital exposome: associations of social media use patterns with youth mental health
Pagliaccio, D., Tran, K. T., Visoki, E., DiDomenico, G. E., Auerbach, R. P., & Barzilay, R. (2024) · NPP—Digital Psychiatry and Neuroscience · doi:10.1038/s44277-024-00006-9 · Cited by 23
“Finally, to address unmeasured confounding, we conducted an E-value analysis [75] on our main Model-4.”
Influence of contraception class on incidence and severity of acne vulgaris
Barbieri, J. S., Mitra, N., Margolis, D. J., Harper, C. C., Mostaghimi, A., & Abuabara, K. (2020) · Obstetrics & Gynecology · doi:10.1097/aog.0000000000003880 · Cited by 22
Brew, B. K., Lundholm, C., Caffrey Osvald, E., Chambers, G., Öberg, S., Fang, F., & Almqvist, C. (2022) · American Journal of Epidemiology · doi:10.1093/aje/kwab236 · Cited by 19
“We also used a sensitivity analysis (E-value) to assess the robustness of our findings to potential unmeasured confounding (30), showing that an unknown confounder has to have an influence on each bereavement experienced by G2 women and G3 asthma of at least HR = 1.57 ( 2-diagnoses asthma) or HR =…”
InfluentialWang, H., Li, F., Miao, M., Yu, Y., Ji, H., Liu, H., Huang, R., Obel, C., Zhang, J., & Li, J. (2020) · Human Reproduction · doi:10.1093/humrep/deaa035 · Cited by 19
Jin, Z., Li, J., Thackray, A. E., Shen, T., Deighton, K., King, J. A., & Stensel, D. J. (2025) · International Journal of Obesity · doi:10.1038/s41366-025-01726-4 · Cited by 20
Yang, J., Wang, T., Li, K., & Wāng, Y. (2025) · Journal of Advanced Research · doi:10.1016/j.jare.2024.04.022 · Cited by 15
“In order to assess potential effects of unmeasured confounding factors, additional sensitivity analyses were possessed using E-values [48].”
Costello, J. M., Steurer, M. A., Baer, R. J., Witte, J. S., & Jelliffe‐Pawlowski, L. L. (2022) · Paediatric and Perinatal Epidemiology · doi:10.1111/ppe.12820 · Cited by 14
Walmsley, R., Chan, S., Smith-Byrne, K., Ramakrishnan, R., Woodward, M., Rahimi, K., Dwyer, T., Bennett, D., & Doherty, A. (2020) · doi:10.1101/2020.11.10.20227769 · Cited by 12
“24,25 Role of the funding source The funding organisations had no role in design or conduct of the study; collection, management, analysis, and interpretation of the data; preparation, review, or approval of the manuscript; or decision to submit the manuscript for publication.”
BackgroundGastric acid suppressants and cognitive decline in people with or without cognitive impairment
Wu, C., Xiong, L. Y., Ouk, M., Rabin, J. S., Herrmann, N., Lanctôt, K. L., Kapral, M. K., Law, M., Cogo‐Moreira, H., Edwards, J. D., et al. (2022) · Alzheimer's & Dementia: Translational Research & Clinical Interventions · doi:10.1002/trc2.12243 · Cited by 13
Antibiotic De-escalation in adults hospitalized for community-onset Sepsis
Gupta, A. B., Heath, M., Walzl, E., Ratz, D., Munroe, E., Vaughn, V. M., Horowitz, J. K., Czilok, T., Petty, L. A., Gandhi, T. N., et al. (2026) · JAMA Internal Medicine · doi:10.1001/jamainternmed.2025.6919 · Cited by 14
Shenassa, E. D., Rogers, M. L., & Buka, S. L. (2023) · Psychological Medicine · doi:10.1017/s0033291721001392 · Cited by 13
“An E value is the minimum magnitude of an unmeasured confounder that would render an observed association null (VanderWeele & Ding, 2017).”
BackgroundAssociations of weight-adjusted-waist index and depression with secondary infertility
Sun, F., Liu, M., Hu, S., Xie, R., Chen, H., Sun, Z., & Bi, H. (2024) · Frontiers in Endocrinology · doi:10.3389/fendo.2024.1330206 · Cited by 13
“In sensitivity analysis, linear trend tests were conducted with WWI quartile groups as independent variables to evaluate its robustness (30).”
MethodBondø, P., Høye, A., Løchen, M., & Bramness, J. G. (2022) · Addiction · doi:10.1111/add.15950 · Cited by 11
“Additionally, we have not taken into further consideration the possibly unknown confounding in the significant associations we detected after adjustment for relevant covariates, which we could have solved by including Evalues in our analyses [40].”
MethodComparison of Hospital Outcomes for Patients Treated by Allopathic Versus Osteopathic Hospitalists
Miyawaki, A., Jena, A. B., Gross, N., & Tsugawa, Y. (2023) · Annals of Internal Medicine · doi:10.7326/m22-3723 · Cited by 10
“To address this possibility, we calculated E-values to formally examine how strongly unmeasured confounders would need to be associated with patient outcomes to obtain a null relationship between osteopathic versus allopathic training and patient outcomes (36).”
Stability of Do-Not-Resuscitate Orders in Hospitalized Adults: A Population-Based Cohort Study*
Mehta, A. B., Walkey, A. J., Curran-Everett, D., Matlock, D., & Douglas, I. S. (2021) · Critical Care Medicine · doi:10.1097/ccm.0000000000004726 · Cited by 10
Ward, R., Rauch, S. A. M., Axon, R. N., & Saenger, M. S. (2023) · Health Services Research · doi:10.1111/1475-6773.14062 · Cited by 9
E-Values for Mendelian Randomization
Swanson, S. A., & VanderWeele, T. J. (2020) · Epidemiology · doi:10.1097/ede.0000000000001164 · Cited by 9
Self-citationBezin, J., Mathieu, C., Faillie, J.-L., & Pariente, A. (2023) · Diabetes Care · doi:10.2337/dci23-0016 · Cited by 7
Tay, J. R. H., Nascimento, G. G., & Romandini, M. (2026) · Journal of Periodontal Research · doi:10.1111/jre.70096 · Cited by 7
Wang, L., Swayze, S., Bodner, K., Calzavara, A., Harrigan, S. P., Siddiqi, A., Baral, S. D., Austin, P. C., Smylie, J., Koh, M., et al. (2026) · American Journal of Epidemiology · doi:10.1093/aje/kwaf051 · Cited by 5
Weng, C.-H., Lin, J.-F., & Wang, J.-J. (2025) · Diagnostics · doi:10.3390/diagnostics15121462 · Cited by 2
“To further assess the robustness of our findings to potential unmeasured confounding, we conducted an E-value analysis, a quantitative method for sensitivity analysis in observational research [31].”
López-Cervantes, J. P., Bertelsen, R. J., Schlünssen, V., Holm, M., Malinovschi, A., Modig, L., Oudin, A., Callejas-González, F. J., Dharmage, S. C., Jogi, N. O., et al. (2026) · International Journal of Epidemiology · doi:10.1093/ije/dyag035 · Cited by 2
“Finally, we calculated E-values for the main associations [30] and conducted sensitivity analysis by using Bayesian penalization modelling with default priors to account for sparse data (categories with 10 cases) in the main model, reporting posterior medians for robustness [31, 32].”
Hundal, J., Veettil, A. A. V., Chung, C., & Hosseini, M. (2026) · American Society of Clinical Oncology Educational Book · doi:10.1200/edbk-26-517280 · Cited by 1
Hinton, C., de la Rosa Fernández-Pacheco, P. A., Caro Samada, C., Okuzono, S. S., Hill, B., de Gregorio Vicente, O., & Moller, F. (2025) · Journal of Moral Education · doi:10.1080/03057240.2025.2509821 · Cited by 1
“Lastly, we calculated E-values for all assessed associations to evaluate the minimum strength of association required for an unmeasured confounder to have with both the exposure and outcomes to fully explain away the associations found (VanderWeele & Ding, 2017).”
Yao, T.-C., Huang, Y.-W., Chang, S.-M., Tsai, S.-Y., Wu, A. C., & Tsai, H.-J. (2020) · Annals of Internal Medicine · doi:10.7326/m20-0432
Weng, K.-H., Chou, Y.-C., Kuo, Y.-T., Hsieh, T.-J., & Liu, C.-F. (2025) · JMIR formative research · doi:10.2196/76384
“We performed the sensitivity analysis using the E value [29] to evaluate the robustness of our findings to potential unmeasured confounding, with the calculation based on the observed odds ratio (OR) point estimate for rare outcome ( 15”
Metadata
- Authors
- VanderWeele, T. J., & Ding, P.
- Affiliations
- Harvard University (US)
- Venue
- Annals of Internal Medicine
- Publisher
- American College of Physicians
- Published
- 2017-08-15
- Volume
- 167
- Issue
- 4
- Pages
- 268-274
- ISSN
- 0003-4819 (ISSN-L)
- 1539-3704
- OpenAlex
- W2735301415
- Cited by
- 6,350
- References
- 59
- Citations by year
- 2026: 1516 · 2025: 1020 · 2024: 860 · 2023: 736 · 2022: 716 · 2021: 583 · 2020: 498 · 2019: 290 · 2018: 113 · 2017: 15
- FWCI
- 174.58
- Type
- journal article
- Language
- en
- Open access
- green
- nrs.harvard.edu
- Licence
- cc-by
- www.acpjournals.org/journal/aim/text-and-data-mining (tdm)
- Locations
- Annals of Internal Medicine (publishedVersion)
- PubMed (publishedVersion)
- Digital Access to Scholarship at Harvard (DASH) (Harvard University) (submittedVersion, cc-by)
- Funders
- National Institute of Environmental Health Sciences (ES017876)
- Topics
- Physical Sciences › Mathematics › Statistics and Probability › Advanced Causal Inference Techniques
- Physical Sciences › Mathematics › Statistics and Probability › Statistical Methods in Epidemiology
- Social Sciences › Decision Sciences › Statistics, Probability and Uncertainty › Meta-analysis and systematic reviews
- Keywords
- E-value, unmeasured confounding, sensitivity analysis, causal inference, observational studies, relative risk
- MeSH terms
- Humans, Sensitivity and Specificity, Epidemiologic Research Design, Confounding Factors, Epidemiologic, Observational Studies as Topic
About these checks
Registry, retraction, Cites and statistics results are computed, not judged, with one exception: a printed reference that no index lists is read once by a model before it counts as a citation error. Claims are extracted by a model and kept only when their quote appears verbatim in the text; each cited source is then checked, with a model’s help, for whether it says what the claim relies on. Those verdicts can be wrong — read the claim’s quote and the cited source before relying on one.
Statistics and arithmetic are recomputed, not judged.
Confidence bands are shown only for fields calibrated on our annotated test set. None is calibrated yet, so no band is shown.
What counts as a claim ›How we measure confidence ›How we check this ›
Are you an author, or do you see a problem with this page? Request a review
Data sources
Bibliographic data: Semantic Scholar, OpenAlex, Crossref.
Contains information from the Semantic Scholar Academic Graph Datasets, made available under the ODC Attribution License (ODC-BY 1.0).
Semantic Scholar’s data is described in: Kinney, R., et al. (2023). The Semantic Scholar Open Data Platform. arXiv:2301.10140.
