

The DOI matches its Crossref record; 73 of the 74 references it cites were found in a registry or an index, and 1 are not checked yet.
Neural evidence accumulation persists after choice to inform metacognitive judgments
Open accessAbstract
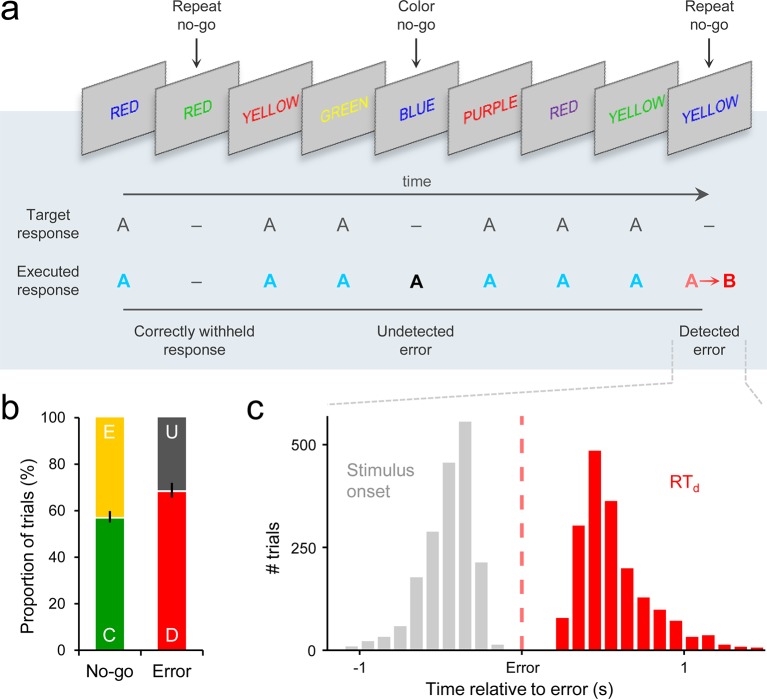
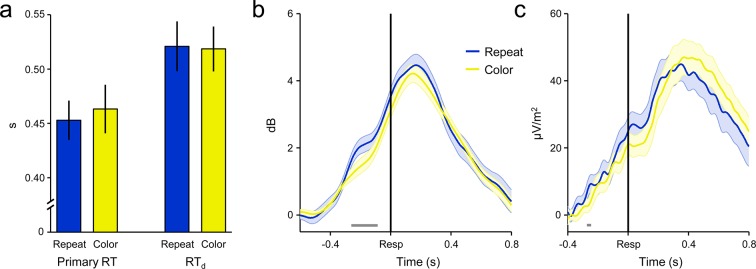
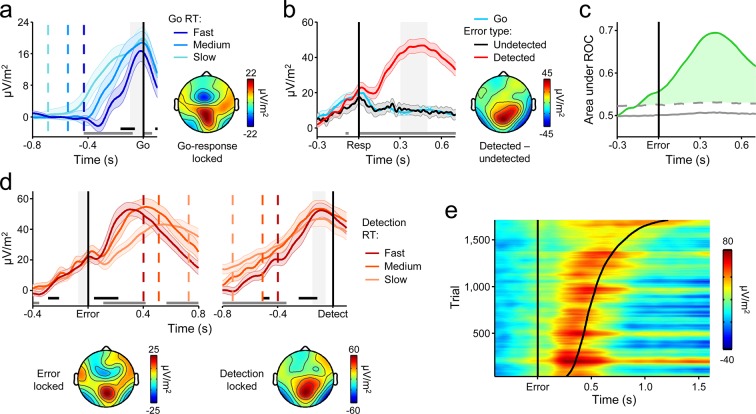
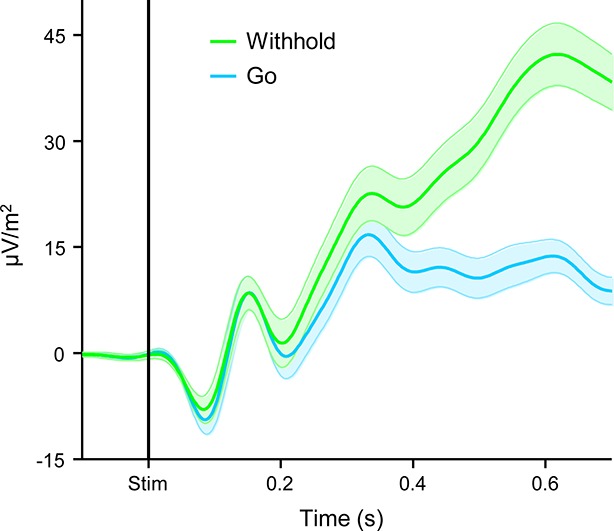
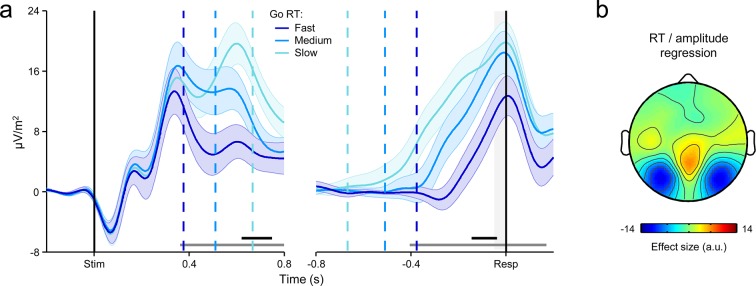
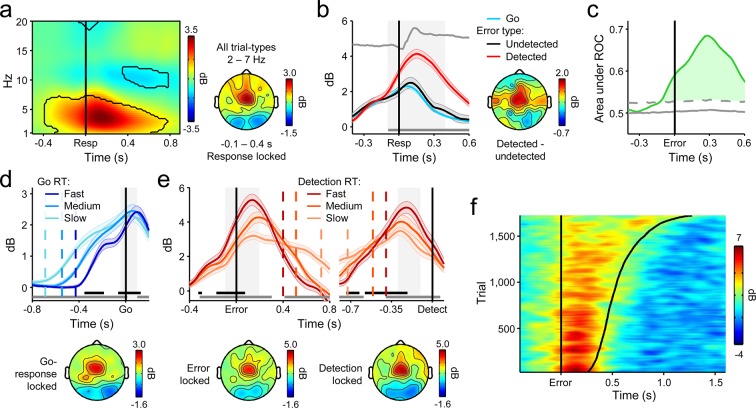
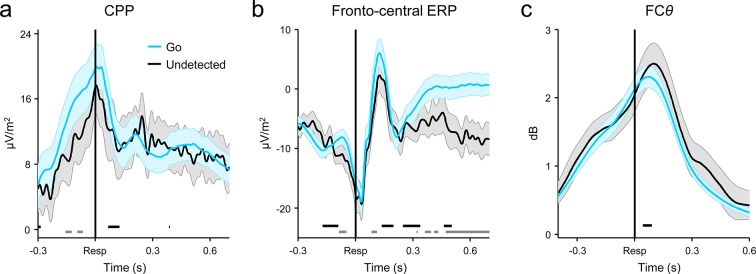
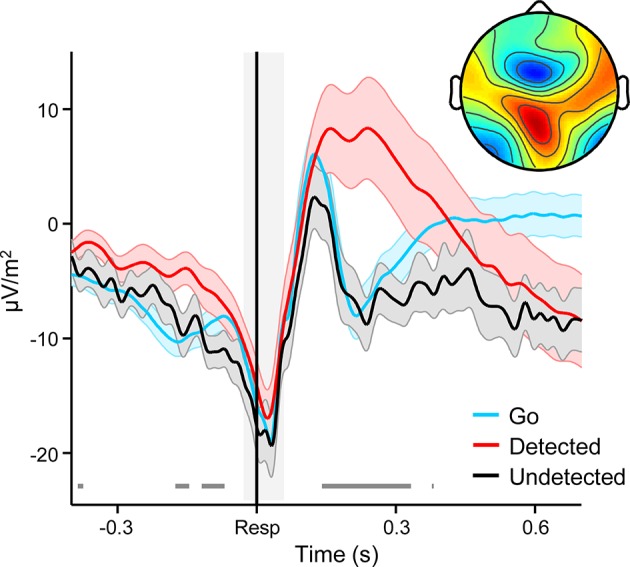
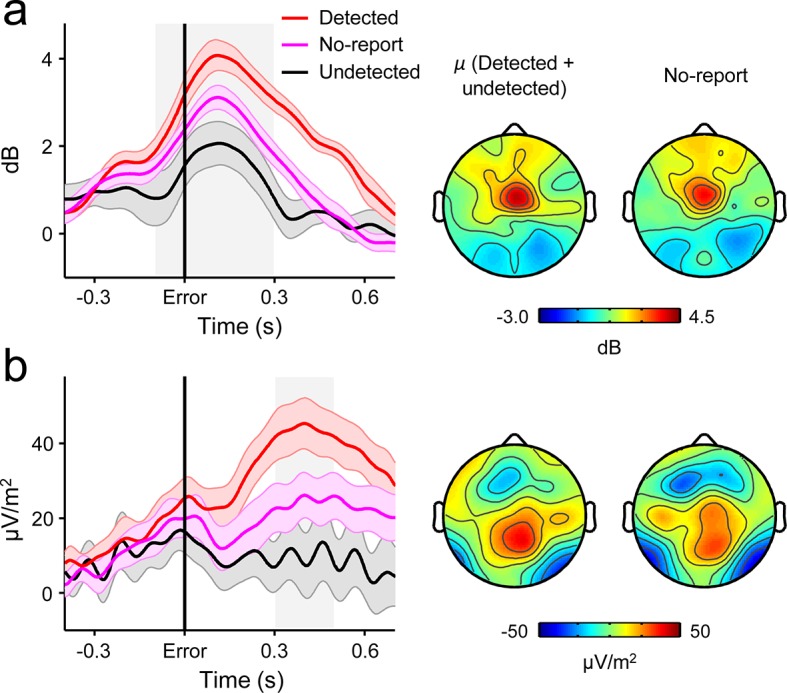
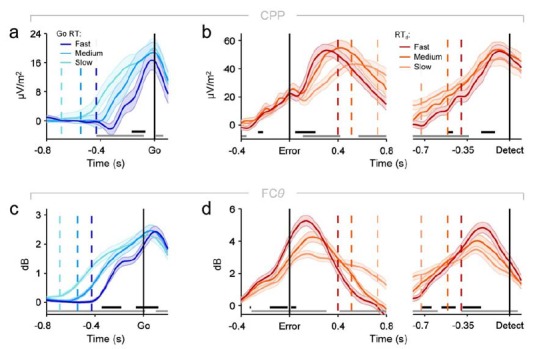
The ability to revise one’s certainty or confidence in a preceding choice is a critical feature of adaptive decision-making but the neural mechanisms underpinning this metacognitive process have yet to be characterized. In the present study, we demonstrate that the same build-to-threshold decision variable signal that triggers an initial choice continues to evolve after commitment, and determines the timing and accuracy of self-initiated error detection reports by selectively representing accumulated evidence that the preceding choice was incorrect. We also show that a peri-choice signal generated in medial frontal cortex provides a source of input to this post-decision accumulation process, indicating that metacognitive judgments are not solely based on the accumulation of feedforward sensory evidence. These findings impart novel insights into the generative mechanisms of metacognition.
Overview
The claims and statistics of this paper haven’t been checked yet.
Run the check — free, no account needed. It reads the open-access text and checks the sources it cites.
Integrity signals
Registry
Cites
Statistics
Figures
Verification
Claims the paper makes
The claims and statistics of this paper haven’t been checked yet.
Run the check — free, no account needed. It reads the open-access text and checks the sources it cites.
Claims other papers make about this one
Each is checked against this paper’s own text: does it say what the citing paper says it does?
The cited source says what the claim attributes to it.
In the citing paper
“Murphy et al. (2015) found that the ramping-like characteristics of a centroparietal electroencephalogram (EEG) signal, the Pe, was consistent with postdecisional evidence accumulation in a self-related reference frame.”
From Metacognition and Confidence: A Review and Synthesis (2024) · cites this paper as Murphy et al. 2015
The cited source says what the claim attributes to it.
In the citing paper
“The postdecisional build-up rate of this signal was proportional to the speed of subjective error detection, and it reached a constant amplitude at the point of detection that was independent of error-detection response time.”
From Metacognition and Confidence: A Review and Synthesis (2024) · cites this paper as Murphy et al. 2015
Self-check
Percentages, sums and reported differences re-computed from the paper’s own numbers.
The self-check needs the paper’s full text.
Citations
Cites
Delorme, A., & Makeig, S. (2004) · Journal of Neuroscience Methods · doi:10.1016/j.jneumeth.2003.10.009 · Cited by 24,371
Conflict monitoring and cognitive control
Botvinick, M. M., Braver, T. S., Barch, D. M., Carter, C. S., & Cohen, J. D. (2001) · Psychological Review · doi:10.1037/0033-295x.108.3.624 · Cited by 7,351
The Neural Basis of Decision Making
Gold, J. I., & Shadlen, M. N. (2007) · Annual Review of Neuroscience · doi:10.1146/annurev.neuro.29.051605.113038 · Cited by 3,764
Anterior Cingulate Cortex, Error Detection, and the Online Monitoring of Performance
Carter, C. S., Braver, T. S., Barch, D. M., Botvinick, M. M., Noll, D., & Cohen, J. D. (1998) · Science · doi:10.1126/science.280.5364.747 · Cited by 3,273
The role of the medial frontal cortex in cognitive control
Ridderinkhof, K. R., Ullsperger, M., Crone, E. A., & Nieuwenhuis, S. (2004) · Science · doi:10.1126/science.1100301 · Cited by 2,974
Anterior Cingulate Conflict Monitoring and Adjustments in Control
Kerns, J. G., Cohen, J. D., MacDonald, A. W., Cho, R. Y., Stenger, V. A., & Carter, C. S. (2004) · Science · doi:10.1126/science.1089910 · Cited by 2,891
A neural system for error detection and compensation
Gehring, W. J., Goss, B., Coles, M. G. H., Meyer, D. E., & Donchin, E. (1993) · Psychological Science · doi:10.1111/j.1467-9280.1993.tb00586.x · Cited by 2,862
Frontal theta as a mechanism for cognitive control
Cavanagh, J. F., & Frank, M. J. (2014) · Trends in Cognitive Sciences · doi:10.1016/j.tics.2014.04.012 · Cited by 2,726 · cited 4×
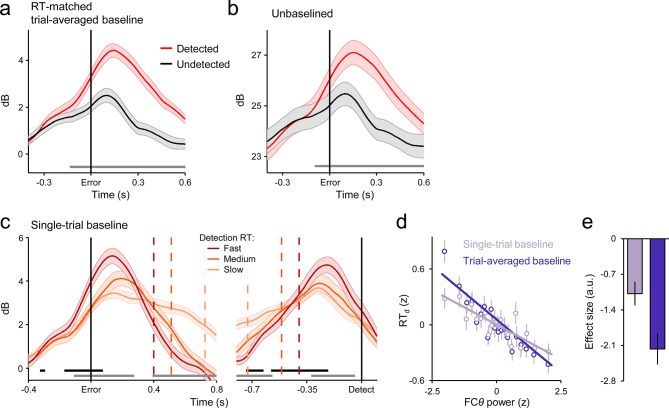
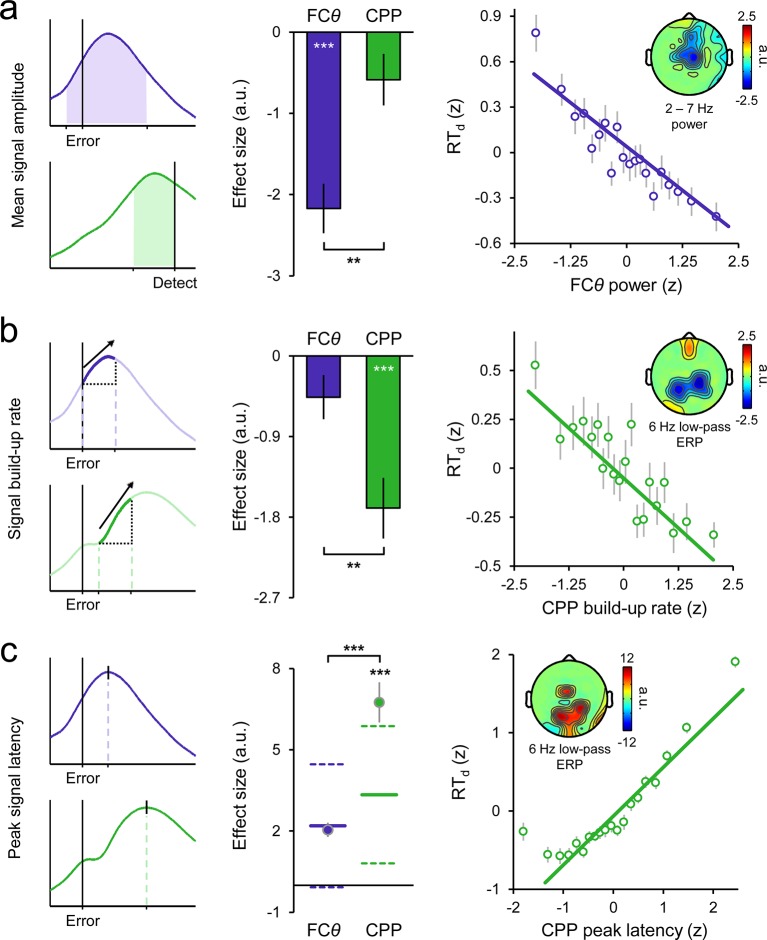
“…the influence of pMFC on error detection decisions by interrogating a prominent oscillatory signature that provides a proxy for pMFC activity, fronto-central theta power (FC ; 2–7 Hz; Cavanagh and Frank, 2014; Cavanagh et al., 2011; Cohen, 2014; Cohen and Donner, 2013; Narayanan, et al., 2013).”
BackgroundInfluentialOn the ability to inhibit thought and action: a theory of an act of control
Logan, G. D., & Cowan, W. B. (1984) · Psychological Review · doi:10.1037/0033-295x.91.3.295 · Cited by 2,590
The expected value of control: an integrative theory of anterior cingulate cortex function
Shenhav, A., Botvinick, M. M., & Cohen, J. D. (2013) · Neuron · doi:10.1016/j.neuron.2013.07.007 · Cited by 2,321
Research works printed but not linked: 1
- Link, 2003, Proceeding of the Nineteenth Annual Meeting of The International Society for Psychophysics
Cited by
Sorted by citations
Metacognition and Confidence: A Review and Synthesis
Fleming, S. M. (2024) · Annual Review of Psychology · doi:10.1146/annurev-psych-022423-032425 · Cited by 256
“Murphy et al. (2015) found that the ramping-like characteristics of a centroparietal EEG signal, the Pe, was consistent with post-decisional evidence accumulation in a self-related reference frame.”
Global gain modulation generates time-dependent urgency during perceptual choice in humans
Murphy, P. R., Boonstra, E., & Nieuwenhuis, S. (2016) · Nature Communications · doi:10.1038/ncomms13526 · Cited by 206
Self-citationNeural mediators of changes of mind about perceptual decisions
Fleming, S. M., van der Putten, E. J., & Daw, N. D. (2018) · Nature Neuroscience · doi:10.1038/s41593-018-0104-6 · Cited by 155
Decisions are expedited through multiple neural adjustments spanning the sensorimotor hierarchy
Steinemann, N. A., O’Connell, R. G., & Kelly, S. P. (2018) · Nature Communications · doi:10.1038/s41467-018-06117-0 · Cited by 166
Self-citationTagliabue, C. F., Veniero, D., Benwell, C., Cecere, R., Savazzi, S., & Thut, G. (2019) · Scientific Reports · doi:10.1038/s41598-019-41024-4 · Cited by 150
Frömer, R., Maier, M. E., & Rahman, R. A. (2018) · Frontiers in Neuroscience · doi:10.3389/fnins.2018.00048 · Cited by 118
Forming global estimates of self-performance from local confidence
Rouault, M., Dayan, P., & Fleming, S. M. (2019) · Nature Communications · doi:10.1038/s41467-019-09075-3 · Cited by 134
Neurocomputational mechanisms of prior-informed perceptual decision-making in humans
Kelly, S. P., Corbett, E. A., & O’Connell, R. G. (2020) · Nature Human Behaviour · doi:10.1038/s41562-020-00967-9 · Cited by 152
Self-citationTuning alpha rhythms to shape conscious visual perception
Gregorio, F. D., Trajkovic, J., Roperti, C., Marcantoni, E., Luzio, P. D., Avenanti, A., Thut, G., & Romei, V. (2022) · Current Biology · doi:10.1016/j.cub.2022.01.003 · Cited by 125
Metacognition in Multisensory Perception
Deroy, O. D., Spence, C. J., & Noppeney, U. (2016) · Trends in Cognitive Sciences · doi:10.1016/j.tics.2016.08.006 · Cited by 140
Berwian, I. M., Wenzel, J. G., Collins, A. G. E., Seifritz, E., Stephan, K. E., Walter, H., & Huys, Q. J. M. (2020) · JAMA Psychiatry · doi:10.1001/jamapsychiatry.2019.4971 · Cited by 113
Neurophysiology of Human Perceptual Decision-Making
O’Connell, R. G., & Kelly, S. P. (2021) · Annual Review of Neuroscience · doi:10.1146/annurev-neuro-092019-100200 · Cited by 130
Self-citationModels, movements, and minds: bridging the gap between decision making and action
Wispinski, N. J., Gallivan, J. P., & Chapman, C. S. (2018) · Annals of the New York Academy of Sciences · doi:10.1111/nyas.13973 · Cited by 112
Human VMPFC encodes early signatures of confidence in perceptual decisions
Gherman, S., & Philiastides, M. G. (2018) · eLife · doi:10.7554/elife.38293 · Cited by 107
A postdecisional neural marker of confidence predicts information-seeking in decision-making
Desender, K., Murphy, P., Boldt, A., Verguts, T., & Yeung, N. (2019) · The Journal of Neuroscience · doi:10.1523/jneurosci.2620-18.2019 · Cited by 88
Self-citationConfidence predicts speed-accuracy tradeoff for subsequent decisions
Desender, K., Boldt, A., Verguts, T., & Donner, T. H. (2019) · eLife · doi:10.7554/elife.43499 · Cited by 107
Post-decisional accounts of biases in confidence
Navajas, J., Bahrami, B., & Latham, P. E. (2016) · Current Opinion in Behavioral Sciences · doi:10.1016/j.cobeha.2016.05.005 · Cited by 97
The P300 as marker of inhibitory control – Fact or fiction?
Huster, R. J., Messel, M. S., Thunberg, C., & Raud, L. (2020) · Cortex · doi:10.1016/j.cortex.2020.05.021 · Cited by 91
Confidence in consciousness research
Michel, M. (2022) · Wiley Interdisciplinary Reviews Cognitive Science · doi:10.1002/wcs.1628 · Cited by 91
Di Gregorio, F., Maier, M. E., & Steinhauser, M. (2018) · NeuroImage · doi:10.1016/j.neuroimage.2018.01.081 · Cited by 85
Evidence accumulation relates to perceptual consciousness and monitoring
Pereira, M., Mégevand, P., Tan, M. X., Chang, W., Wang, S., Rezai, A. R., Seeck, M., Corniola, M. V., Momjian, S., Bernasconi, F., et al. (2021) · Nature Communications · doi:10.1038/s41467-021-23540-y · Cited by 109
Disentangling the origins of confidence in speeded perceptual judgments through multimodal imaging
Pereira, M., Faivre, N., Iturrate, I., Wirthlin, M., Serafini, L., Martin, S., Desvachez, A., Blanke, O., Van De Ville, D., & Millán, J. D. R. (2020) · Proceedings of the National Academy of Sciences · doi:10.1073/pnas.1918335117 · Cited by 72
Understanding neural signals of post-decisional performance monitoring: An integrative review
Desender, K., Ridderinkhof, K. R., & Murphy, P. R. (2021) · eLife · doi:10.7554/elife.67556 · Cited by 77
Self-citationConfidence reflects a noisy decision reliability estimate
Boundy-Singer, Z. M., Ziemba, C. M., & Goris, R. L. T. (2022) · Nature Human Behaviour · doi:10.1038/s41562-022-01464-x · Cited by 71
A neural circuit model of decision uncertainty and change-of-mind
Atiya, N. A. A., Rañó, I., Prasad, G., & Wong‐Lin, K. (2019) · Nature Communications · doi:10.1038/s41467-019-10316-8 · Cited by 69
Towards explaining spatial touch perception: Weighted integration of multiple location codes
Badde, S., & Heed, T. (2016) · Cognitive Neuropsychology · doi:10.1080/02643294.2016.1168791 · Cited by 75
Dynamic expressions of confidence within an evidence accumulation framework
Desender, K., Donner, T. H., & Verguts, T. (2020) · Cognition · doi:10.1016/j.cognition.2020.104522 · Cited by 70
Response-based outcome predictions and confidence regulate feedback processing and learning
Frömer, R., Nassar, M. R., Bruckner, R., Stürmer, B., Sommer, W., & Yeung, N. (2021) · eLife · doi:10.7554/elife.62825 · Cited by 67
Revealing subthreshold motor contributions to perceptual confidence
Gajdos, T., Fleming, S. M., Garcia, M. S., Weindel, G., & Davranche, K. (2019) · Neuroscience of Consciousness · doi:10.1093/nc/niz001 · Cited by 59
On second thoughts: changes of mind in decision-making
Stone, C., Mattingley, J. B., & Rangelov, D. (2022) · Trends in Cognitive Sciences · doi:10.1016/j.tics.2022.02.004 · Cited by 65
Visibility Is Not Equivalent to Confidence in a Low Contrast Orientation Discrimination Task
Rausch, M., & Zehetleitner, M. (2016) · Frontiers in Psychology · doi:10.3389/fpsyg.2016.00591 · Cited by 61
Action information contributes to metacognitive decision-making
Wokke, M. E., Achoui, D., & Cleeremans, A. (2020) · Scientific Reports · doi:10.1038/s41598-020-60382-y · Cited by 56
Confirmation bias is adaptive when coupled with efficient metacognition
Rollwage, M., & Fleming, S. M. (2021) · Philosophical Transactions of the Royal Society B Biological Sciences · doi:10.1098/rstb.2020.0131 · Cited by 68
McGovern, D. P., Hayes, A., Kelly, S. P., & O’Connell, R. G. (2018) · Nature Human Behaviour · doi:10.1038/s41562-018-0465-6 · Cited by 54
Self-citationFrömer, R., & Shenhav, A. (2021) · Neuroscience & Biobehavioral Reviews · doi:10.1016/j.neubiorev.2021.12.006 · Cited by 57
Decision ambiguity is mediated by a late positive potential originating from cingulate cortex
Sun, S., Zhen, S., Fu, Z., Wu, D.-A. J., Shimojo, S., Adolphs, R., Yu, R., & Wang, S. (2017) · NeuroImage · doi:10.1016/j.neuroimage.2017.06.003 · Cited by 52
Neural and behavioral traces of error awareness
Kirschner, H., Humann, J., Derrfuß, J., Danielmeier, C., & Ullsperger, M. (2020) · Cognitive Affective & Behavioral Neuroscience · doi:10.3758/s13415-020-00838-w · Cited by 53
Evidence or Confidence: What Is Really Monitored during a Decision?
Lee, D. G., Jean Daunizeau, A., & Pezzulo, G. (2023) · Psychonomic Bulletin & Review · doi:10.3758/s13423-023-02255-9 · Cited by 57
How (not) to underestimate unconscious perception
Michel, M. (2022) · Mind & Language · doi:10.1111/mila.12406 · Cited by 60
Devine, C. A., Gaffney, C., Loughnane, G. M., Kelly, S. P., & O’Connell, R. G. (2019) · eLife · doi:10.7554/elife.48526 · Cited by 46
Self-citationGregorio, F. D., Steinhauser, M., Maier, M. E., Thayer, J. F., & Battaglia, S. (2024) · Neuroscience and Biobehavioral Reviews · doi:10.1016/j.neubiorev.2024.105542 · Cited by 37
Brosnan, M. B., Sabaroedin, K., Silk, T. J., Genc, S., Newman, D. P., Loughnane, G. M., Fornito, A., O’Connell, R. G., & Bellgrove, M. A. (2020) · Nature Human Behaviour · doi:10.1038/s41562-020-0863-4 · Cited by 42
Self-citationNewman, D. P., Loughnane, G. M., Kelly, S. P., O’Connell, R. G., & Bellgrove, M. A. (2017) · Journal of Neuroscience · doi:10.1523/jneurosci.3512-16.2017 · Cited by 37
Self-citationImpaired conscious access and abnormal attentional amplification in schizophrenia
Berkovitch, L., Cul, A. D., Maheu, M., & Dehaene, S. (2018) · NeuroImage Clinical · doi:10.1016/j.nicl.2018.03.010 · Cited by 43
Distinct neurocomputational mechanisms support informational and socially normative conformity
Mahmoodi, A., Nili, H., Bang, D., Mehring, C., & Bahrami, B. (2022) · PLoS Biology · doi:10.1371/journal.pbio.3001565 · Cited by 44
Towards error categorisation in BCI: single-trial EEG classification between different errors
Wirth, C., Dockree, P. M., Harty, S., Lacey, E., & Arvaneh, M. (2019) · Journal of Neural Engineering · doi:10.1088/1741-2552/ab53fe · Cited by 36
Self-citationConfidence is predicted by pre- and post-choice decision signal dynamics
Grogan, J. P., Rys, W., Kelly, S. P., & O’Connell, R. G. (2023) · Imaging Neuroscience · doi:10.1162/imag_a_00005 · Cited by 40
Self-citationChanges-of-mind in the absence of new post-decision evidence
Atiya, N. A. A., Zgonnikov, A., Schoemann, M., Scherbaum, S., O’Hora, D. P., & Wong‐Lin, K. (2020) · PLoS Computational Biology · doi:10.1371/journal.pcbi.1007149 · Cited by 32
Error detection across the adult lifespan: Electrophysiological evidence for age-related deficits
Nießen, E., Fink, G. R., Hoffmann, H. E. M., Weiss, P. H., & Stähl, J. (2017) · NeuroImage · doi:10.1016/j.neuroimage.2017.03.015 · Cited by 33
Dynamic sources of evidence supporting confidence judgments and error detection.
Charles, L., & Yeung, N. (2018) · Journal of Experimental Psychology Human Perception & Performance · doi:10.1037/xhp0000583 · Cited by 38
Rangelov, D., & Mattingley, J. B. (2020) · NeuroImage · doi:10.1016/j.neuroimage.2020.117093 · Cited by 32
Separable neural signatures of confidence during perceptual decisions
Balsdon, T., Mamassian, P., & Wyart, V. (2021) · eLife · doi:10.7554/elife.68491 · Cited by 44
Post-decision wagering after perceptual judgments reveals bi-directional certainty readouts
Moreira, C. M., Rollwage, M., Kaduk, K., Wilke, M., & Kagan, I. (2018) · Cognition · doi:10.1016/j.cognition.2018.02.026 · Cited by 37
Error-related negativity and error awareness in a Go/No-go task
Wang, L., Gu, Y., Zhao, G., & Chen, A. (2020) · Scientific Reports · doi:10.1038/s41598-020-60693-0 · Cited by 41
Postdecision Evidence Integration and Depressive Symptoms
Moses-Payne, M. E., Rollwage, M., Fleming, S. M., & Roiser, J. P. (2019) · Frontiers in Psychiatry · doi:10.3389/fpsyt.2019.00639 · Cited by 30
den Ouden, C., Zhou, A., Mepani, V., Kovács, G., Vogels, R., & Feuerriegel, D. (2023) · NeuroImage · doi:10.1016/j.neuroimage.2023.120347 · Cited by 36
Error-related brain activity and error awareness in an error classification paradigm
Gregorio, F. D., Steinhauser, M., & Maier, M. E. (2016) · NeuroImage · doi:10.1016/j.neuroimage.2016.05.074 · Cited by 38
Pezzetta, R., Wokke, M. E., Aglioti, S. M., & Ridderinkhof, K. R. (2021) · Neuroscience · doi:10.1016/j.neuroscience.2021.01.027 · Cited by 30
Human VMPFC encodes early signatures of confidence in perceptual decisionsPreprint
Gherman, S., & Philiastides, M. G. (2017) · bioRxiv (Cold Spring Harbor Laboratory) · doi:10.1101/224337 · Cited by 30
Metacognition and confidence: A review and synthesisPreprint
Fleming, S. M. (2023) · doi:10.31234/osf.io/ge7tz · Cited by 27
Parsing the neural signatures of reduced error detection in older age
Harty, S., Murphy, P. R., Robertson, I. H., & O’Connell, R. G. (2017) · NeuroImage · doi:10.1016/j.neuroimage.2017.08.032 · Cited by 26
Self-citationPrior information differentially affects discrimination decisions and subjective confidence reports
Constant, M., Pereira, M., Faivre, N., & Filevich, E. (2023) · Nature Communications · doi:10.1038/s41467-023-41112-0 · Cited by 27
Loughnane, G. M., Brosnan, M. B., Barnes, J. J. M., Dean, A. J., Nandam, L. S., O’Connell, R. G., & Bellgrove, M. A. (2019) · Journal of Cognitive Neuroscience · doi:10.1162/jocn_a_01393 · Cited by 24
Self-citationKamińska, O. K., Magnuski, M., Olszanowski, M., Gola, M. K., Brzezicka, A., & Winkielman, P. (2020) · Cognitive Affective & Behavioral Neuroscience · doi:10.3758/s13415-020-00778-5 · Cited by 24
Coldea, A., Veniero, D., Morand, S. M., Trajkovic, J., Romei, V., Harvey, M., & Thut, G. (2022) · Frontiers in Neuroscience · doi:10.3389/fnins.2022.886342 · Cited by 23
Changing our minds about changes of mind
Fleming, S. M. (2016) · eLife · doi:10.7554/elife.14790 · Cited by 22
Subjective confidence acts as an internal cost-benefit factor when choosing between tasks.
Carlebach, N., & Yeung, N. (2020) · Journal of Experimental Psychology Human Perception & Performance · doi:10.1037/xhp0000747 · Cited by 25
Feuerriegel, D., Murphy, M., Konski, A., Mepani, V., Sun, J., Hester, R., & Bode, S. (2022) · NeuroImage · doi:10.1016/j.neuroimage.2022.119447 · Cited by 24
López, V., Benbenishty, R., Astor, R. A., Ascorra, P., & González, L. (2020) · American Journal of Orthopsychiatry · doi:10.1037/ort0000445 · Cited by 22
The unfolding action model of initiation times, movement times, and movement paths.
Calderon, C. B., Gevers, W., & Verguts, T. (2018) · Psychological Review · doi:10.1037/rev0000110 · Cited by 21
Schüller, T., Gruendler, T. O. J., Huster, R. J., Baldermann, J. C., Huys, D., Ullsperger, M., & Kuhn, J. (2018) · Clinical Neurophysiology · doi:10.1016/j.clinph.2018.06.002 · Cited by 19
Performance monitoring for brain-computer-interface actions
Schurger, A., Gale, S., Gozel, O., & Blanke, O. (2016) · Brain and Cognition · doi:10.1016/j.bandc.2016.09.009 · Cited by 19
A Neural Signature Encoding Decisions under Perceptual Ambiguity
Sun, S., Yu, R., & Wang, S. (2017) · eNeuro · doi:10.1523/eneuro.0235-17.2017 · Cited by 18
Controllability boosts neural and cognitive signatures of changes-of-mind in uncertain environments
Rouault, M., Weiss, A., Lee, J. K., Drugowitsch, J., Chambon, V., & Wyart, V. (2022) · eLife · doi:10.7554/elife.75038 · Cited by 24
Effects of ketamine on brain function during metacognition of episodic memory
Lehmann, M., Neumann, C., Wasserthal, S., Schultz, J., Delis, A., Trautner, P., Hurlemann, R., & Ettinger, U. (2021) · Neuroscience of Consciousness · doi:10.1093/nc/niaa028 · Cited by 19
Feuerriegel, D., Jiwa, M., Turner, W., Andrejević, M., Hester, R., & Bode, S. (2021) · NeuroImage · doi:10.1016/j.neuroimage.2021.118265 · Cited by 17
Modelling Speed-Accuracy Tradeoffs in the Stopping Rule for Confidence JudgmentsPreprint
Herregods, S., Denmat, P. L., Vermeylen, L., & Desender, K. (2023) · bioRxiv (Cold Spring Harbor Laboratory) · doi:10.1101/2023.02.27.530208 · Cited by 17
Exploring the link between project delays and cancelation rates in the U.S. rooftop solar industry
Cook, J. J., Cruce, J. R., O’Shaughnessy, E., Ardani, K. B., & Margolis, R. (2021) · Energy Policy · doi:10.1016/j.enpol.2021.112421 · Cited by 16
Neural basis of concurrent deliberation toward a choice and confidence judgment
Vivar-Lazo, M., & Fetsch, C. R. (2025) · Nature Neuroscience · doi:10.1038/s41593-025-02116-9 · Cited by 22
Davidson, M., Macdonald, J. S. P., & Yeung, N. (2022) · Journal of Vision · doi:10.1167/jov.22.10.20 · Cited by 17
Wang, L., & Kuperberg, G. R. (2023) · Language Cognition and Neuroscience · doi:10.1080/23273798.2023.2223783 · Cited by 16
Having More Choices Changes How Human Observers Weight Stable Sensory Evidence
Itthipuripat, S., Cha, K., Deering, S., Salazar, A., & Serences, J. T. (2018) · Journal of Neuroscience · doi:10.1523/jneurosci.0440-18.2018 · Cited by 14
Balsdon, T., Pisauro, M. A., & Philiastides, M. G. (2024) · Nature Communications · doi:10.1038/s41467-024-49538-w · Cited by 14
A Neural Decision Signal during Internal Sampling from Working Memory in Humans
van Ede, F., & Nobre, A. C. (2024) · Journal of Neuroscience · doi:10.1523/jneurosci.1475-23.2024 · Cited by 22
Metacognitive Awareness of Difficulty in Action Selection: The Role of the Cingulo-opercular Network
Desender, K., Teuchies, M., González‐García, C., Baene, W. D., Demanet, J., & Braß, M. (2021) · Journal of Cognitive Neuroscience · doi:10.1162/jocn_a_01773 · Cited by 11
Neural correlates of metacognition across the adult lifespan
Overhoff, H., Ko, Y. H., Feuerriegel, D., Fink, G. R., Stähl, J., Weiss, P. H., Bode, S., & Nießen, E. (2021) · Neurobiology of Aging · doi:10.1016/j.neurobiolaging.2021.08.001 · Cited by 14
Multimodal investigations of emotional face processing and social trait judgment of faces
Yu, H., Lin, C., Sun, S., Cao, R., Kar, K., & Wang, S. (2023) · Annals of the New York Academy of Sciences · doi:10.1111/nyas.15084 · Cited by 12
Advice-taking as a bridge between decision neuroscience and mental capacity
van der Plas, E., David, A. S., & Fleming, S. M. (2019) · International Journal of Law and Psychiatry · doi:10.1016/j.ijlp.2019.101504 · Cited by 13
Global motion evoked potentials in autistic and dyslexic children: A cross-syndrome approach
Toffoli, L., Scerif, G., Snowling, M. J., Norcia, A. M., & Manning, C. (2021) · Cortex · doi:10.1016/j.cortex.2021.06.018 · Cited by 12
History biases reveal novel dissociations between perceptual and metacognitive decision-making
Benwell, C., Beyer, R., Wallington, F., & Ince, R. A. A. (2023) · Journal of Vision · doi:10.1167/jov.23.5.14 · Cited by 13
Frömer, R., Nassar, M. R., Bruckner, R., Stürmer, B., Sommer, W., & Yeung, N. (2018) · bioRxiv (Cold Spring Harbor Laboratory) · doi:10.1101/442822 · Cited by 13
Explaining Integration of Evidence Separated by Temporal Gaps with Frontoparietal Circuit Models
Azizi, Z. R., & Ebrahimpour, R. (2022) · Neuroscience · doi:10.1016/j.neuroscience.2022.10.019 · Cited by 14
Neural correlates of confidence during decision formation in a perceptual judgment task
Ko, Y. H., Zhou, A., Nießen, E., Stähl, J., Weiss, P. H., Hester, R., Bode, S., & Feuerriegel, D. (2024) · Cortex · doi:10.1016/j.cortex.2024.01.006 · Cited by 14
Brosnan, M. B., O'Neill, M., Loughnane, G. M., Pearce, D. J., Fleming, B., Zhou, S.-H., Chong, T. T. ‐., Nobre, A. C., O’Connell, R. G., & Bellgrove, M. A. (2023) · Journal of Neuroscience · doi:10.1523/jneurosci.2260-21.2023 · Cited by 10
Self-citationBring a map when exploring the ERP data processing multiverse: A commentary on Clayson et al. 2021
Feuerriegel, D., & Bode, S. (2022) · NeuroImage · doi:10.1016/j.neuroimage.2022.119443 · Cited by 8
Lim, K., Wang, W., & Merfeld, D. M. (2017) · Journal of Neurophysiology · doi:10.1152/jn.00318.2017 · Cited by 10
Confirmation bias is adaptive when coupled with efficient metacognitionPreprint
Rollwage, M., & Fleming, S. M. (2020) · bioRxiv (Cold Spring Harbor Laboratory) · doi:10.1101/2020.07.28.225029 · Cited by 10
Robertson, I. H., & Dockree, P. M. (2019) · Cambridge University Press eBooks · doi:10.1017/9781108554350.010 · Cited by 9
Self-citationGoueytes, D., Stockart, F., Robin, A., Gyger, L., Rouy, M., Hoffmann, D., Minotti, L., Kahane, P., Pereira, M., & Faivre, N. (2025) · Nature Communications · doi:10.1038/s41467-025-61744-8 · Cited by 12
Unconscious Perception of Vernier Offsets
Amerio, P., Michel, M., Goerttler, S., Peters, M. A. K., & Axel Cleeremans, B. (2024) · Open Mind · doi:10.1162/opmi_a_00145 · Cited by 10
Metadata
- Authors
- Murphy, P. R., Robertson, I. H., Harty, S., & O'Connell, R. G.
- Affiliations
- Leiden University (NL)
- Trinity College Dublin (IE)
- Trinity College Institute of Neuroscience, School of Psychology, Trinity College Dublin, Dublin, Ireland
- Corresponding author
- Murphy, Peter R
- Venue
- eLife
- Publisher
- eLife Sciences Publications, Ltd
- Published
- 2015-12-19
- Volume
- 4
- ISSN
- 2050-084X (ISSN-L)
- PMC
- PMC4749550
- OpenAlex
- W2207026948
- Cited by
- 170
- References
- 73
- Citations by year
- 2026: 16 · 2025: 11 · 2024: 12 · 2023: 17 · 2022: 17 · 2021: 22 · 2020: 22 · 2019: 18 · 2018: 17 · 2017: 9 · 2016: 9
- FWCI
- 7.01
- Type
- journal article
- Language
- en
- Open access
- gold
- doi.org
- Licence
- Locations
- eLife (publishedVersion, cc-by)
- PubMed Central (publishedVersion, cc-by)
- PubMed (publishedVersion)
- Leiden Repository (Leiden University) (submittedVersion, other-oa)
- Leiden Repository (Leiden University) (submittedVersion)
- Arrow@dit (Dublin Institute of Technology) (submittedVersion, cc-by-nc-sa)
- DOAJ (DOAJ: Directory of Open Access Journals) (submittedVersion, cc-by-sa)
- Leiden Repository (Leiden University) (submittedVersion, cc-by)
- Trinity's Access to Research Output (TARA) (Trinity College Dublin) (submittedVersion)
- Data Archiving and Networked Services (DANS) (submittedVersion, other-oa)
- Funders
- Irish Research Council (Postgraduate Fellowship)
- European Research Council (Starting Grant 63829)
- Topics
- Life Sciences › Neuroscience › Cognitive Neuroscience › Neural and Behavioral Psychology Studies
- Life Sciences › Neuroscience › Cognitive Neuroscience › Neural dynamics and brain function
- Social Sciences › Decision Sciences › General Decision Sciences › Decision-Making and Behavioral Economics
- Keywords
- metacognition, evidence accumulation, confidence judgments, error detection, medial frontal cortex, decision-making
- MeSH terms
- Metacognition, Decision Making, Electroencephalography, Frontal Lobe, Humans, Judgment, Healthy Volunteers
About these checks
Registry, retraction, Cites and statistics results are computed, not judged, with one exception: a printed reference that no index lists is read once by a model before it counts as a citation error. Claims are extracted by a model and kept only when their quote appears verbatim in the text; each cited source is then checked, with a model’s help, for whether it says what the claim relies on. Those verdicts can be wrong — read the claim’s quote and the cited source before relying on one.
Statistics and arithmetic are recomputed, not judged.
Confidence bands are shown only for fields calibrated on our annotated test set. None is calibrated yet, so no band is shown.
What counts as a claim ›How we measure confidence ›How we check this ›
Are you an author, or do you see a problem with this page? Request a review
