

The DOI matches its Crossref record; 59 of the 59 references it cites were found in a registry or an index; none of the 32 sources its claims cite is checked for support yet.
YTHDC1 mediates nuclear export of N6-methyladenosine methylated mRNAs
Open accessAbstract
N6-methyladenosine (m6A) is the most abundant internal modification of eukaryotic messenger RNA (mRNA) and plays critical roles in RNA biology. The function of this modification is mediated by m6A-selective ‘reader’ proteins of the YTH family, which incorporate m6A-modified mRNAs into pathways of RNA metabolism. Here, we show that the m6A-binding protein YTHDC1 mediates export of methylated mRNA from the nucleus to the cytoplasm in HeLa cells. Knockdown of YTHDC1 results in an extended residence time for nuclear m6A-containing mRNA, with an accumulation of transcripts in the nucleus and accompanying depletion within the cytoplasm. YTHDC1 interacts with the splicing factor and nuclear export adaptor protein SRSF3, and facilitates RNA binding to both SRSF3 and NXF1. This role for YTHDC1 expands the potential utility of chemical modification of mRNA, and supports an emerging paradigm of m6A as a distinct biochemical entity for selective processing and metabolism of mammalian mRNAs.
Overview
CoChat Summary
TL;DR
YTHDC1, a nuclear m6A reader, mediates nuclear-to-cytoplasmic export of methylated mRNAs in HeLa cells by linking m6A recognition to the export adaptor SRSF3 and the export receptor NXF1. Knockdown of YTHDC1 causes nuclear accumulation and cytoplasmic depletion of its target transcripts, independent of pre-mRNA splicing.
Key findings
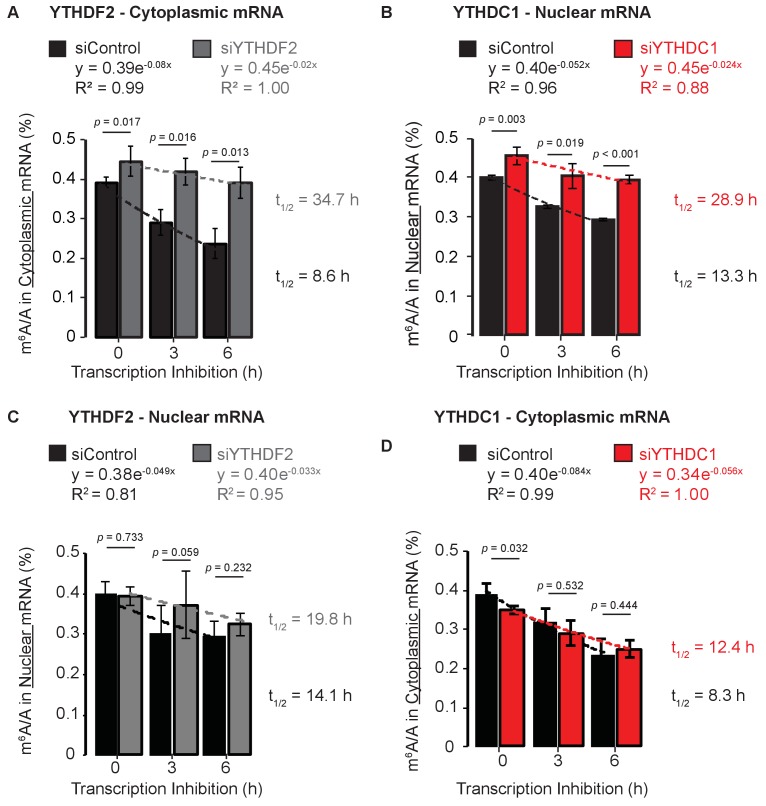
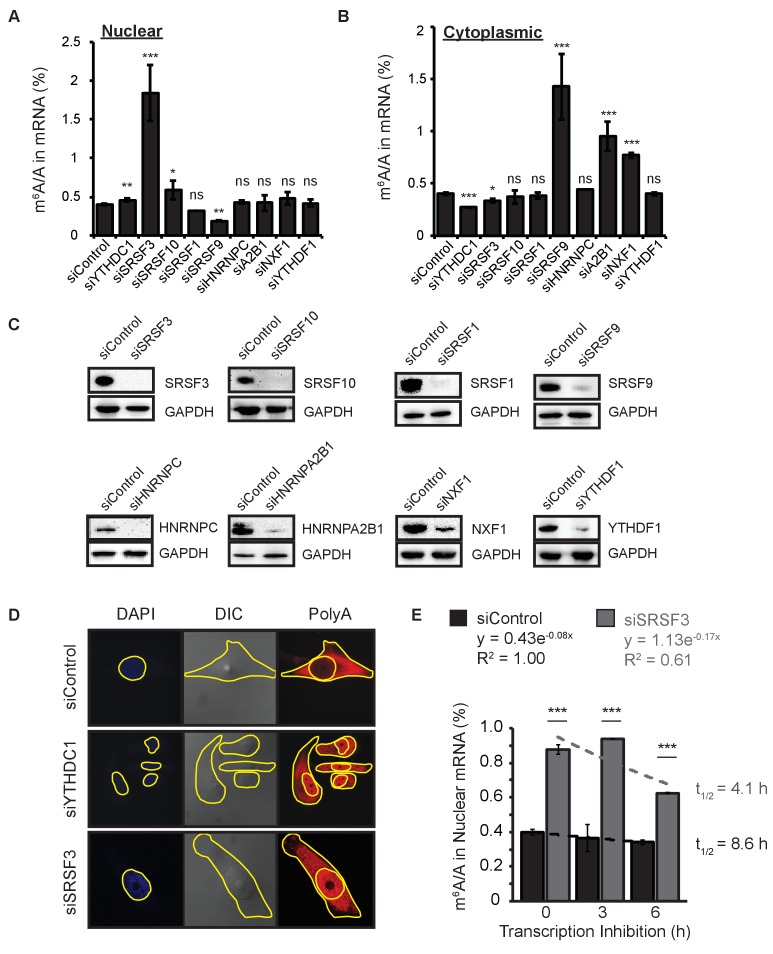
- Knockdown of YTHDC1 increased nuclear m6A levels and extended the apparent half-life of nuclear mRNA methylation more than 2-fold after transcription inhibition; YTHDF2 knockdown extended cytoplasmic m6A apparent half-life by ~4-fold.
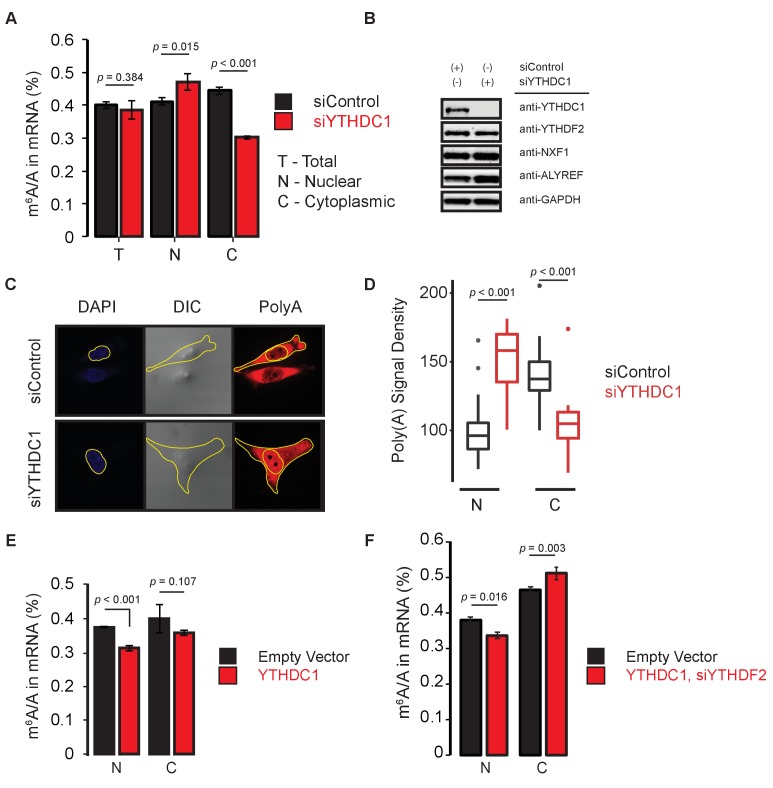
- YTHDC1 knockdown did not change total mRNA m6A/A but caused nuclear accumulation and cytoplasmic depletion of m6A and polyA RNA; overexpression of YTHDC1 after YTHDF2 knockdown increased cytoplasmic m6A.
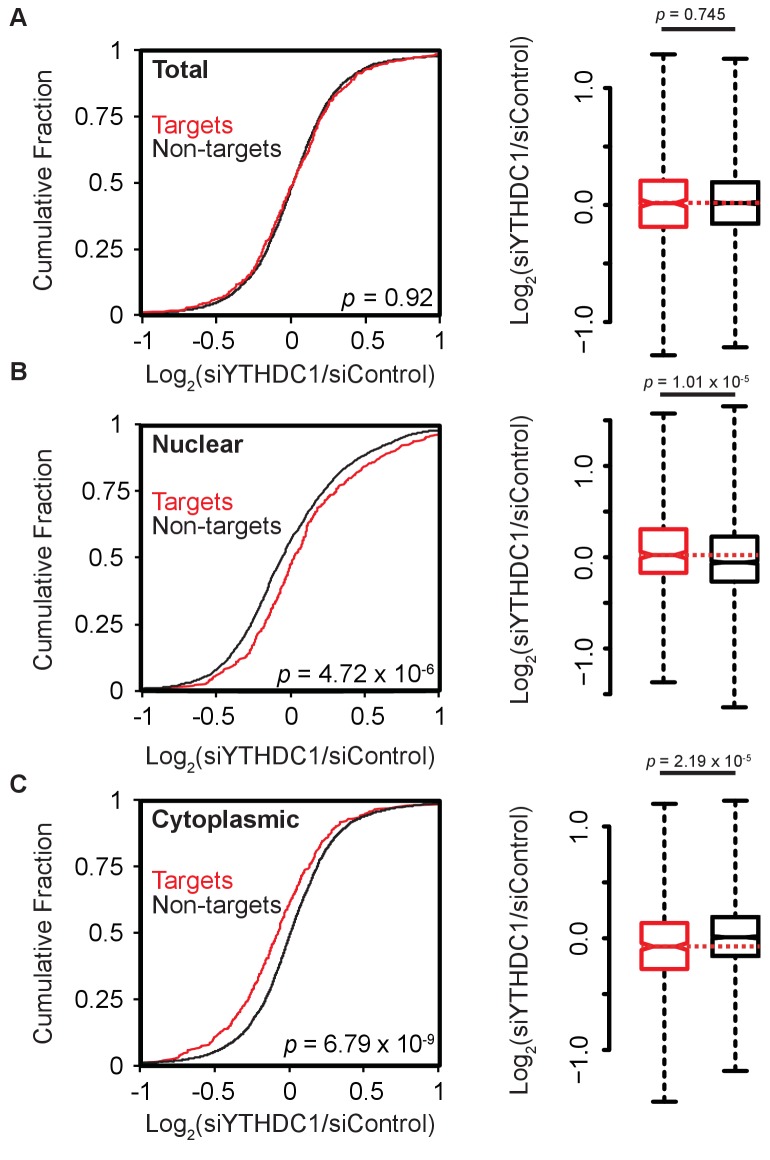
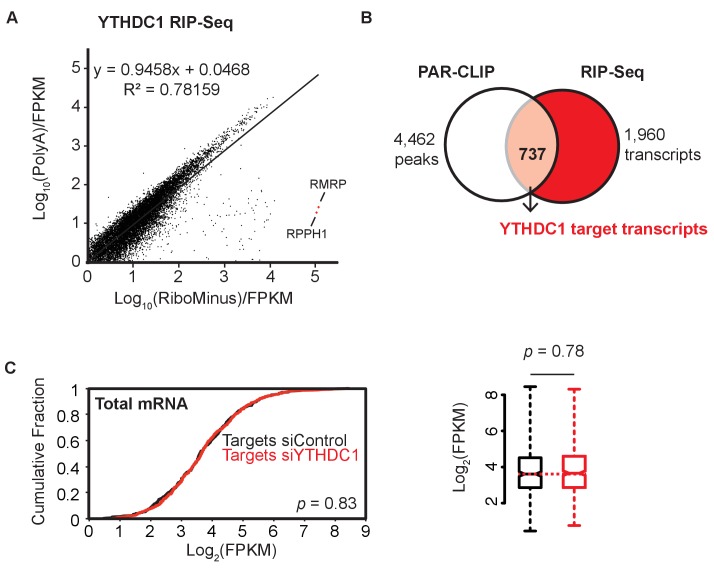
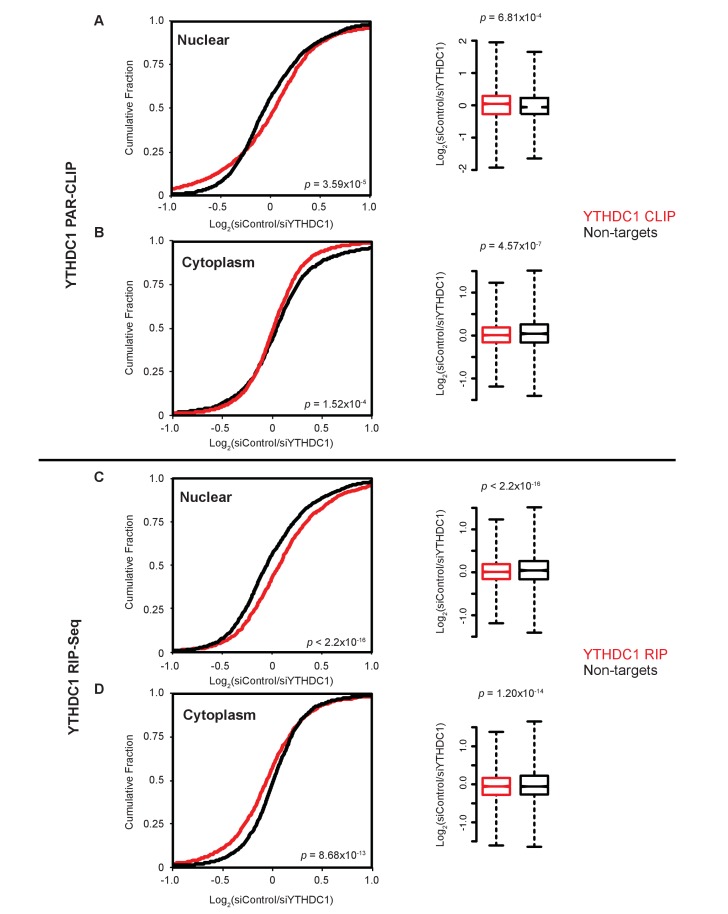
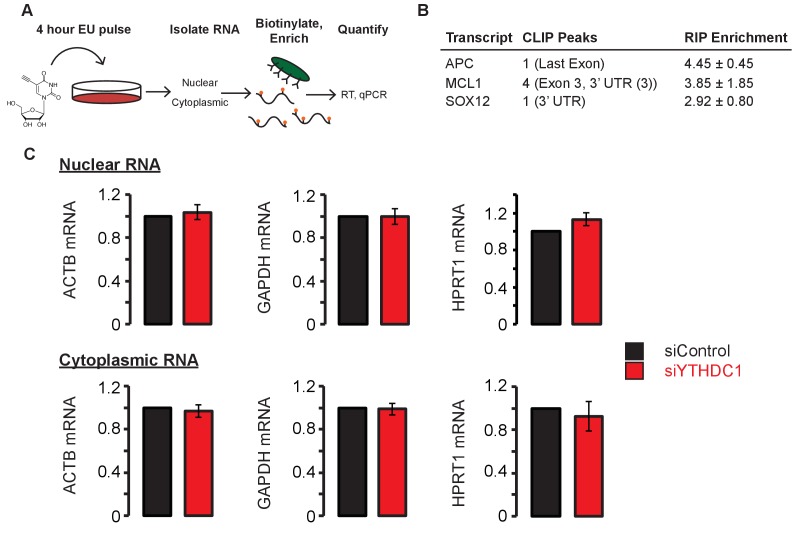
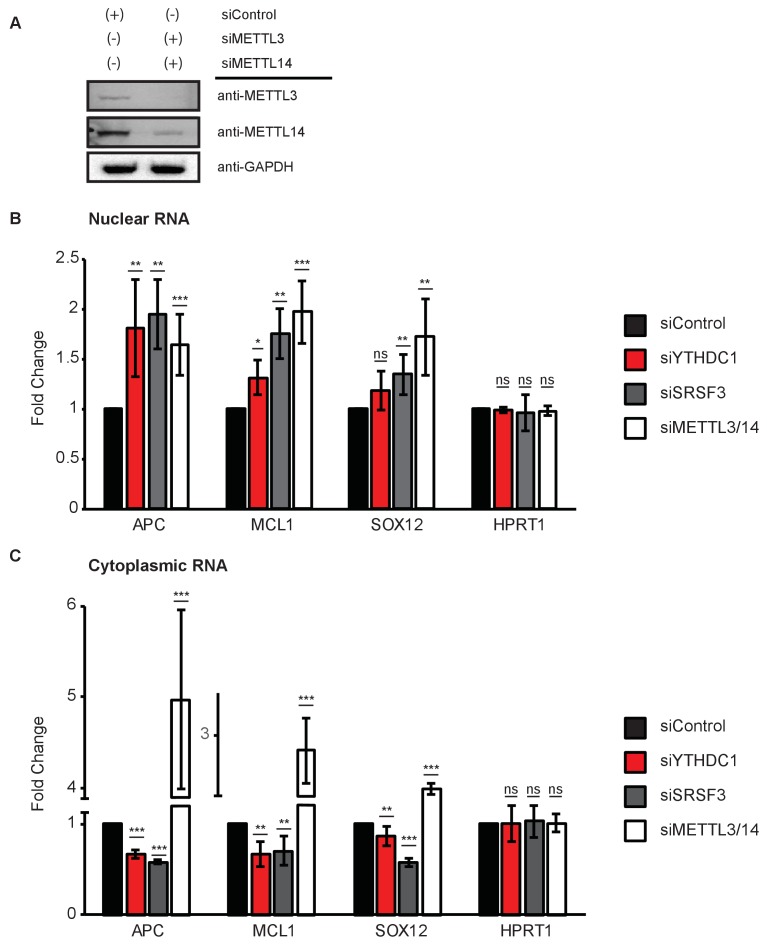
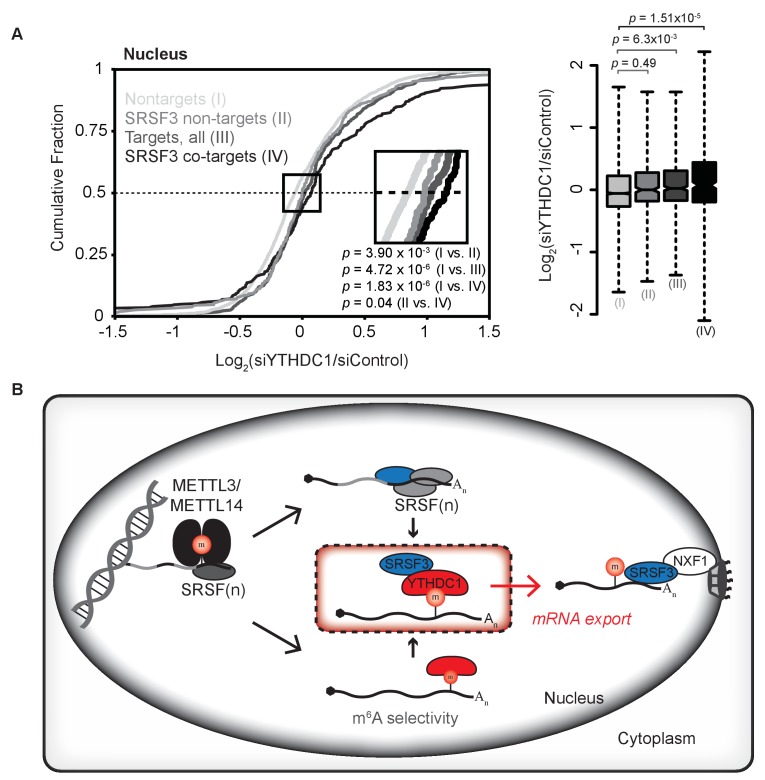
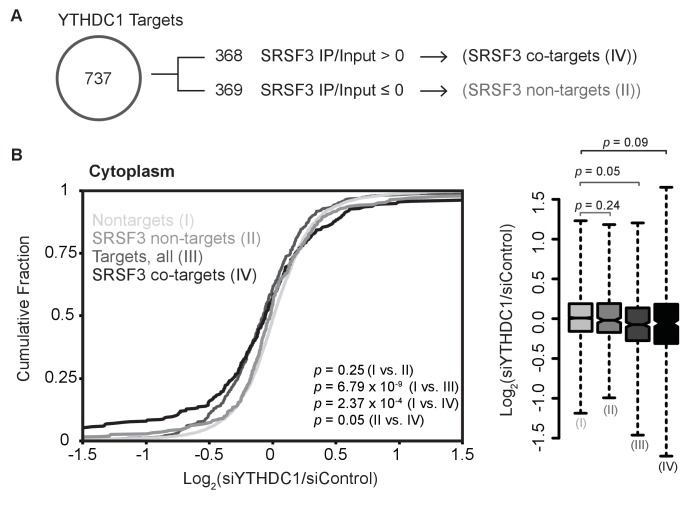
- YTHDC1 targets were defined as transcripts bound in PAR-CLIP and enriched at least 2-fold in RIP-seq, yielding over 700 targets; upon YTHDC1 knockdown, target abundance increased in nuclear RNA and decreased in cytoplasmic RNA, while total target abundance was unchanged.
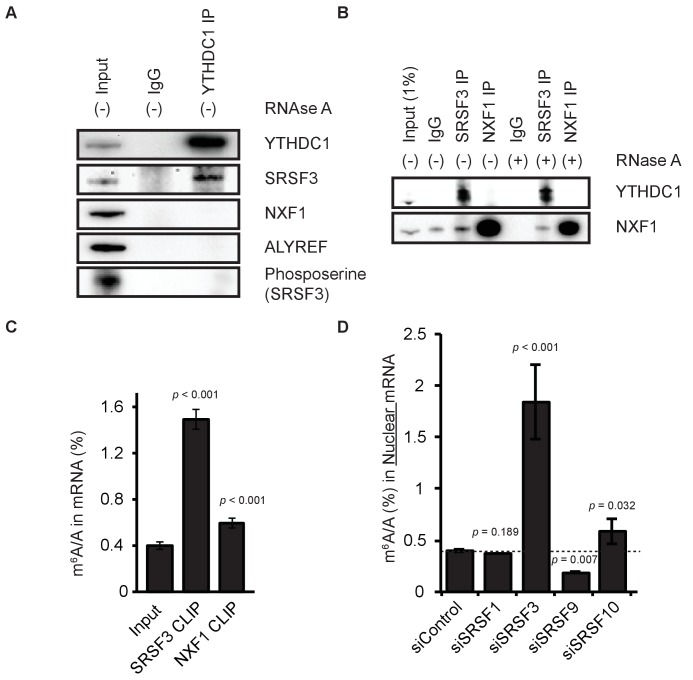
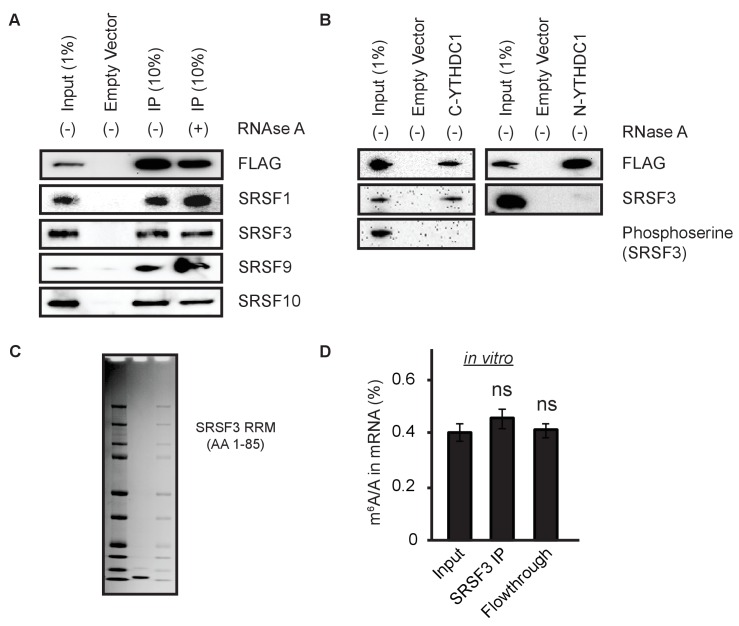
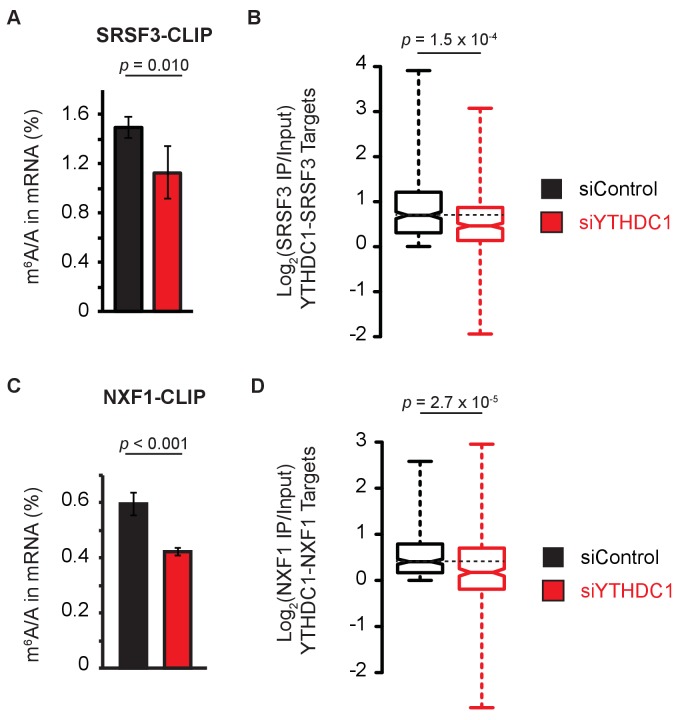
- YTHDC1 interacts with SRSF3, and SRSF3 interacts with NXF1; YTHDC1 knockdown reduced m6A enrichment by SRSF3 and abolished m6A enrichment by NXF1. Only transcripts bound by both YTHDC1 and SRSF3 showed significant nuclear accumulation upon YTHDC1 knockdown.
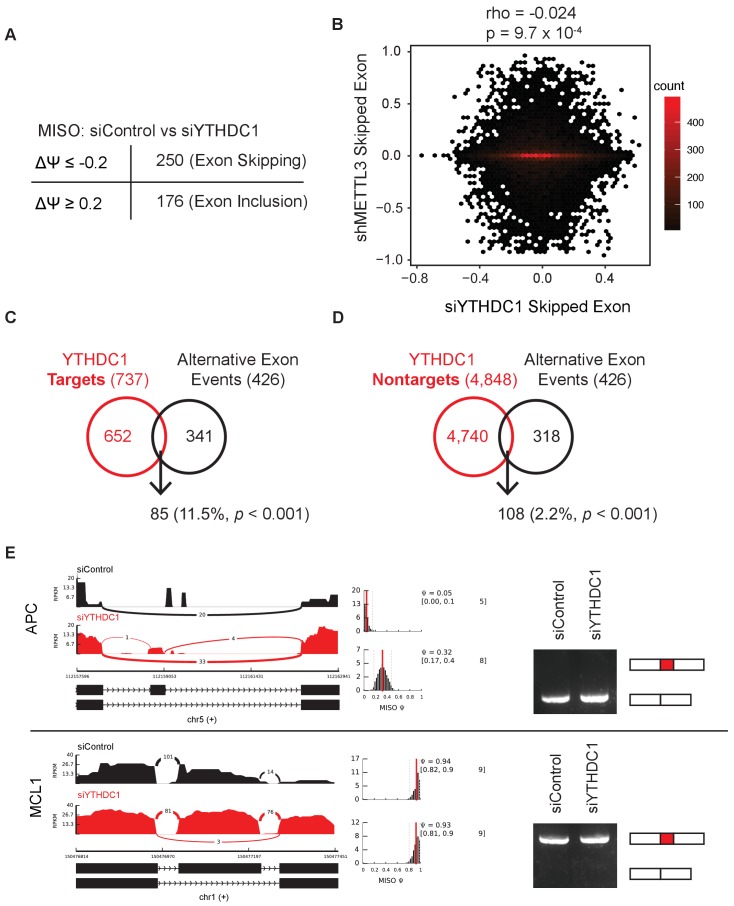
- YTHDC1 knockdown affected alternative splicing, with 426 events at Δpsi ≥0.2; 85/737 (11.5%) occurred in YTHDC1 targets versus 108/4,848 (2.2%) in non-targets, but reporter assays showed export effects independent of splicing and m6A binding.
Methods
- HeLa cells were used for siRNA knockdown, plasmid transfection, cellular fractionation, and RNA isolation; m6A/A was quantified by LC-MS/MS on polyA-selected, ribosomal RNA-depleted mRNA from total, nuclear, and cytoplasmic fractions.
- RNA substrates were identified by YTHDC1 PAR-CLIP and RIP-seq, subcellular transcriptomes by RNA-seq after YTHDC1 knockdown, and binding by SRSF3/NXF1 by CLIP or RIP followed by LC-MS/MS and sequencing.
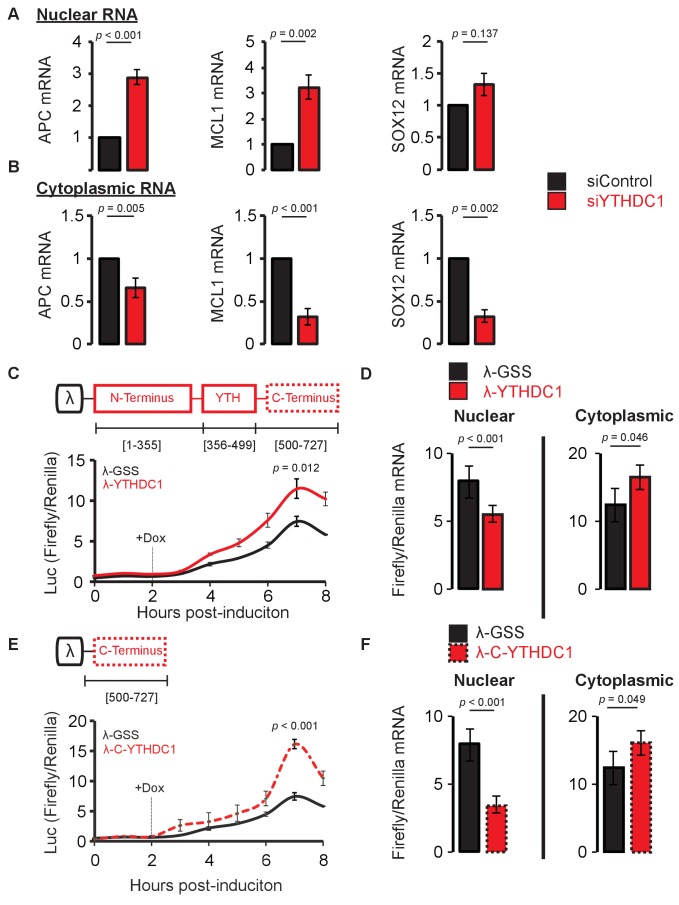
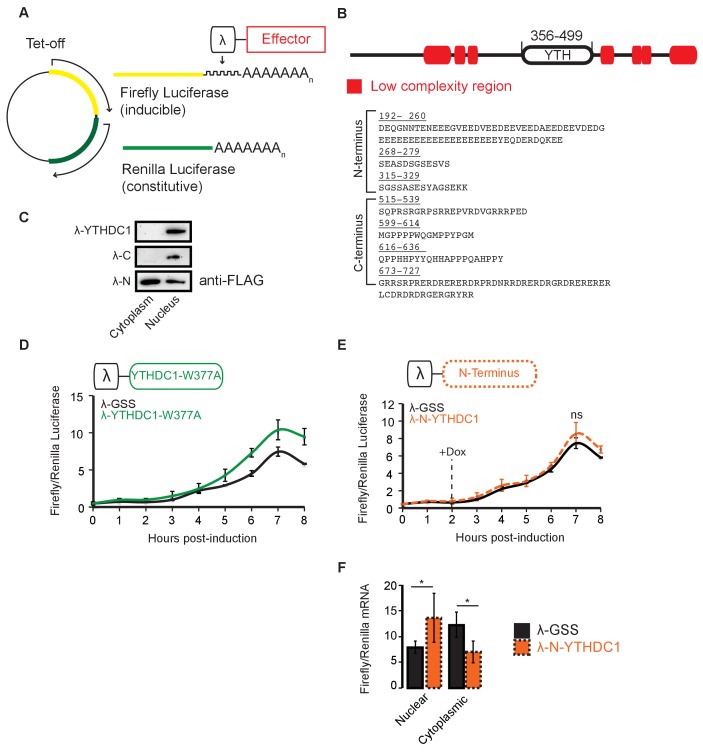
- Mechanistic tests included endogenous and FLAG immunoprecipitation, western blotting, polyA FISH, nascent RNA labeling with 5-ethynyl uridine, RT-qPCR, and a Tet-inducible BoxB-luciferase reporter tethering assay with full-length, N-terminal, C-terminal, and W377A YTHDC1 constructs.
Limitations
- The paper does not include a dedicated limitations section.
- Evident from the text: most experiments are in HeLa cells, so generality to other cell types or organisms is not established.
- The m6A/A measurements are ensemble bulk measurements; the paper notes this allows relative clearance comparisons without determining absolute half-lives of individual mRNAs.
- Export conclusions rely heavily on knockdown/overexpression and tethering assays; the reporter system is splicing-independent and methylation-independent due to BoxB–lambda peptide binding, which the authors present as an advantage but which also means it does not test endogenous m6A-dependent export directly.
Model-written summary. Check it against the paper before relying on it.
Integrity signals
Registry
Cites
Statistics
Figures
Verification
Claims the paper makes
0 Valid · 0 Not valid · 19 Not checked · 124 Own results and interpretations
A result the paper reports from its own data — it cites no other source for it, so there is none to check. The quote shows it is in the paper.
In the paper
“Upon knockdown of YTHDC1, we observed nuclear accumulation of nascent mRNA for both APC and MCL1 transcripts compared to control, whereas the difference in nuclear SOX12 mRNA abundance was modest and not significant in our assay (Figure 4A).”
§ YTHDC1 mediates nuclear export of N6-methyladenosine methylated mRNAs > Results > YTHDC1 mediates nuclear export of nascent mRNA
plainstates a cause- Asserted: passes — The authors put it forward as true.
- Checkable: passes — It can be checked against evidence.
- Load-bearing: passes — The paper’s conclusions depend on it.
- Based: passes — The paper gives a reason why it holds.
A result the paper reports from its own data — it cites no other source for it, so there is none to check. The quote shows it is in the paper.
In the paper
“We show that upon knockdown of YTHDC1, mature mRNA localization is perturbed independently of a splicing requirement or splicing outcomes.”
§ YTHDC1 mediates nuclear export of N6-methyladenosine methylated mRNAs > Discussion > m6A selectivity in nuclear mRNA processing and export
boostedstates a cause- Asserted: passes — The authors put it forward as true.
- Checkable: passes — It can be checked against evidence.
- Load-bearing: passes — The paper’s conclusions depend on it.
- Based: passes — The paper gives a reason why it holds.
- Rests on an assumption not shown here.
A result the paper reports from its own data — it cites no other source for it, so there is none to check. The quote shows it is in the paper.
In the paper
“We observed enrichment of m6A in mRNA bound by SRSF3 under both conditions.”
§ YTHDC1 mediates nuclear export of N6-methyladenosine methylated mRNAs > Results > YTHDC1 facilitates RNA binding to SRSF3 and NXF1
plainstates an association- Asserted: passes — The authors put it forward as true.
- Checkable: passes — It can be checked against evidence.
- Load-bearing: unclear — It is unclear whether the paper’s conclusions depend on it.
- Based: passes — The paper gives a reason why it holds.
- Rests on 2 assumptions not shown here.
A result the paper reports from its own data — it cites no other source for it, so there is none to check. The quote shows it is in the paper.
In the paper
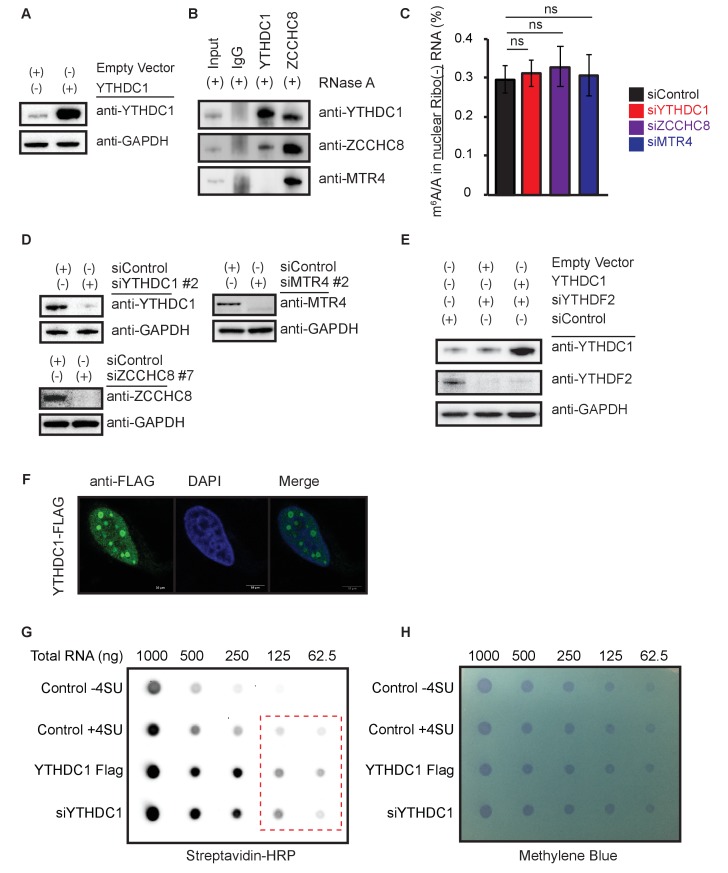
“Although YTHDC1 interacts with SRSF3, we did not observe any direct interaction between YTHDC1 and the export receptor NXF1, nor did we observe interaction between YTHDC1 and the common mRNA adaptor protein ALYREF (Figure 5A).”
§ YTHDC1 mediates nuclear export of N6-methyladenosine methylated mRNAs > Results > YTHDC1 bridges m6A selectivity to mRNA export via SRSF3
plain- Asserted: passes — The authors put it forward as true.
- Checkable: passes — It can be checked against evidence.
- Load-bearing: passes — The paper’s conclusions depend on it.
- Based: passes — The paper gives a reason why it holds.
A result the paper reports from its own data — it cites no other source for it, so there is none to check. The quote shows it is in the paper.
In the paper
“Knockdown of YTHDC1 does not affect the m6A/A ratio in mRNA transcripts from whole cell lysate, but results in accumulation of m6A in nuclear mRNA and in an accompanying cytoplasmic depletion of m6A levels (Figure 2A).”
§ YTHDC1 mediates nuclear export of N6-methyladenosine methylated mRNAs > Results > YTHDC1 mediates nuclear to cytoplasmic transport of methylated mRNAs
plain- Asserted: passes — The authors put it forward as true.
- Checkable: passes — It can be checked against evidence.
- Load-bearing: passes — The paper’s conclusions depend on it.
- Based: passes — The paper gives a reason why it holds.
82 more claims
Create a free account to see all 143 claims and to verify the 17 references still open.
- Probably not a substantial claim. 26
- It may state two separate claims as one. 35
- The quote only partly states this claim. 1
Citations
Cites
Fiji: an open-source platform for biological-image analysis
Schindelin, J., Arganda-Carreras, I., Frise, E., Kaynig, V., Longair, M., Pietzsch, T., Preibisch, S., Rueden, C., Saalfeld, S., Schmid, B., et al. (2012) · Nature Methods · doi:10.1038/nmeth.2019 · Cited by 66,890
Systematic and integrative analysis of large gene lists using DAVID bioinformatics resources
Huang, D. W., Sherman, B. T., & Lempicki, R. A. (2009) · Nature Protocols · doi:10.1038/nprot.2008.211 · Cited by 35,890
Cutadapt removes adapter sequences from high-throughput sequencing reads
Martin, M. (2011) · EMBnet.journal · doi:10.14806/ej.17.1.200 · Cited by 33,889
BEDTools: a flexible suite of utilities for comparing genomic features
Quinlan, A. R., & Hall, I. M. (2010) · Bioinformatics · doi:10.1093/bioinformatics/btq033 · Cited by 27,437
Heinz, S., Benner, C., Spann, N., Bertolino, E., Lin, Y. C., Laslo, P., Cheng, J. X., Murre, C., Singh, H., & Glass, C. K. (2010) · Molecular Cell · doi:10.1016/j.molcel.2010.05.004 · Cited by 13,382
Kim, D., Pertea, G., Trapnell, C., Pimentel, H., Kelley, R., & Salzberg, S. L. (2013) · Genome Biology · doi:10.1186/gb-2013-14-4-r36 · Cited by 12,668
Trapnell, C., Roberts, A., Goff, L. A., Pertea, G. M., Kim, D., Kelley, D. R., Pimentel, H., Salzberg, S. L., Rinn, J. L., & Pachter, L. S. (2012) · Nature Protocols · doi:10.1038/nprot.2012.016 · Cited by 12,167
Topology of the human and mouse m6A RNA methylomes revealed by m6A-seq
Dominissini, D., Moshitch-Moshkovitz, S., Schwartz, S., Salmon-Divon, M., Ungar, L., Osenberg, S., Cesarkas, K., Jacob-Hirsch, J., Amariglio, N., Kupiec, M., et al. (2012) · Nature · doi:10.1038/nature11112 · Cited by 4,884
N6-methyladenosine-dependent regulation of messenger RNA stability
Wang, X., Lu, Z., Gomez, A., Hon, G. C., Yue, Y., Han, D., Fu, Y., Parisien, M., Dai, Q., Jia, G., et al. (2014) · Nature · doi:10.1038/nature12730 · Cited by 4,558 · cited 5×
“Firefly luciferase was fused to five copies of the BoxB sequence and placed under control of a Tet-off promoter (Wang et al., 2014a).”
BackgroundMethodInfluentialSelf-citationALKBH5 Is a Mammalian RNA Demethylase that Impacts RNA Metabolism and Mouse Fertility
Zheng, G., Dahl, J. A., Niu, Y., Fedorcsak, P., Huang, C.-M., Li, C. J., Vågbø, C. B., Shi, Y., Wang, W.-L., Song, S.-H., et al. (2013) · Molecular Cell · doi:10.1016/j.molcel.2012.10.015 · Cited by 3,550
Self-citation
Cited by
Items 501–600 of 1,260
RNA‐mediated heterochromatin formation at repetitive elements in mammals
Stamidis, N., & Żylicz, J. J. (2023) · The EMBO Journal · doi:10.15252/embj.2022111717 · Cited by 26
N6-methyladenosine (m6A) methylation in kidney diseases: Mechanisms and therapeutic potential
Sun, Y., Jin, D., Zhang, Z., Ji, H., An, X., Zhang, Y., Yang, C., Sun, W., Zhang, Y., Duan, Y., et al. (2023) · Biochimica et Biophysica Acta (BBA) - Gene Regulatory Mechanisms · doi:10.1016/j.bbagrm.2023.194967 · Cited by 26
Self-citationLiang, J., Cai, H., Hou, C., Song, F., Jiang, Y., Wang, Z., Qiu, D., Zhu, Y., Wang, F., Yu, D., et al. (2023) · Clinical Science · doi:10.1042/cs20230219 · Cited by 26
Emerging Roles for DNA 6mA and RNA m6A Methylation in Mammalian Genome
Xie, L., Zhang, X., Xie, J., Xu, Y., Li, X., & Li, L. (2023) · International Journal of Molecular Sciences · doi:10.3390/ijms241813897 · Cited by 26
Arguello, A. E., Leach, R. W., & Kleiner, R. E. (2019) · Biochemistry · doi:10.1021/acs.biochem.9b00485 · Cited by 26
The N6-methyladenosine modification posttranscriptionally regulates hepatic UGT2B7 expression
Ondo, K., Isono, M., Nakano, M., Hashiba, S., Fukami, T., & Nakajima, M. (2020) · Biochemical Pharmacology · doi:10.1016/j.bcp.2020.114402 · Cited by 26
Dynamic multilayered control of m 6 A RNA demethylase activity
Jaafar, C., & Aguiar, R. C. T. (2024) · Proceedings of the National Academy of Sciences · doi:10.1073/pnas.2317847121 · Cited by 25
Decoding the interplay between m 6 A modification and stress granule stability by live-cell imaging
Li, Q., Liu, J., Guo, L., Zhang, Y., Chen, Y., Liu, H., Cheng, H., Deng, L., Qiu, J., Zhang, K., et al. (2024) · Science Advances · doi:10.1126/sciadv.adp5689 · Cited by 25
Miller, C. R., Ealy, A., Gregory, A., Janarthanam, C., Albers, W. G., Richardson, G., Jin, H., Zenitsky, G. D., Anantharam, V., Kanthasamy, A., et al. (2025) · Cell Reports · doi:10.1016/j.celrep.2025.115618 · Cited by 25
Epitranscriptomic regulation of transcriptome plasticity in development and diseases of the brain
Park, C.-W., Lee, S., & Yoon, K. (2020) · BMB Reports · doi:10.5483/bmbrep.2020.53.11.204 · Cited by 25
N6-methyladenosine RNA modification: A promising regulator in central nervous system injury
Wang, Q., Liang, Y., Luo, X., Liu, Y., Zhang, X., & Gao, L. (2021) · Experimental Neurology · doi:10.1016/j.expneurol.2021.113829 · Cited by 25
Zhao, T., Wang, M., Zhao, X., Weng, S., Qian, K., Shi, K., Gu, Y., Ying, W., Qian, X., & Zhang, Y. (2022) · Frontiers in Oncology · doi:10.3389/fonc.2022.763341 · Cited by 25
Zhang, C., Cui, H., Huang, C., Kong, F., Yang, Q., Miao, P., Cao, Z., Zhang, W., & Chang, D. (2022) · Molecular Medicine Reports · doi:10.3892/mmr.2022.12685 · Cited by 25
The Epigenetic Regulation of RNA N6-Methyladenosine Methylation in Glycolipid Metabolism
Yang, H., Li, Y., Huang, L., Fang, M., & Xu, S. (2023) · Biomolecules · doi:10.3390/biom13020273 · Cited by 25
Role of m6A methylation in retinal diseases
Zhu, X., Zhou, C., Zhao, S., & Zheng, Z. J. (2023) · Experimental Eye Research · doi:10.1016/j.exer.2023.109489 · Cited by 25
Shi, Y., Xiong, X., Sun, Y., Geng, Z., Chen, X., Cui, X., Lv, J., Ge, L., Jia, X., & Xu, J. (2023) · The FASEB Journal · doi:10.1096/fj.202202145rrr · Cited by 25
METTL3 regulates thyroid cancer differentiation and chemosensitivity by modulating PAX8
Kang, N., Zhao, Z., Wang, Z., Ning, J., Wang, H., Zhang, W., Ruan, X., Gao, M., & Zheng, X. (2024) · International Journal of Biological Sciences · doi:10.7150/ijbs.84797 · Cited by 25
New sights in cancer: Component and function of N6-methyladenosine modification
Hu, Y., Wang, S., Liu, J., Huang, Y., Gong, C., Liu, J., Xiao, Y., & Yang, S. (2019) · Biomedicine & Pharmacotherapy · doi:10.1016/j.biopha.2019.109694 · Cited by 25
Reading the m6A-encoded epitranscriptomic information in development and diseases
Chen, Y., Zhou, Z., Chen, Y., & Chen, D. (2024) · Cell & Bioscience · doi:10.1186/s13578-024-01293-7 · Cited by 24
The Potential Roles of RNA N6-Methyladenosine in Urological Tumors
Yang, L., Ge, Y., Xu, L., Xu, Z., Dou, Q., & Jia, R.-P. (2020) · Frontiers in Cell and Developmental Biology · doi:10.3389/fcell.2020.579919 · Cited by 24
m6A Modification in Mammalian Nervous System Development, Functions, Disorders, and Injuries
Yu, J., She, Y., & Ji, S. (2021) · Frontiers in Cell and Developmental Biology · doi:10.3389/fcell.2021.679662 · Cited by 24
Peng, W., Liu, F., Jiang, J., Yuan, H., Zhang, Z., Yang, L., & Mo, Y. (2022) · Genes & Diseases · doi:10.1016/j.gendis.2022.02.014 · Cited by 24
Self-citationThe role of m6A methylation in osteosarcoma biological processes and its potential clinical value
Wu, Y., Wang, Z., Shen, J., Yan, W., Xiang, S., Liu, H., & Huang, W. (2022) · Human Genomics · doi:10.1186/s40246-022-00384-1 · Cited by 24
Crosstalk between m6A regulators and mRNA during cancer progression
Niu, X., Yang, Y., Ren, Y., Zhou, S., Mao, Q., & Wang, Y. (2022) · Oncogene · doi:10.1038/s41388-022-02441-4 · Cited by 24
m6A Modification—Association with Oxidative Stress and Implications on Eye Diseases
Ni, Y., Zhang, H., Chu, L., & Zhao, Y. (2023) · Antioxidants · doi:10.3390/antiox12020510 · Cited by 24
The role of m6A demethylase FTO in chemotherapy resistance mediating acute myeloid leukemia relapse
Zhang, Z., Zhao, X., Guo, H., & Huang, X. (2023) · Cell Death Discovery · doi:10.1038/s41420-023-01505-y · Cited by 24
Self-citationRole of N6-methyladenosine RNA modification in gastric cancer
Ding, S., Zhang, X.-P., Pei, J., Bai, X., Ma, J.-J., Zhang, C., & Dai, D. (2023) · Cell Death Discovery · doi:10.1038/s41420-023-01485-z · Cited by 24
Functional Impacts of Epitranscriptomic m6A Modification on HIV-1 Infection
Mishra, T., Phillips, S. L., Huang, S., & Wu, L. J. (2024) · Viruses · doi:10.3390/v16010127 · Cited by 24
N6-methyladenosine RNA methylation in diabetic kidney disease
Huang, J., Yang, F., Liu, Y., & Wang, Y. (2024) · Biomedicine & Pharmacotherapy · doi:10.1016/j.biopha.2024.116185 · Cited by 24
Deng, X., Yu, Y. V., & Jin, Y. N. (2024) · Cell Death Discovery · doi:10.1038/s41420-024-02185-y · Cited by 24
The Regulation Network and Clinical Significance of Circular RNAs in Breast Cancer
Xu, J., Chen, X., Sun, Y., Shi, Y., Fang, T., Lv, M., Liu, C., & Jia, X. (2021) · Frontiers in Oncology · doi:10.3389/fonc.2021.691317 · Cited by 23
Orji, O. C., Stones, J., Rajani, S., Markus, R., Öz, M. D., & Knight, H. M. (2024) · Molecular Neurobiology · doi:10.1007/s12035-024-04555-0 · Cited by 23
Scutenaire, J., Plassard, D., Matelot, M., Villa, T., Zumsteg, J., Libri, D., & Séraphin, B. (2022) · Nucleic Acids Research · doi:10.1093/nar/gkac640 · Cited by 23
Shen, H., Ying, Y., Ma, X., Xie, H., Chen, S., Sun, J., Liu, Z., Wen, C., Yang, Z., Wang, X., et al. (2022) · Cell Death Discovery · doi:10.1038/s41420-022-01151-w · Cited by 23
Self-citationm6A RNA methylation in brain injury and neurodegenerative disease
Deng, J., Chen, X., Chen, A., & Zheng, X. (2022) · Frontiers in Neurology · doi:10.3389/fneur.2022.995747 · Cited by 23
Epitranscriptomic N 6 -Methyladenosine Profile of SARS-CoV-2-Infected Human Lung Epithelial Cells
Phillips, S. L., Mishra, T. K., Khadka, S., Bohan, D., Espada, C. E., Maury, W. J., & Wu, L. J. (2023) · Microbiology Spectrum · doi:10.1128/spectrum.03943-22 · Cited by 23
Zhou, H., Yan, Y., Gao, J., Ma, M., Liu, Y., Shi, X., Zhang, Q., & Xu, X. (2023) · Journal of Virology · doi:10.1128/jvi.01751-22 · Cited by 23
Epigenetic and epitranscriptomic regulation of axon regeneration
Cheng, Y., Song, H., Ming, G., & Weng, Y. (2023) · Molecular Psychiatry · doi:10.1038/s41380-023-02028-9 · Cited by 23
Sequencing methods and functional decoding of mRNA modifications
Li, K., Peng, J., & Yi, C. (2023) · Fundamental Research · doi:10.1016/j.fmre.2023.05.010 · Cited by 23
N6-methyladenosine RNA methylation in liver diseases: from mechanism to treatment
Yang, L., Tian, S., Zheng, X., Zhang, M., Zhou, X., Shang, Y., & Han, Y. (2023) · Journal of Gastroenterology · doi:10.1007/s00535-023-02008-4 · Cited by 23
RNA m6A modifications regulate crosstalk between tumor metabolism and immunity
Gu, J., Cao, H., Chen, X., Zhang, X. D., Thorne, R. F., & Liu, X. (2023) · Wiley Interdisciplinary Reviews - RNA · doi:10.1002/wrna.1829 · Cited by 23
Bai, H., Dai, Y., Fan, P., Zhou, Y., Wang, X., Chen, J., Jiao, Y., Du, C., Huang, Z., Xie, Y., et al. (2024) · Journal of Integrative Plant Biology · doi:10.1111/jipb.13770 · Cited by 23
Self-citationMETTL14 suppresses the expression of YAP1 and the stemness of triple-negative breast cancer
Bai, X., Liu, J., Zhou, S., Wu, L., Feng, X., & Zhang, P. (2024) · Journal of Experimental & Clinical Cancer Research · doi:10.1186/s13046-024-03225-2 · Cited by 23
Mechanisms of RNA N6-Methyladenosine in Hepatocellular Carcinoma: From the Perspectives of Etiology
Lu, J., Qian, J., Yin, S., Zhou, L., Zheng, S., & Zhang, W. (2020) · Frontiers in Oncology · doi:10.3389/fonc.2020.01105 · Cited by 22
GC‐content biases in protein‐coding genes act as an “mRNA identity” feature for nuclear export
Palazzo, A. F., & Kang, Y. M. (2020) · BioEssays · doi:10.1002/bies.202000197 · Cited by 22
Research advances of N6 ‐methyladenosine in diagnosis and therapy of pancreatic cancer
Chen, S., Ren, H., Zhang, X., Chang, L., Wang, Z., Wu, H., Zhang, J., Ren, J., & Zhou, L. (2022) · Journal of Clinical Laboratory Analysis · doi:10.1002/jcla.24611 · Cited by 22
Li, G., Fu, Q., Liu, C., Peng, Y., Gong, J., Li, S., Huang, Y., & Zhang, H. (2022) · Frontiers in Oncology · doi:10.3389/fonc.2022.1074307 · Cited by 22
Imbriano, C., Moresi, V., Belluti, S., Renzini, A., Cavioli, G., Maretti, E., & Molinari, S. (2023) · International Journal of Molecular Sciences · doi:10.3390/ijms242015161 · Cited by 22
Li, X., Zheng, M., Ma, S., Nie, F., Yin, Z., Liang, Y., Yan, X., Wen, W., Yu, J., Liang, Y., et al. (2024) · Leukemia · doi:10.1038/s41375-024-02451-z · Cited by 22
Deaminase-Independent Mode of Antiretroviral Action in Human and Mouse APOBEC3 Proteins
Hakata, Y., & Miyazawa, M. (2020) · Microorganisms · doi:10.3390/microorganisms8121976 · Cited by 22
Ngoc, L. N. T., Park, S. J., Cai, J., Huong, T. T., Lee, K., & Kang, H. (2021) · Plant and Cell Physiology · doi:10.1093/pcp/pcab060 · Cited by 22
Role of RNA N6-Methyladenosine Modification in Male Infertility and Genital System Tumors
Liu, S., Lao, Y., Wang, Y., Li, R., Fang, X., Wang, Y., Gao, X., & Dong, Z. (2021) · Frontiers in Cell and Developmental Biology · doi:10.3389/fcell.2021.676364 · Cited by 22
Biological function and molecular mechanism of SRSF3 in cancer and beyond (Review)
Xiong, J., Chen, Y., Wang, W., & Sun, J. (2021) · Oncology Letters · doi:10.3892/ol.2021.13139 · Cited by 22
Structures and mechanisms of the RNA m 6A writer
Deng, T., & Ma, J. (2024) · Acta Biochimica et Biophysica Sinica · doi:10.3724/abbs.2024152 · Cited by 21
RNA m6A modification: a key regulator in normal and malignant processes
Zhang, L., Lou, Y., Li, W., Guo, H., Nguyen, L. X. T., & Chen, Z. (2025) · Cell investigation. · doi:10.1016/j.clnves.2025.100023 · Cited by 21
Physio-pathological effects of m6A modification and its potential contribution to melanoma
Liao, Y., Han, P., Zhang, Y., & Ni, B. (2021) · Clinical & Translational Oncology · doi:10.1007/s12094-021-02644-3 · Cited by 21
Cai, T., Atteh, L. L., Zhang, X., Huang, C., Bai, M., Ma, H., Zhang, C., Fu, W., Gao, L., Lin, Y., et al. (2022) · Frontiers in Surgery · doi:10.3389/fsurg.2022.819335 · Cited by 21
Exploring the role of m6A modification in cancer
Wei, Y., Li, Y., & Lu, C. (2022) · PROTEOMICS · doi:10.1002/pmic.202200208 · Cited by 21
The Repertoire of RNA Modifications Orchestrates a Plethora of Cellular Responses
Adamopoulos, P. G., Athanasopoulou, K., Daneva, G. N., & Scorilas, A. (2023) · International Journal of Molecular Sciences · doi:10.3390/ijms24032387 · Cited by 21
The epigenetic landscape of oligodendrocyte lineage cells
Selcen, I., Prentice, E., & Casaccia, P. (2023) · Annals of the New York Academy of Sciences · doi:10.1111/nyas.14959 · Cited by 21
RNA m6A methylation and regulatory proteins in pulmonary arterial hypertension
Wang, Z., Zhang, Y., Shi, J.-Z., Yi, Y., Zhao, L.-L., Kou, J., He, Y., Xie, X., Zhang, S.-J., & Pang, X. (2024) · Hypertension Research · doi:10.1038/s41440-024-01607-9 · Cited by 21
The Role of N6-methyladenosine Modification in Gametogenesis and Embryogenesis: Impact on Fertility
Wang, Y., Yang, C., Sun, H., Jiang, H., Zhang, P., Huang, Y., Liu, Z., Yu, Y., Xu, Z., Xiang, H., et al. (2024) · Genomics Proteomics & Bioinformatics · doi:10.1093/gpbjnl/qzae050 · Cited by 21
YTHDC1 m6A-dependent and m6A-independent functions converge to preserve the DNA damage response
Elvira-Blázquez, D., Fernández-Justel, J. M., Arcas, A., Statello, L., Goñi, E., González, J., Ricci, B., Zaccara, S., Raimondi, I., & Huarte, M. (2024) · The EMBO Journal · doi:10.1038/s44318-024-00153-x · Cited by 21
Li, K., Yu, L., Li, X., Yang, M., Wang, M., Li, F., Li, L., Zhou, J. Z., Fu, W., & Li, L. (2024) · Biosensors and Bioelectronics · doi:10.1016/j.bios.2024.116788 · Cited by 21
RNA modifications: emerging players in the regulation of reproduction and development
Wen, J., Zhu, Q., Liu, Y., & Gou, L. (2024) · Acta Biochimica et Biophysica Sinica · doi:10.3724/abbs.2024201 · Cited by 21
Hartstock, K., & Rentmeister, A. (2018) · Chemistry - A European Journal · doi:10.1002/chem.201804043 · Cited by 21
Russell‐Hallinan, A., Watson, C. J., O’Dwyer, D., Grieve, D., & O’Neill, K. M. (2020) · Cardiovascular Drugs and Therapy · doi:10.1007/s10557-020-07019-4 · Cited by 21
Aluru, N., & Karchner, S. I. (2020) · Toxicological Sciences · doi:10.1093/toxsci/kfaa158 · Cited by 21
The Important Role of N6-methyladenosine RNA Modification in Non-Small Cell Lung Cancer
Cheng, Y., Wang, M., Zhou, J., Dong, H., Wang, S., & Xu, H. (2021) · Genes · doi:10.3390/genes12030440 · Cited by 21
Chen, H., Li, Y., Li, L., Zhu, J., Yang, Z., Zhang, J., Li, S., Xin, Y., Xia, H., & He, J. (2020) · The Journal of Gene Medicine · doi:10.1002/jgm.3249 · Cited by 20
Zhang, Y., Chen, L., Wu, X., Sun, Z., Wang, F., Wang, B., & Dong, P. (2021) · International Journal of General Medicine · doi:10.2147/ijgm.s339095 · Cited by 20
Wang, F., Zhu, Y., Cai, H., Liang, J., Wang, W., Liao, Y., Zhang, Y., Wang, C., & Hou, J. (2021) · Frontiers in Oncology · doi:10.3389/fonc.2021.738406 · Cited by 20
Lv, Y., Han, F., Liu, M., Zhang, T., Cui, G., Wang, J., Yang, Y., Yang, Y., & Yang, W. (2022) · Genomics Proteomics & Bioinformatics · doi:10.1016/j.gpb.2022.04.004 · Cited by 20
DDX5: an expectable treater for viral infection- a literature review
Hu, M., Zheng, H., Wu, J., Sun, Y., Wang, T., & Chen, S. (2022) · Annals of Translational Medicine · doi:10.21037/atm-22-2375 · Cited by 20
Catacalos-Goad, C., Krohannon, A., Somalraju, S., Meyer, K. D., Janga, S. C., & Chakrabarti, K. (2022) · PLoS Pathogens · doi:10.1371/journal.ppat.1010972 · Cited by 20
The role of m6A RNA methylation in autoimmune diseases: Novel therapeutic opportunities
Shan, Y., Chen, W., & Li, Y. (2023) · Genes & Diseases · doi:10.1016/j.gendis.2023.02.013 · Cited by 20
Jiang, X., Jin, Z., Yang, Y., Zheng, X., Chen, S., Wang, S., Zhang, X., & Qu, N. (2023) · Frontiers in Oncology · doi:10.3389/fonc.2023.1162300 · Cited by 20
MRT-ModSeq – Rapid Detection of RNA Modifications with MarathonRT
Tavares, R. D. C. A., Mahadeshwar, G. K., Wan, H., & Pyle, A. M. (2023) · Journal of Molecular Biology · doi:10.1016/j.jmb.2023.168299 · Cited by 20
Recent advances in methylation modifications of microRNA
Su, N., Yu, X., Duan, M., & Shi, N. (2023) · Genes & Diseases · doi:10.1016/j.gendis.2023.101201 · Cited by 20
Pinello, N., Song, R., Lee, Q., Calonne, E., Duan, K., Wong, E., Tieng, J., Mehravar, M., Rong, B., Lan, F., et al. (2024) · Cellular and Molecular Life Sciences · doi:10.1007/s00018-024-05261-9 · Cited by 20
Regulations of m6A and other RNA modifications and their roles in cancer
Chen, X., Guo, K., Li, J., Xu, S., Zhu, H., & Yan, G. (2024) · Frontiers of Medicine · doi:10.1007/s11684-024-1064-8 · Cited by 20
Moshitch-Moshkovitz, S., Sevilla-Sharon, M., Ashwal-Fluss, R., Glick‐Saar, E., Rechavi, G., & Dominissini, D. (2024) · Nature Reviews Methods Primers · doi:10.1038/s43586-024-00365-9 · Cited by 20
Hematopoietic stem cells: self-renewal and expansion
Li, Z., He, X., & Li, L. (2019) · Current Opinion in Hematology · doi:10.1097/moh.0000000000000506 · Cited by 20
Insights into the N6-methyladenosine mechanism and its functionality: progress and questions
Scarrow, M., Chen, N., & Sun, G. (2020) · Critical Reviews in Biotechnology · doi:10.1080/07388551.2020.1751059 · Cited by 20
Functions of RNA N6-methyladenosine modification in acute myeloid leukemia
Zheng, X. Y., & Gong, Y. (2021) · Biomarker Research · doi:10.1186/s40364-021-00293-w · Cited by 20
RNA N6-Methyladenosine Modifications and Its Roles in Alzheimer’s Disease
Zhang, R., Zhang, Y., Guo, F., Li, S., & Cui, H. (2022) · Frontiers in Cellular Neuroscience · doi:10.3389/fncel.2022.820378 · Cited by 20
The Potential Value of m6A RNA Methylation in the Development of Cancers Focus on Malignant Glioma
Chen, F., Xie, X., Chao, M., Cao, H., & Wang, L. (2022) · Frontiers in Immunology · doi:10.3389/fimmu.2022.917153 · Cited by 20
Role of m6A Methylation in the Occurrence and Development of Heart Failure
Fan, S., & Hu, Y. (2022) · Frontiers in Cardiovascular Medicine · doi:10.3389/fcvm.2022.892113 · Cited by 20
Critical Roles of N6-Methyladenosine (m6A) in Cancer and Virus Infection
Asada, K., Bolatkan, A., Takasawa, K., Komatsu, M., Kaneko, S., & Hamamoto, R. (2020) · Biomolecules · doi:10.3390/biom10071071 · Cited by 19
Roles of N6‐methyladenosine (m6A) RNA modifications in urological cancers
Wang, X., Xie, H., Ying, Y., Chen, D., & Li, J. (2020) · Journal of Cellular and Molecular Medicine · doi:10.1111/jcmm.15750 · Cited by 19
Self-citationHuang, Y., Zheng, P., Liu, X., Chen, H., & Tu, J. (2021) · Plants · doi:10.3390/plants10061101 · Cited by 19
Multiple roles of m6A methylation in epithelial–mesenchymal transition
Zhao, X., Li, X., & Li, X. (2022) · Molecular Biology Reports · doi:10.1007/s11033-022-07368-3 · Cited by 19
Zhu, X., Fu, H., Sun, J., & Xu, Q. J. (2023) · Chemico-Biological Interactions · doi:10.1016/j.cbi.2023.110376 · Cited by 19
Wang, W., Ye, W., Chen, S., Tang, Y., Chen, D., Lü, Y., Wu, Z., Huang, Z., & Ge, Y. (2023) · Cellular Signalling · doi:10.1016/j.cellsig.2023.110784 · Cited by 19
Breger, K., Kunkler, C. N., O’Leary, N. J., Hulewicz, J. P., & Brown, J. A. (2023) · Wiley Interdisciplinary Reviews - RNA · doi:10.1002/wrna.1810 · Cited by 19
A YTHDF–PABP interaction is required for m6A‐mediated organogenesis in plants
Tankmar, M. D., Reichel, M., Arribas‐Hernández, L., & Brodersen, P. (2023) · EMBO Reports · doi:10.15252/embr.202357741 · Cited by 19
Liu, Q., Qi, J., Li, W., Tian, X., Zhang, J., Liu, F., Lu, X., Zang, H., Liu, C., Ma, C., et al. (2023) · Cancer Cell International · doi:10.1186/s12935-023-03096-1 · Cited by 19
Potential role of N6-methyladenosine modification in the development of Parkinson’s disease
Zhou, J., Han, Y., & Hou, R. (2023) · Frontiers in Cell and Developmental Biology · doi:10.3389/fcell.2023.1321995 · Cited by 19
RNA modifications in the progression of liver diseases: from fatty liver to cancer
Li, S., Mehal, W. Z., & Ouyang, X. (2024) · Science China Life Sciences · doi:10.1007/s11427-023-2494-x · Cited by 19
Shi, Y., Lei, Y., Chen, M., Ma, H., Shen, T., Zhang, Y., Huang, X., Ling, W., Liu, S., Pan, Y., et al. (2024) · Journal of the American Chemical Society · doi:10.1021/jacs.4c12884 · Cited by 19
Self-citation
Metadata
- Authors
- Roundtree, I. A., Luo, G.-Z., Zhang, Z., Wang, X., Zhou, T., Cui, Y., Sha, J., Huang, X., Guerrero, L., Xie, P., He, E., Shen, B., & He, C.
- Affiliations
- Howard Hughes Medical Institute (US)
- ShanghaiTech University (CN)
- State Key Laboratory of Reproductive Medicine (CN)
- University of Chicago (US)
- Corresponding author
- Shen, Bin
- He, Chuan
- ORCID
- Venue
- eLife
- Publisher
- eLife Sciences Publications, Ltd
- Published
- 2017-10-06
- Volume
- 6
- ISSN
- 2050-084X (ISSN-L)
- PMC
- PMC5648532
- OpenAlex
- W2764301500
- Cited by
- 1,256
- References
- 59
- Citations by year
- 2026: 99 · 2025: 163 · 2024: 199 · 2023: 198 · 2022: 201 · 2021: 181 · 2020: 114 · 2019: 57 · 2018: 43
- FWCI
- 20.75
- Type
- journal article
- Language
- en
- Open access
- gold
- doi.org
- Licence
- Locations
- eLife (publishedVersion, cc-by)
- PubMed Central (publishedVersion, cc-by)
- Europe PMC (PubMed Central) (publishedVersion, cc-by)
- PubMed (publishedVersion)
- Knowledge@UChicago (University of Chicago) (submittedVersion, cc-by-nc-nd)
- DOAJ (DOAJ: Directory of Open Access Journals) (submittedVersion, cc-by-sa)
- University of Chicago (cc-by)
- Funders
- National Institute of General Medical Sciences (F30GM117646, HG008688, GM113194)
- Howard Hughes Medical Institute
- National Science Foundation (CHE-1048528)
- National Natural Science Foundation of China (31171377, 31471400)
- Topics
- Life Sciences › Biochemistry, Genetics and Molecular Biology › Molecular Biology › RNA modifications and cancer
- Life Sciences › Biochemistry, Genetics and Molecular Biology › Molecular Biology › RNA Research and Splicing
- Life Sciences › Biochemistry, Genetics and Molecular Biology › Molecular Biology › RNA regulation and disease
- Keywords
- YTHDC1, N6-methyladenosine, m6A reader proteins, mRNA export, mRNA splicing, SRSF3, NXF1, mRNA modification, RNA metabolism
- MeSH terms
- Serine-Arginine Splicing Factors, RNA Splicing Factors, Adenosine, HeLa Cells, Humans, Nerve Tissue Proteins, Protein Binding, RNA, Messenger, RNA-Binding Proteins, Active Transport, Cell Nucleus, Nucleocytoplasmic Transport Proteins, Gene Knockdown Techniques
About these checks
Registry, retraction, Cites and statistics results are computed, not judged, with one exception: a printed reference that no index lists is read once by a model before it counts as a citation error. Claims are extracted by a model and kept only when their quote appears verbatim in the text; each cited source is then checked, with a model’s help, for whether it says what the claim relies on. Those verdicts can be wrong — read the claim’s quote and the cited source before relying on one.
A language model drew the claims from the paper on 2026-11-13, under version 3 of the claim definition (model deepseek-v4.1-flash, prompt extract-v3).
A second model labelled each claim on 2026-11-13 (model jev-1.13-20260917, definition revision gold-guideline-v0.2).
Statistics and arithmetic are recomputed, not judged.
Confidence bands are shown only for fields calibrated on our annotated test set. None is calibrated yet, so no band is shown.
What counts as a claim ›How we measure confidence ›How we check this ›
Are you an author, or do you see a problem with this page? Request a review
Data sources
Bibliographic data: Semantic Scholar, OpenAlex, Crossref.
Contains information from the Semantic Scholar Academic Graph Datasets, made available under the ODC Attribution License (ODC-BY 1.0).
Semantic Scholar’s data is described in: Kinney, R., et al. (2023). The Semantic Scholar Open Data Platform. arXiv:2301.10140.
