

The DOI matches its Crossref record; 108 of the 108 references it cites were found in a registry or an index.
Transcriptomic analyses reveal rhythmic and CLOCK-driven pathways in human skeletal muscle
Open accessAbstract
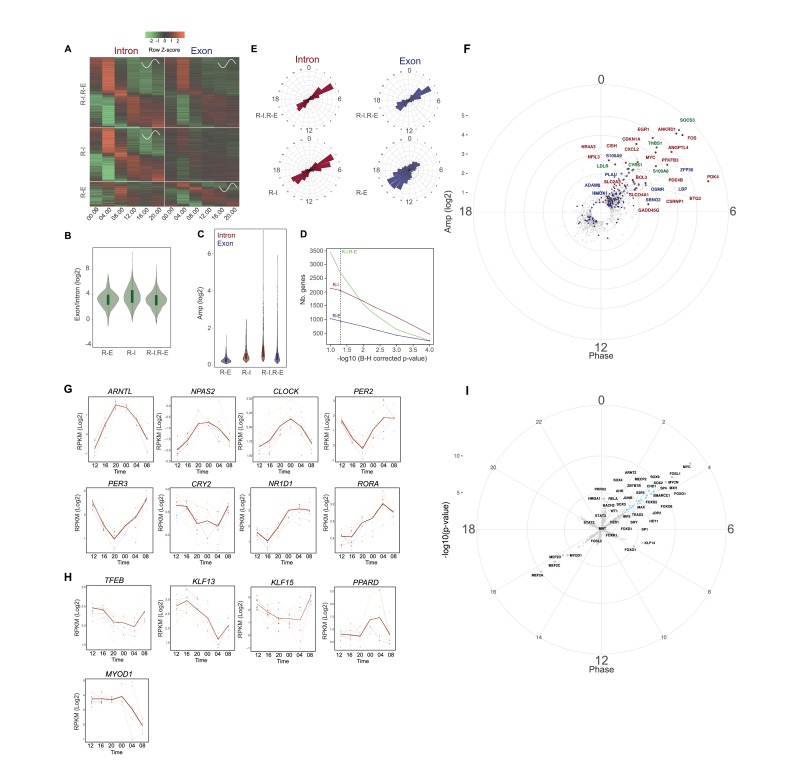
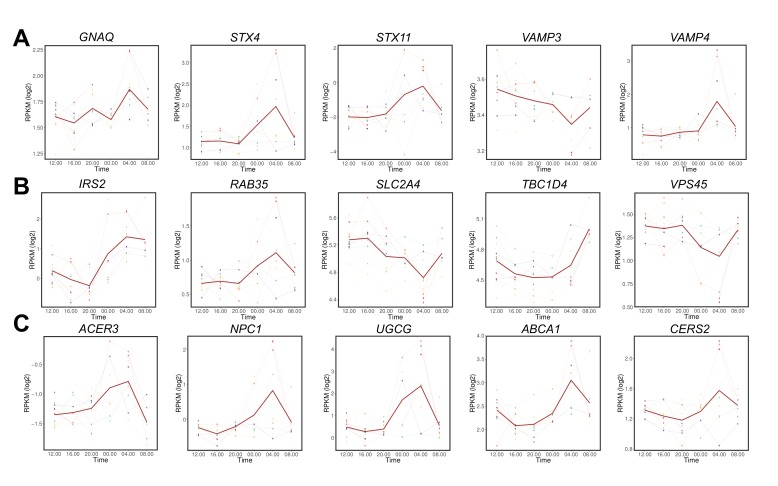
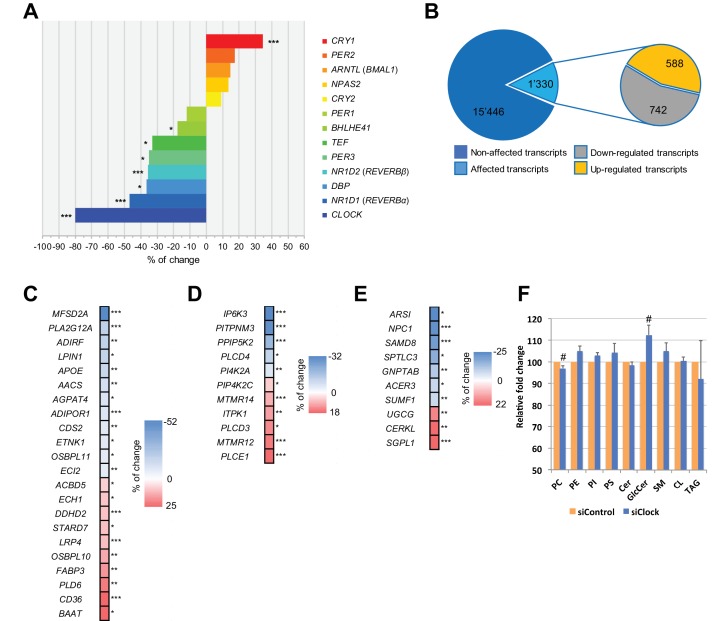
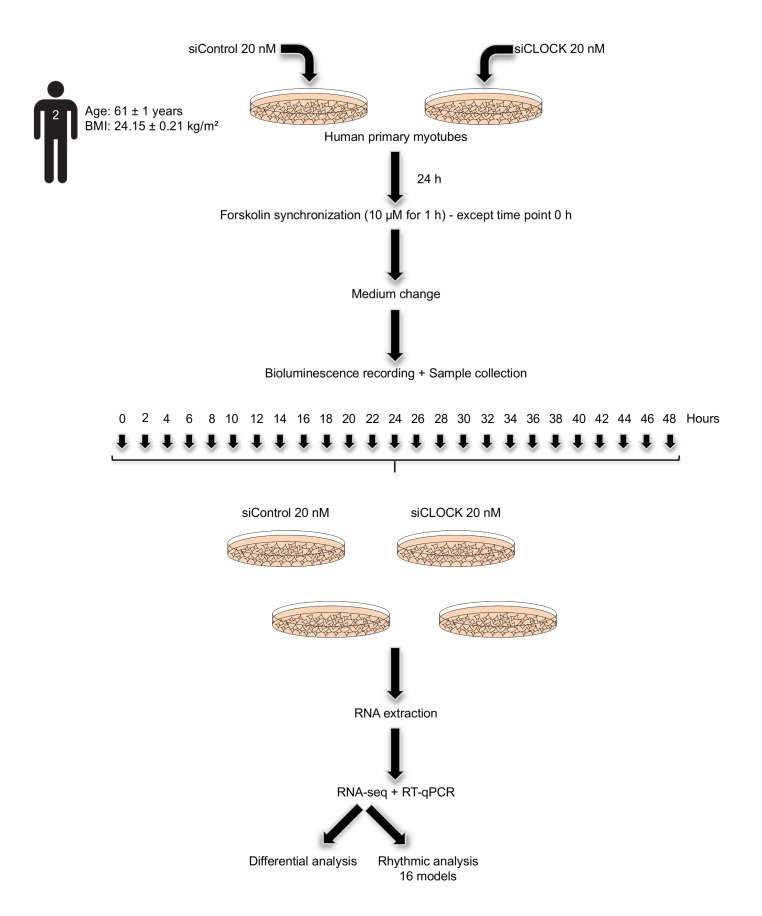
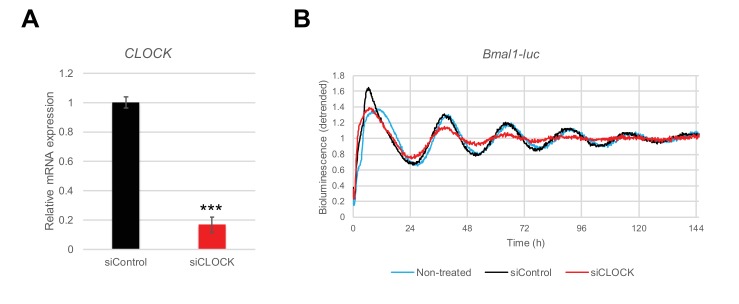
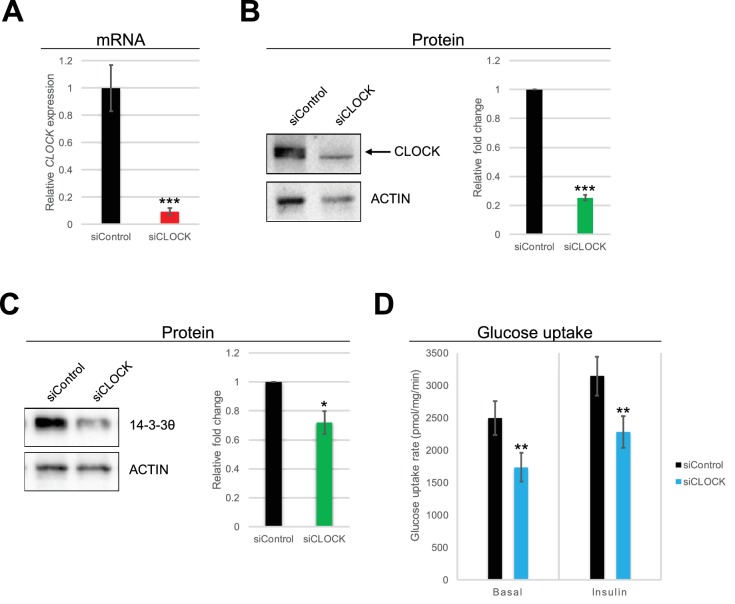
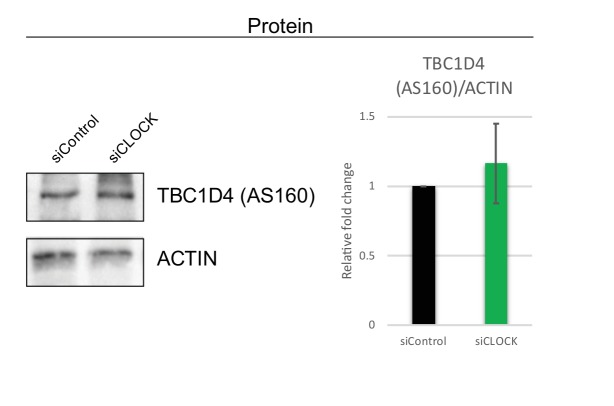
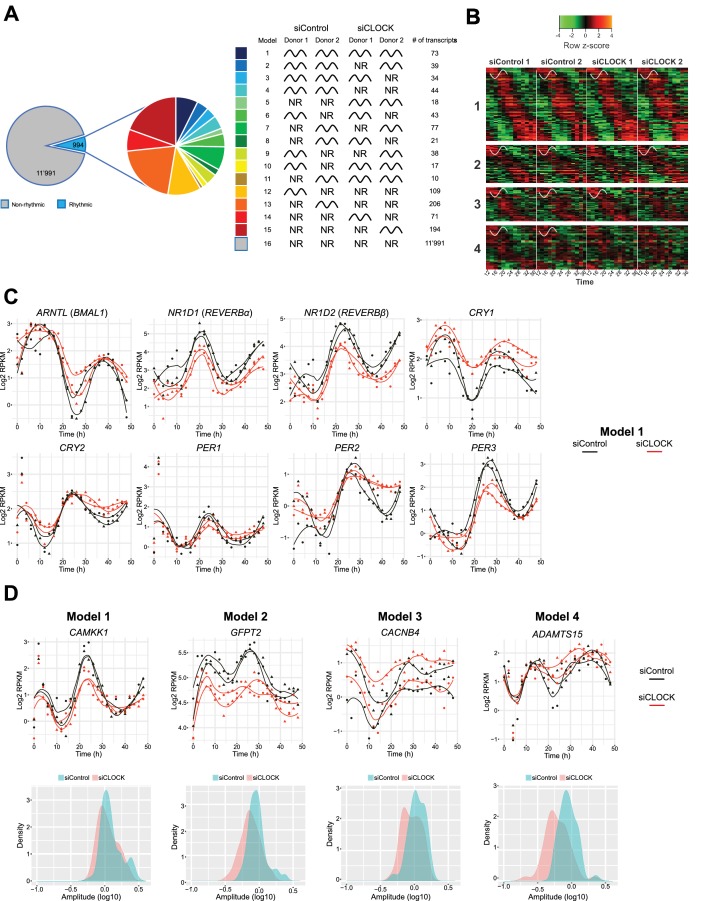
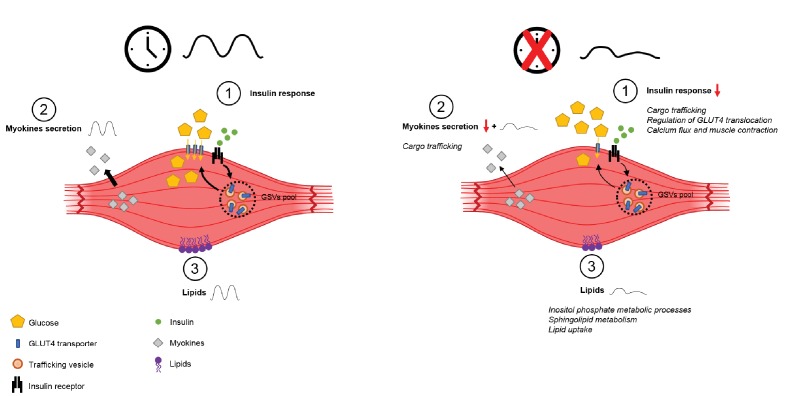
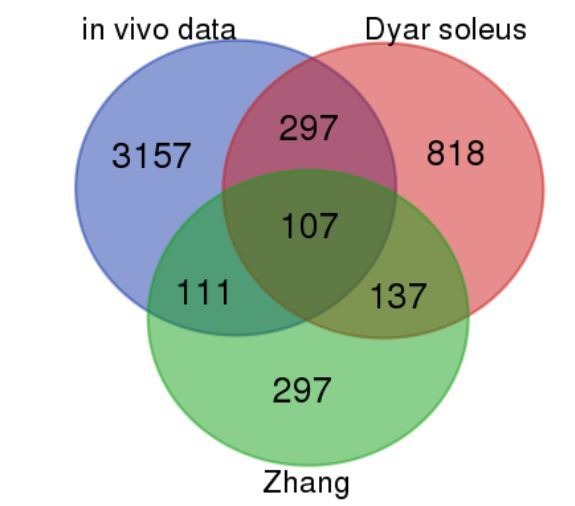
Circadian regulation of transcriptional processes has a broad impact on cell metabolism. Here, we compared the diurnal transcriptome of human skeletal muscle conducted on serial muscle biopsies in vivo with profiles of human skeletal myotubes synchronized in vitro. More extensive rhythmic transcription was observed in human skeletal muscle compared to in vitro cell culture as a large part of the in vivo mRNA rhythmicity was lost in vitro. siRNA-mediated clock disruption in primary myotubes significantly affected the expression of ~8% of all genes, with impact on glucose homeostasis and lipid metabolism. Genes involved in GLUT4 expression, translocation and recycling were negatively affected, whereas lipid metabolic genes were altered to promote activation of lipid utilization. Moreover, basal and insulin-stimulated glucose uptake were significantly reduced upon CLOCK depletion. Our findings suggest an essential role for the circadian coordination of skeletal muscle glucose homeostasis and lipid metabolism in humans.
Overview
The claims and statistics of this paper haven’t been checked yet.
Run the check — free, no account needed. It reads the open-access text and checks the sources it cites.
Integrity signals
Registry
Cites
Statistics
Figures
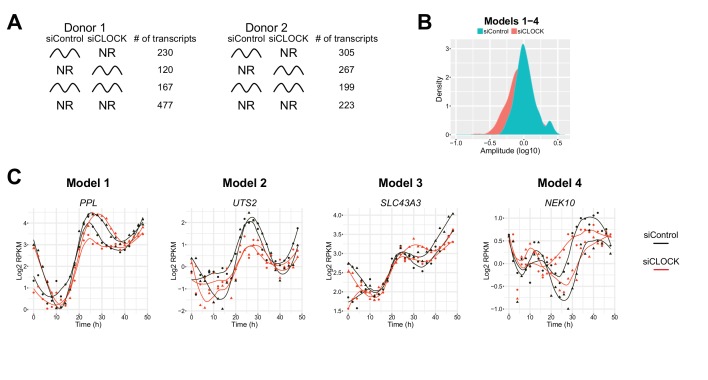
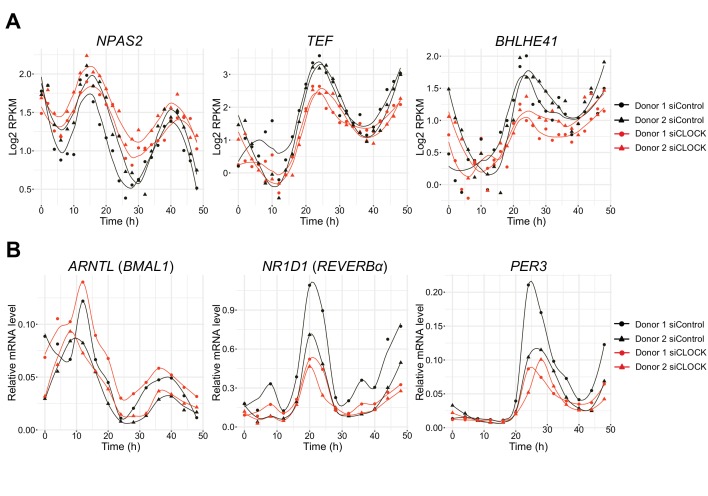
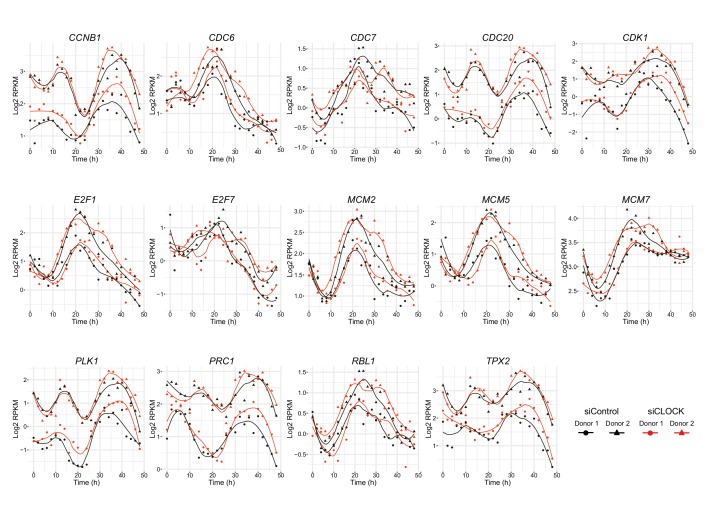
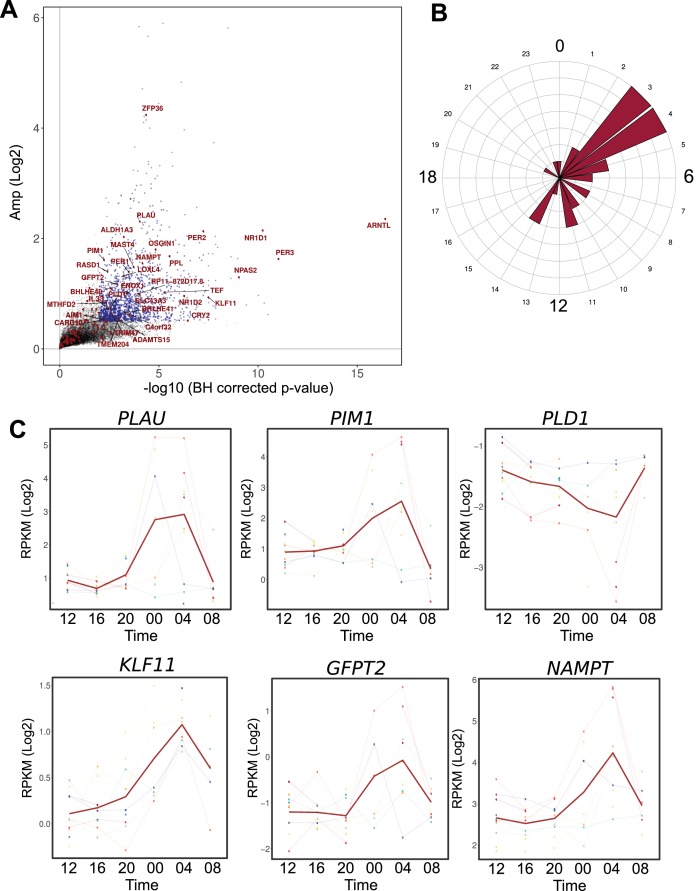
Verification
Claims the paper makes
The claims and statistics of this paper haven’t been checked yet.
Run the check — free, no account needed. It reads the open-access text and checks the sources it cites.
Claims other papers make about this one
Each is checked against this paper’s own text: does it say what the citing paper says it does?
The cited source says what the claim attributes to it.
In the citing paper
“These results are consistent with the human data reported from two timepoints by Zambon et al. (2003) and demonstrate that the molecular clock is functional within human muscles (Perrin et al., 2018).”
From Myosteatosis in the Context of Skeletal Muscle Function Deficit: An Interdisciplinary Workshop at the National Institute on Aging (2020) · cites this paper as Perrin et al., 2018
In the citing paper
“Similarly, in human studies, muscle biopsies over 24 h, find clock gene expression in the vastus lateralis muscle with a pattern similar to the mouse model when considering the active vs. inactive times of the day.”
From Myosteatosis in the Context of Skeletal Muscle Function Deficit: An Interdisciplinary Workshop at the National Institute on Aging (2020) · cites this paper as Perrin et al., 2018
Self-check
Percentages, sums and reported differences re-computed from the paper’s own numbers.
The self-check needs the paper’s full text.
Citations
Cites
Fitting Linear Mixed-Effects Models Using lme4
Bates, D., Mächler, M., Bolker, B., & Walker, S. (2015) · Journal of Statistical Software · doi:10.18637/jss.v067.i01 · Cited by 86,835
STAR: ultrafast universal RNA-seq aligner
Dobin, A., Davis, C. A., Schlesinger, F., Drenkow, J., Zaleski, C., Jha, S., Batut, P., Chaisson, M., & Gingeras, T. R. (2013) · Bioinformatics · doi:10.1093/bioinformatics/bts635 · Cited by 51,709
Robinson, M. D., McCarthy, D. J., & Smyth, G. K. (2010) · Bioinformatics · doi:10.1093/bioinformatics/btp616 · Cited by 41,364
BEDTools: a flexible suite of utilities for comparing genomic features
Quinlan, A. R., & Hall, I. M. (2010) · Bioinformatics · doi:10.1093/bioinformatics/btq033 · Cited by 27,437
A scaling normalization method for differential expression analysis of RNA-seq data
Robinson, M. D., & Oshlack, A. (2010) · Genome Biology · doi:10.1186/gb-2010-11-3-r25 · Cited by 7,876
Lipid extraction by methyl-tert-butyl ether for high-throughput lipidomics
Matyash, V., Liebisch, G., Kurzchalia, T. V., Shevchenko, A., & Schwudke, D. (2008) · Journal of Lipid Research · doi:10.1194/jlr.d700041-jlr200 · Cited by 2,633
A circadian gene expression atlas in mammals: Implications for biology and medicine
Zhang, R., Lahens, N. F., Ballance, H. I., Hughes, M. E., & Hogenesch, J. B. (2014) · Proceedings of the National Academy of Sciences · doi:10.1073/pnas.1408886111 · Cited by 2,304
Skeletal Muscle Insulin Resistance Is the Primary Defect in Type 2 Diabetes
DeFronzo, R. A., & Tripathy, D. (2009) · Diabetes Care · doi:10.2337/dc09-s302 · Cited by 2,102 · cited 1×
“Muscle clock alteration impairs glucose uptake in response to insulin Skeletal muscle is responsible for 70–80% of insulin-stimulated glucose uptake (DeFronzo and Tripathy, 2009).”
BackgroundMi, H., Huang, X., Muruganujan, A., Tang, H., Mills, C., Kang, D. S., & Thomas, P. D. (2016) · Nucleic Acids Research · doi:10.1093/nar/gkw1138 · Cited by 1,985
DeFronzo, R. A., Jacot, E., Jequier, E., Maeder, E., Wahren, J., & Felber, J. P. (1981) · Diabetes · doi:10.2337/diab.30.12.1000 · Cited by 1,770
Research works printed but not linked: 1
- Bergstrom, 1962, Muscle Electrolytes in Man - Determined by Neutron Activation Analysis on Needle Biopsy Specimens - Study on Normal Subjects, Kidney Patients, and Patients with Chronic Diarrhoea, Scandinavian Journal of Clinical and Laboratory Investigation, 14
Cited by
Sorted by citations
Correa-de-Araujo, R., Addison, O., Miljkovic, I., Goodpaster, B. H., Bergman, B. C., Clark, R. V., Elena, J. W., Esser, K. A., Ferrucci, L., Harris-Love, M. O., et al. (2020) · Frontiers in Physiology · doi:10.3389/fphys.2020.00963 · Cited by 468
Circadian rhythms and exercise — re-setting the clock in metabolic disease
Gabriel, B. M., & Zierath, J. R. (2019) · Nature Reviews Endocrinology · doi:10.1038/s41574-018-0150-x · Cited by 382
Time of exercise specifies the impact on muscle metabolic pathways and systemic energy homeostasis
Sato, S., Basse, A. L., Schönke, M., Chen, S., Samad, M., Altıntaş, A., Laker, R. C., Dalbram, E., Barrès, R., Baldi, P., et al. (2019) · Cell Metabolism · doi:10.1016/j.cmet.2019.03.013 · Cited by 298
Flanagan, A., Bechtold, D. A., Pot, G. K., & Johnston, J. D. (2020) · Journal of Neurochemistry · doi:10.1111/jnc.15246 · Cited by 258
Roberts, M. D., McCarthy, J. J., Hornberger, T. A., Phillips, S. M., Mackey, A. L., Nader, G. A., Boppart, M. D., Kavazis, A. N., Reidy, P. T., Ogasawara, R., et al. (2023) · Physiological Reviews · doi:10.1152/physrev.00039.2022 · Cited by 214
Physiological and Molecular Dissection of Daily Variance in Exercise Capacity
Ezagouri, S., Zwighaft, Z., Sobel, J., Baillieul, S., Doutreleau, S., Ladeuix, B., Golik, M., Vergès, S., & Asher, G. (2019) · Cell Metabolism · doi:10.1016/j.cmet.2019.03.012 · Cited by 177
Sex-dimorphic and age-dependent organization of 24-hour gene expression rhythms in humans
Talamanca, L., Gobet, C., & Naef, F. (2023) · Science · doi:10.1126/science.add0846 · Cited by 175
Lipid metabolism around the body clocks
Petrenko, V., Sinturel, F., Riezman, H., & Dibner, C. (2023) · Progress in Lipid Research · doi:10.1016/j.plipres.2023.101235 · Cited by 171
Dyar, K. A., Hubert, M. J., Mir, A. A., Ciciliot, S., Lutter, D., Greulich, F., Quagliarini, F., Kleinert, M., Fischer, K., Eichmann, T. O., et al. (2018) · PLoS Biology · doi:10.1371/journal.pbio.2005886 · Cited by 159
Cedernaes, J., Schönke, M., Westholm, J. O., Mi, J., Chibalin, A., Voisin, S., Osler, M., Vogel, H., Hörnaeus, K., Dickson, S. L., et al. (2018) · Science Advances · doi:10.1126/sciadv.aar8590 · Cited by 137
Lundell, L. S., Parr, E. B., Devlin, B. L., Ingerslev, L. R., Altıntaş, A., Sato, S., Sassone‐Corsi, P., Barrès, R., Zierath, J. R., & Hawley, J. A. (2020) · Nature Communications · doi:10.1038/s41467-020-18412-w · Cited by 135
Templeman, I., Smith, H. A., Chowdhury, E., Chen, Y.-C., Carroll, H., Johnson-Bonson, D., Hengist, A., Smith, R., Creighton, J., Clayton, D., et al. (2021) · Science Translational Medicine · doi:10.1126/scitranslmed.abd8034 · Cited by 113
Self-citationPetrenko, V., Gandasi, N. R., Sage, D., Tengholm, A., Barg, S., & Dibner, C. (2020) · Proceedings of the National Academy of Sciences · doi:10.1073/pnas.1916539117 · Cited by 104
Coupled network of the circadian clocks: a driving force of rhythmic physiology
Finger, A., Dibner, C., & Kramer, A. (2020) · FEBS Letters · doi:10.1002/1873-3468.13898 · Cited by 101
Metabolism and exercise: the skeletal muscle clock takes centre stage
Martin, R. A., Viggars, M. R., & Esser, K. A. (2023) · Nature Reviews Endocrinology · doi:10.1038/s41574-023-00805-8 · Cited by 109
Time-of-day dependent effects of contractile activity on the phase of the skeletal muscle clock
Kemler, D., Wolff, C. A., & Esser, K. A. (2020) · The Journal of Physiology · doi:10.1113/jp279779 · Cited by 87
Christou, S., Wehrens, S. M. T., Isherwood, C., Möller‐Levet, C. S., Wu, H., Revell, V. L., Bucca, G., Skene, D. J., Laing, E., Archer, S. N., et al. (2019) · Scientific Reports · doi:10.1038/s41598-019-39668-3 · Cited by 91
Squyres, G. R., Holmes, M. J., Barger, S. R., Pennycook, B. R., Ryan, J., Yan, V., & Garner, E. C. (2021) · Nature Microbiology · doi:10.1038/s41564-021-00878-z · Cited by 86
Time-of-Day Effects on Short-Duration Maximal Exercise Performance
Mirizio, G. G., Nunes, R. S. M., Vargas, D. A., Foster, C., & Vieira, E. C. (2020) · Scientific Reports · doi:10.1038/s41598-020-66342-w · Cited by 81
Time of Day and Muscle Strength: A Circadian Output?
Douglas, C. M., Hesketh, S. J., & Esser, K. A. (2020) · Physiology · doi:10.1152/physiol.00030.2020 · Cited by 80
Curtis, W. M., Seeds, W. A., Mattson, M. P., & Bradshaw, P. C. (2022) · Cells · doi:10.3390/cells11152416 · Cited by 72
Why Lungs Keep Time: Circadian Rhythms and Lung Immunity
Nosal, C. R., Ehlers, A., & Haspel, J. A. (2019) · Annual Review of Physiology · doi:10.1146/annurev-physiol-021119-034602 · Cited by 70
Circadian Clocks Make Metabolism Run
Sinturel, F., Petrenko, V., & Dibner, C. (2020) · Journal of Molecular Biology · doi:10.1016/j.jmb.2020.01.018 · Cited by 66
Human skeletal muscle fiber heterogeneity beyond myosin heavy chains
Moreno‐Justicia, R., der Stede, T. V., Stocks, B., Laitila, J. M., Seaborne, R. A. E., de Loock, A. V., Lievens, E., Samodova, D., Marín-Arraiza, L., Dmytriyeva, O., et al. (2025) · Nature Communications · doi:10.1038/s41467-025-56896-6 · Cited by 71
Fernandez‐Gonzalo, R., Tesch, P. A., Lundberg, T. R., Alkner, B. A., Rullman, E., & Gustafsson, T. P. (2020) · The FASEB Journal · doi:10.1096/fj.201902976r · Cited by 59
Proteomics in Circadian Biology
Mauvoisin, D., & Gachon, F. (2019) · Journal of Molecular Biology · doi:10.1016/j.jmb.2019.12.004 · Cited by 55
Ticking for Metabolic Health: The Skeletal‐Muscle Clocks
Gutierrez‐Monreal, M. A., Harmsen, J., Schrauwen, P., & Esser, K. A. (2020) · Obesity · doi:10.1002/oby.22826 · Cited by 63
Contraction influences Per2 gene expression in skeletal muscle through a calcium‐dependent pathway
Small, L., Altıntaş, A., Laker, R. C., Ehrlich, A. M., Pattamaprapanont, P., Villarroel, J., Pillon, N. J., Zierath, J. R., & Barrès, R. (2020) · The Journal of Physiology · doi:10.1113/jp280428 · Cited by 57
Nutrient timing and metabolic regulation
Smith, H. A., & Betts, J. A. (2022) · The Journal of Physiology · doi:10.1113/jp280756 · Cited by 54
Skeletal muscle in healthy humans exhibits a day-night rhythm in lipid metabolism
Held, N. M., Wefers, J., van Weeghel, M., Daemen, S., Hansen, J., Vaz, F. M., van Moorsel, D., Hesselink, M. K. C., Houtkooper, R. H., & Schrauwen, P. (2020) · Molecular Metabolism · doi:10.1016/j.molmet.2020.100989 · Cited by 53
Clock proteins and training modify exercise capacity in a daytime-dependent manner
Adamovich, Y., Dandavate, V., Ezagouri, S., Manella, G., Zwighaft, Z., Sobel, J., Kuperman, Y., Golik, M., Auerbach, A., Itkin, M., et al. (2021) · Proceedings of the National Academy of Sciences · doi:10.1073/pnas.2101115118 · Cited by 54
Wefers, J., Connell, N. J., Fealy, C. E., Andriessen, C., de Wit‐Verheggen, V. H. W., van Moorsel, D., Moonen‐Kornips, E., Jörgensen, J. A., Hesselink, M. K. C., Havekes, B., et al. (2020) · Molecular Metabolism · doi:10.1016/j.molmet.2020.101050 · Cited by 51
Maier, G., Delezie, J., Westermark, P. O., Santos, G., Ritz, D., & Handschin, C. (2021) · The Journal of Physiology · doi:10.1113/jp281535 · Cited by 52
A population-based gene expression signature of molecular clock phase from a single epidermal sample
Wu, G., Ruben, M. D., Francey, L. J., Smith, D. F., Sherrill, J. D., Oblong, J. E., Mills, K. J., & Hogenesch, J. B. (2020) · Genome Medicine · doi:10.1186/s13073-020-00768-9 · Cited by 49
Circadian Gene Expression Rhythms During Critical Illness
Maas, M. B., Iwanaszko, M., Lizza, B. D., Reid, K. J., Braun, R., & Zee, P. C. (2020) · Critical Care Medicine · doi:10.1097/ccm.0000000000004697 · Cited by 52
The importance of being rhythmic: Living in harmony with your body clocks
Dibner, C. (2019) · Acta Physiologica · doi:10.1111/apha.13281 · Cited by 52
Hunt, L. C., Jiao, J., Wang, Y., Finkelstein, D., Rao, D., Curley, M., Robles‐Murguia, M., Shirinifard, A., Pagala, V., Peng, J., et al. (2019) · Genome Research · doi:10.1101/gr.246884.118 · Cited by 42
Time for Exercise? Exercise and Its Influence on the Skeletal Muscle Clock
Martin, R. A., & Esser, K. A. (2022) · Journal of Biological Rhythms · doi:10.1177/07487304221122662 · Cited by 45
Circadian rhythm of lipid metabolism
Sinturel, F., Spaleniak, W., & Dibner, C. (2022) · Biochemical Society Transactions · doi:10.1042/bst20210508 · Cited by 43
Clocking In, Working Out: Circadian Regulation of Exercise Physiology
Duglan, D., & Lamia, K. A. (2019) · Trends in Endocrinology and Metabolism · doi:10.1016/j.tem.2019.04.003 · Cited by 43
Circadian regulation of muscle growth independent of locomotor activity
Kelu, J. J., Pipalia, T. G., & Hughes, S. M. (2020) · Proceedings of the National Academy of Sciences · doi:10.1073/pnas.2012450117 · Cited by 35
Cavieres-Lepe, J., & Ewer, J. (2021) · Frontiers in Molecular Neuroscience · doi:10.3389/fnmol.2021.666673 · Cited by 40
de Goede, P., Wüst, R. C. I., Schomakers, B. V., Denis, S. W., Vaz, F. M., Pras‐Raves, M. L., van Weeghel, M., Yi, C., Kalsbeek, A., & Houtkooper, R. H. (2022) · The FASEB Journal · doi:10.1096/fj.202100707r · Cited by 36
Circadian NAD(P)(H) cycles in cell metabolism
Levine, D. C., Ramsey, K. M., & Bass, J. T. (2021) · Seminars in Cell and Developmental Biology · doi:10.1016/j.semcdb.2021.07.008 · Cited by 33
The 24-hour molecular landscape after exercise in humans reveals MYC is sufficient for muscle growth
Edman, S., Jones, R. G., Jannig, P. R., Fernandez‐Gonzalo, R., Norrbom, J., Thomas, N. T., Khadgi, S., Koopmans, P. J., da Silva, F. M., Chambers, T. L., et al. (2024) · EMBO Reports · doi:10.1038/s44319-024-00299-z · Cited by 44
Yu, R., Tian, L., Yi, D., Gao, Y., Li, D., & Tang, Y. (2019) · Diabetes Research and Clinical Practice · doi:10.1016/j.diabres.2019.107831 · Cited by 31
Diurnal Regulation of Peripheral Glucose Metabolism: Potential Effects of Exercise Timing
Mancilla, R., Krook, A., Schrauwen, P., & Hesselink, M. K. C. (2020) · Obesity · doi:10.1002/oby.22811 · Cited by 29
Walzik, D., Jonas, W., Joisten, N., Belen, S., Wüst, R. C. I., Guillemin, G. J., & Zimmer, P. (2023) · Acta Physiologica · doi:10.1111/apha.13921 · Cited by 33
Effect of a single bout of exercise on clock gene expression in human leukocyte
Tanaka, Y., Ogata, H., Kayaba, M., Ando, A., Park, I., Yajima, K., Araki, A., Suzuki, C., Osumi, H., Zhang, S., et al. (2020) · Journal of Applied Physiology · doi:10.1152/japplphysiol.00891.2019 · Cited by 28
Brito, L. C., Marin, T. C., Azevêdo, L. M., Rosa‐Silva, J. M., Shea, S. A., & Thosar, S. S. (2022) · Comprehensive physiology · doi:10.1002/cphy.c210036 · Cited by 45
Circadian Clock-Controlled Checkpoints in the Pathogenesis of Complex Disease
Li, M., Xin, H., Yuan, Y., Yang, X., Li, H., Tian, D., Zhang, H., Zhang, Z., Han, T.-L., Chen, Q., et al. (2021) · Frontiers in Genetics · doi:10.3389/fgene.2021.721231 · Cited by 29
Time to Train: The Involvement of the Molecular Clock in Exercise Adaptation of Skeletal Muscle
Mansingh, S., & Handschin, C. (2022) · Frontiers in Physiology · doi:10.3389/fphys.2022.902031 · Cited by 29
Skeletal muscle gene expression dysregulation in long-term spaceflights and aging is clock-dependent
Malhan, D., Yalçın, M., Schoenrock, B., Blottner, D., & Relógio, A. (2023) · npj Microgravity · doi:10.1038/s41526-023-00273-4 · Cited by 28
der Stede, T. V., de Loock, A. V., Turiel, G., Hansen, C. C., Tamariz‐Ellemann, A., Ullrich, M., Lievens, E., Spaas, J., Yigit, N., Anckaert, J., et al. (2025) · Cell Metabolism · doi:10.1016/j.cmet.2024.12.011 · Cited by 26
Rong, B., Wu, Q., Saeed, M., & Sun, C. (2021) · Animal nutrition · doi:10.1016/j.aninu.2021.09.009 · Cited by 24
Astrocyte Clocks and Glucose Homeostasis
Barca‐Mayo, O., & López, M. (2021) · Frontiers in Endocrinology · doi:10.3389/fendo.2021.662017 · Cited by 23
Petrenko, V., Sinturel, F., Loizides‐Mangold, U., Montoya, J. P., Chera, S., Riezman, H., & Dibner, C. (2022) · PLoS Biology · doi:10.1371/journal.pbio.3001725 · Cited by 23
The clockwork of champions: Influence of circadian biology on exercise performance
Hesketh, S. J., & Esser, K. A. (2024) · Free Radical Biology and Medicine · doi:10.1016/j.freeradbiomed.2024.08.020 · Cited by 22
Harmsen, J., van Weeghel, M., Parsons, R., Janssens, G. E., Wefers, J., van Moorsel, D., Hansen, J., Hoeks, J., Hesselink, M. K. C., Houtkooper, R. H., et al. (2022) · Cell Reports · doi:10.1016/j.celrep.2022.111786 · Cited by 20
Sinturel, F., Makhlouf, A., Meyer, P., Tran, C., Pataky, Z., Golay, A., Rey, G., Howald, C., Dermitzakis, E. T., Pichard, C., et al. (2019) · Diabetologia · doi:10.1007/s00125-019-4907-0 · Cited by 20
Procopio, S. B., & Esser, K. A. (2024) · Journal of Molecular and Cellular Cardiology · doi:10.1016/j.yjmcc.2024.11.011 · Cited by 19
Kelu, J. J., & Hughes, S. M. (2025) · Proceedings of the National Academy of Sciences · doi:10.1073/pnas.2422446122 · Cited by 20
Circadian Rhythm Effects on the Molecular Regulation of Physiological Systems
Crislip, G. R., Johnston, J. G., Douma, L. G., Costello, H. M., Juffre, A., Boyd, K., Li, W. W., Maugans, C. C., Gutierrez‐Monreal, M. A., Esser, K. A., et al. (2021) · Comprehensive physiology · doi:10.1002/cphy.c210011 · Cited by 36
Sutton, E. R., & Pekovic‐Vaughan, V. (2025) · Antioxidants · doi:10.3390/antiox14091132 · Cited by 20
More than the clock: distinct regulation of muscle function and metabolism by PER2 and RORα
Mansingh, S., Maier, G., Delezie, J., Westermark, P. O., Ritz, D., Duchemin, W., Santos, G., Karrer‐Cardel, B., Steurer, S. A., Albrecht, U., et al. (2024) · The Journal of Physiology · doi:10.1113/jp285585 · Cited by 18
Carbohydrate intake and circadian synchronicity in the regulation of glucose homeostasis
Zhao, L., Hutchison, A. T., & Heilbronn, L. K. (2021) · Current Opinion in Clinical Nutrition & Metabolic Care · doi:10.1097/mco.0000000000000756 · Cited by 21
Regulatory roles of vertebrate Nocturnin: insights and remaining mysteries
Hughes, K. L., Abshire, E. T., & Goldstrohm, A. C. (2018) · RNA Biology · doi:10.1080/15476286.2018.1526541 · Cited by 16
der Stede, T. V., de Loock, A. V., Lievens, E., Yigit, N., Anckaert, J., Thienen, R. V., Weyns, A., Mestdagh, P., Vandesompele, J., & Derave, W. (2024) · American Journal of Physiology-Cell Physiology · doi:10.1152/ajpcell.00299.2024 · Cited by 15
Raza, G. S., Kaya, Y., Stenbäck, V., Sharma, R., Sodum, N., Mutt, S. J., Gagnon, D. D., Tulppo, M. P., Järvelin, M., Herzig, K., et al. (2024) · Molecular Nutrition & Food Research · doi:10.1002/mnfr.202300465 · Cited by 16
Unacylated ghrelin, leptin, and appetite display diurnal rhythmicity in lean adults
Templeman, I., Smith, H., Walhin, J., Middleton, B., Gonzalez, J. T., Karagounis, L. G., Johnston, J. D., & Betts, J. A. (2021) · Journal of Applied Physiology · doi:10.1152/japplphysiol.00920.2020 · Cited by 17
Johanns, M., Haas, J. T., Raverdy, V., Vandel, J., Chevalier-Dubois, J., Guille, L., Derudas, B., Legendre, B., Caiazzo, R. J., Verkindt, H., et al. (2023) · JHEP Reports · doi:10.1016/j.jhepr.2023.100948 · Cited by 13
Genome-wide circadian regulation: A unique system for computational biology
Sun, L., Ma, J., Turck, C. W., Xu, P., & Wang, G. (2020) · Computational and Structural Biotechnology Journal · doi:10.1016/j.csbj.2020.07.002 · Cited by 14
Vepkhvadze, T. F., Vorotnikov, A. V., & Popov, D. V. (2021) · Biochemistry (Moscow) · doi:10.1134/s0006297921050084 · Cited by 12
Xia, Y., Yao, B., Fu, Z., Li, L., Jin, S., Qu, B., Huang, Y., & Ding, H. (2023) · American Journal of Physiology-Regulatory, Integrative and Comparative Physiology · doi:10.1152/ajpregu.00261.2022 · Cited by 12
A Role for Exercise to Counter Skeletal Muscle Clock Disruption
Erickson, M. L., Esser, K. A., Kraus, W. E., Buford, T. W., & Redman, L. M. (2020) · Exercise and Sport Sciences Reviews · doi:10.1249/jes.0000000000000235 · Cited by 13
Resetting Time: The Role of Exercise Timing in Circadian Reprogramming for Metabolic Health
Hesketh, S. J. (2025) · Obesities · doi:10.3390/obesities5030059 · Cited by 13
Shon, J., Han, Y., Song, S., Kwon, S. Y., Na, K., Lindroth, A. M., & Park, Y. J. (2024) · The Journal of Nutritional Biochemistry · doi:10.1016/j.jnutbio.2024.109590 · Cited by 11
Smith, H., Templeman, I., Davis, M., Slater, T., Clayton, D. J., Varley, I., James, L. J., Middleton, B., Johnston, J. D., Karagounis, L. G., et al. (2024) · The Journal of Clinical Endocrinology & Metabolism · doi:10.1210/clinem/dgae350 · Cited by 12
Andriessen, C., Schrauwen, P., & Hoeks, J. (2020) · International Journal of Obesity · doi:10.1038/s41366-020-00719-9 · Cited by 13
Negri, M., Pivonello, C., Amatrudo, F., Cimmino, F., Trinchese, G., Vetrani, C., Iaccarino, G., Pivonello, R., Mollica, M. P., & Colao, A. (2025) · Nutrition Reviews · doi:10.1093/nutrit/nuaf007 · Cited by 15
Sex Inclusion in Transcriptome Studies of Daily Rhythms
Obodo, D., Outland, E. H., & Hughey, J. (2022) · Journal of Biological Rhythms · doi:10.1177/07487304221134160 · Cited by 11
Circadian control of Nocturnin and its regulatory role in health and disease
Kulshrestha, S., & Devkar, R. (2023) · Chronobiology International · doi:10.1080/07420528.2023.2231081 · Cited by 10
Larriba, Y., Mason, I. C., Saxena, R., Scheer, F. A. J. L., & Rueda, C. (2023) · PLoS Computational Biology · doi:10.1371/journal.pcbi.1011510 · Cited by 8
Edman, S., Jones, R. G., Jannig, P. R., Fernandez‐Gonzalo, R., Norrbom, J., Thomas, N. T., Khadgi, S., Koopmans, P. J., da Silva, F. M., Peterson, C. S., et al. (2024) · bioRxiv (Cold Spring Harbor Laboratory) · doi:10.1101/2024.03.26.586857 · Cited by 8
Carriel‐Nesvara, A., Muñoz-Medina, C., Deldicque, L., & Castro‐Sepúlveda, M. (2025) · The Journal of Physiology · doi:10.1113/jp289019 · Cited by 8
Running skeletal muscle clocks on time— the determining factors
Vaca-Dempere, M., Kumar, A., Sica, V., & Muñoz‐Cánoves, P. (2022) · Experimental Cell Research · doi:10.1016/j.yexcr.2021.112989 · Cited by 7
Tran, N. Q. V., Le, M., Nguyen, T.-A., Kondo, T., & Nakao, A. (2023) · International Journal of Molecular Sciences · doi:10.3390/ijms24087477 · Cited by 8
Physiological rhythms and metabolic regulation: Shining light on skeletal muscle
Betts, J. A., Davies, K. A. B., Smith, H., & Hawley, J. A. (2025) · Experimental Physiology · doi:10.1113/ep091890 · Cited by 7
Quantification of circadian rhythms in mammalian lung tissue snapshot data
Grabe, S., Ananthasubramaniam, B., & Herzel, H. (2024) · Scientific Reports · doi:10.1038/s41598-024-66694-7 · Cited by 7
The Link Between Dietary Timing and Exercise Performance Through Adipocyte AMPKα2 Signaling
Kim, S., Baek, J., & Kim, M. S. (2025) · International Journal of Molecular Sciences · doi:10.3390/ijms26136061 · Cited by 6
Hansen, S. B., Frederiksen, J. S. S., Lodberg, A., Poulsen, M. F., Andersen, C. B. F., Oster, H., Jessen, N., & Jørgensen, J. O. L. (2025) · The Journal of Clinical Endocrinology & Metabolism · doi:10.1210/clinem/dgaf564 · Cited by 5
Tuned by time: the role of circadian rhythms in metabolic energy sensing and chronotherapy
Rajakumar, A. T., & Muthukaliannan, G. K. (2025) · Annals of Medicine · doi:10.1080/07853890.2025.2596548 · Cited by 7
Mănescu, D. C., Stoian, M., Rădulescu, M. L., Dinciu, C. C., Mărgărit, I. R., Năstase, M., & Mănescu, C. O. (2026) · International Journal of Molecular Sciences · doi:10.3390/ijms27104415 · Cited by 7
Brangaccio, J. A., Phipps, A. M., Gemoets, D. E., Sniffen, J., & Thompson, A. K. (2024) · Experimental Brain Research · doi:10.1007/s00221-024-06777-z · Cited by 5
Onuma, S., & Kawai, M. (2024) · Endocrinology · doi:10.1210/endocr/bqae126 · Cited by 5
Liu, P., Nadeef, S., Serag, M. F., Paytuví-Gallart, A., Abadi, M., Valle, F. D., Radío, S., Roda, X., Capó, J. D., Adroub, S. A., et al. (2024) · The EMBO Journal · doi:10.1038/s44318-024-00267-2 · Cited by 5
Circadian rhythms, feeding patterns and metabolic regulation: implications for critical care
Smith, H., & Betts, J. A. (2024) · Proceedings of The Nutrition Society · doi:10.1017/s002966512400750x · Cited by 6
Human genetic variation determines 24-hour rhythmic gene expression and disease risk
Chen, Y., Liu, P., Sabo, A., & Guan, D. (2025) · Nature Communications · doi:10.1038/s41467-025-59524-5 · Cited by 7
Berisha, G., Sedliak, M., Zeman, M., Hamar, D., Cvečka, J., Tirpáková, V., Vajda, M., Oreská, Ľ., Černáčková, A., Čupka, M., et al. (2023) · European Journal of Translational Myology · doi:10.4081/ejtm.2023.12012 · Cited by 5
Ding, H., Meng, L., Xing, C.-G., Esser, K., & Huo, Z.-G. (2022) · bioRxiv · doi:10.1101/2022.06.05.494875 · Cited by 3
Metadata
- Authors
- Perrin, L., Loizides-Mangold, U., Chanon, S., Gobet, C., Hulo, N., Isenegger, L., Weger, B. D., Migliavacca, E., Charpagne, A., Betts, J. A., Walhin, J.-P., Templeman, I., Stokes, K., Thompson, D., Tsintzas, K., Robert, M., Howald, C., Riezman, H., Feige, J. N., Karagounis, L. G., Johnston, J. D., Dermitzakis, E. T., Gachon, F., Lefai, E., & Dibner, C.
- Affiliations
- University of Geneva (CH)
- Division of Endocrinology, Diabetes, Hypertension and Nutrition, Department of Internal Medicine Specialties, University Hospital of Geneva, Geneva, Switzerland
- Inserm (FR)
- École Polytechnique Fédérale de Lausanne (CH)
- Nestlé Institute of Health Sciences, Lausanne, Switzerland
- University of Bath (GB)
- University of Nottingham (GB)
- Hôpital Edouard Herriot (FR)
- Institute of Genetics and Genomics of Geneva, Geneva, Switzerland
- Nestlé (Switzerland) (CH)
- University of Surrey (GB)
- CarMeN Laboratory, INSERM U1060, Oullins, France
- Corresponding author
- Dibner, Charna
- ORCID
- Loizides-Mangold, Ursula
- Chanon, Stéphanie
- Gobet, Cédric
- Hulo, Nicolas
- Weger, Benjamin D
- Migliavacca, Eugenia
- Charpagne, Aline
- Betts, James A
- Walhin, Jean-Philippe
- Templeman, Iain
- Stokes, Keith
- Thompson, Dylan
- Tsintzas, Kostas
- Robert, Maud
- Riezman, Howard
- Karagounis, Leonidas G
- Johnston, Jonathan D
- Dermitzakis, Emmanouil T
- Gachon, Frédéric
- Dibner, Charna
- Venue
- eLife
- Publisher
- eLife Sciences Publications, Ltd
- Published
- 2018-04-16
- Volume
- 7
- Pages
- 30
- ISSN
- 2050-084X (ISSN-L)
- PMC
- PMC5902165
- OpenAlex
- W2797820730
- Cited by
- 139
- References
- 108
- Citations by year
- 2026: 12 · 2025: 14 · 2024: 24 · 2023: 15 · 2022: 17 · 2021: 16 · 2020: 24 · 2019: 12 · 2018: 5
- FWCI
- 8.71
- Type
- journal article
- Language
- en
- Open access
- gold
- doi.org
- Licence
- Locations
- eLife (publishedVersion, cc-by)
- Europe PMC (PubMed Central) (publishedVersion, cc-by)
- PubMed Central (publishedVersion, cc-by)
- PubMed (publishedVersion)
- Repository@Nottingham (University of Nottingham) (publishedVersion, other-oa)
- Archive ouverte UNIGE (University of Geneva) (publishedVersion, other-oa)
- Surrey Research Insight Open Access (The University of Surrey) (submittedVersion)
- HAL (submittedVersion)
- DOAJ (DOAJ: Directory of Open Access Journals) (submittedVersion, cc-by-sa)
- Infoscience (Ecole Polytechnique Fédérale de Lausanne) (submittedVersion, cc-by-nc-nd)
- Archive ouverte UNIGE (University of Geneva) (submittedVersion, cc-by)
- Funders
- Schweizerischer Nationalfonds zur Förderung der Wissenschaftlichen Forschung (Sinergia Grant No. CRSII3-154405, 31003A-166700)
- Fondation Privée HUG
- Fondation Ernst et Lucie Schmidheiny
- Société Académique de Genève
- Biotechnology and Biological Sciences Research Council
- Topics
- Life Sciences › Neuroscience › Endocrine and Autonomic Systems › Circadian rhythm and melatonin
- Life Sciences › Biochemistry, Genetics and Molecular Biology › Molecular Biology › Metabolism, Diabetes, and Cancer
- Health Sciences › Medicine › Physiology (medical) › Adipose Tissue and Metabolism
- Keywords
- circadian rhythm, circadian clock, skeletal muscle, rhythmic gene expression, myotubes, in vitro culture, GLUT4, glucose uptake, insulin signaling, lipid metabolism, glucose homeostasis
- MeSH terms
- Glucose, Humans, Muscle, Skeletal, Gene Expression Profiling, Lipid Metabolism, Metabolic Networks and Pathways, CLOCK Proteins, Circadian Clocks
About these checks
Registry, retraction, Cites and statistics results are computed, not judged, with one exception: a printed reference that no index lists is read once by a model before it counts as a citation error. Claims are extracted by a model and kept only when their quote appears verbatim in the text; each cited source is then checked, with a model’s help, for whether it says what the claim relies on. Those verdicts can be wrong — read the claim’s quote and the cited source before relying on one.
Statistics and arithmetic are recomputed, not judged.
Confidence bands are shown only for fields calibrated on our annotated test set. None is calibrated yet, so no band is shown.
What counts as a claim ›How we measure confidence ›How we check this ›
Are you an author, or do you see a problem with this page? Request a review
