

The DOI matches its Crossref record; 68 of the 68 references it cites were found in a registry or an index.
The inner junction complex of the cilia is an interaction hub that involves tubulin post-translational modifications
Open accessPublished version of a preprint
Abstract
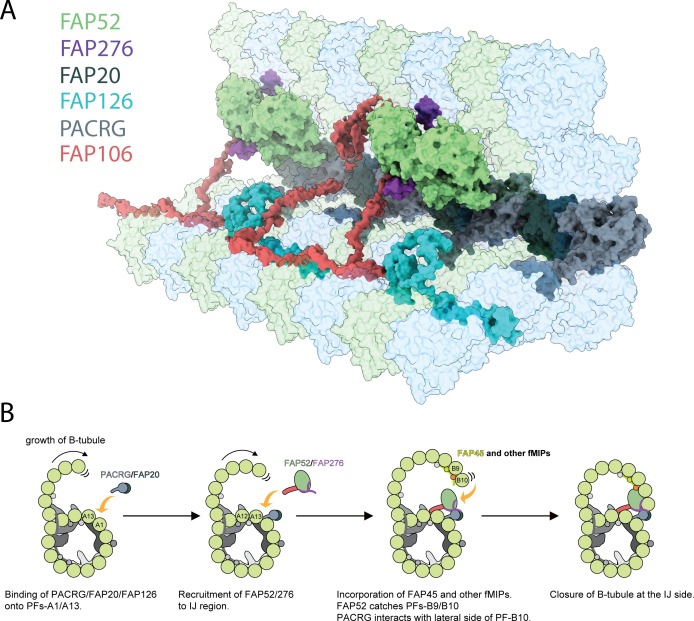
Microtubules are cytoskeletal structures involved in stability, transport and organization in the cell. The building blocks, the α- and β-tubulin heterodimers, form protofilaments that associate laterally into the hollow microtubule. Microtubule also exists as highly stable doublet microtubules in the cilia where stability is needed for ciliary beating and function. The doublet microtubule maintains its stability through interactions at its inner and outer junctions where its A- and B-tubules meet. Here, using cryo-electron microscopy, bioinformatics and mass spectrometry of the doublets of Chlamydomonas reinhardtii and Tetrahymena thermophila, we identified two new inner junction proteins, FAP276 and FAP106, and an inner junction-associated protein, FAP126, thus presenting the complete answer to the inner junction identity and localization. Our structural study of the doublets shows that the inner junction serves as an interaction hub that involves tubulin post-translational modifications. These interactions contribute to the stability of the doublet and hence, normal ciliary motility.
Overview
The claims and statistics of this paper haven’t been checked yet.
Run the check — free, no account needed. It reads the open-access text and checks the sources it cites.
Integrity signals
Registry
Cites
Statistics
Figures
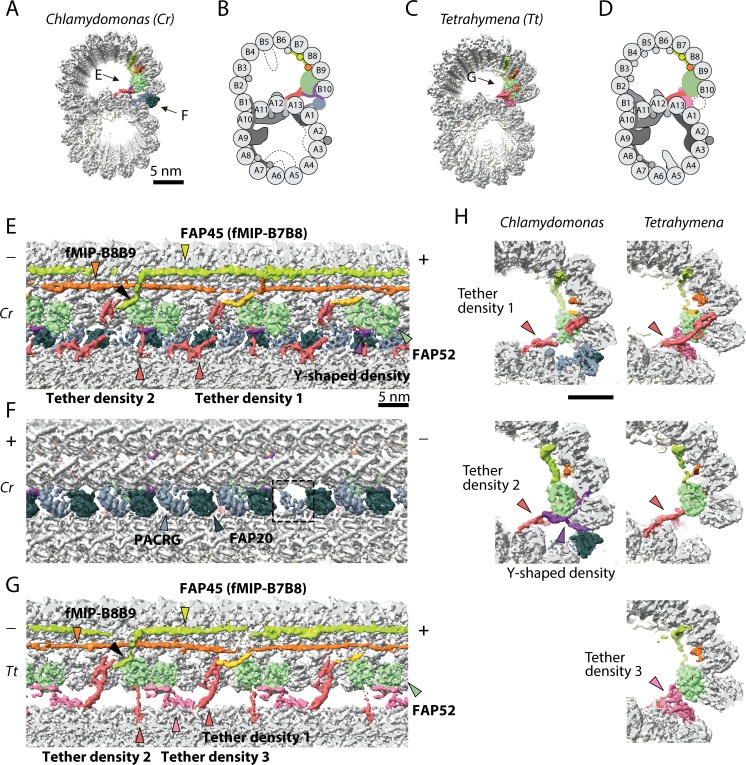
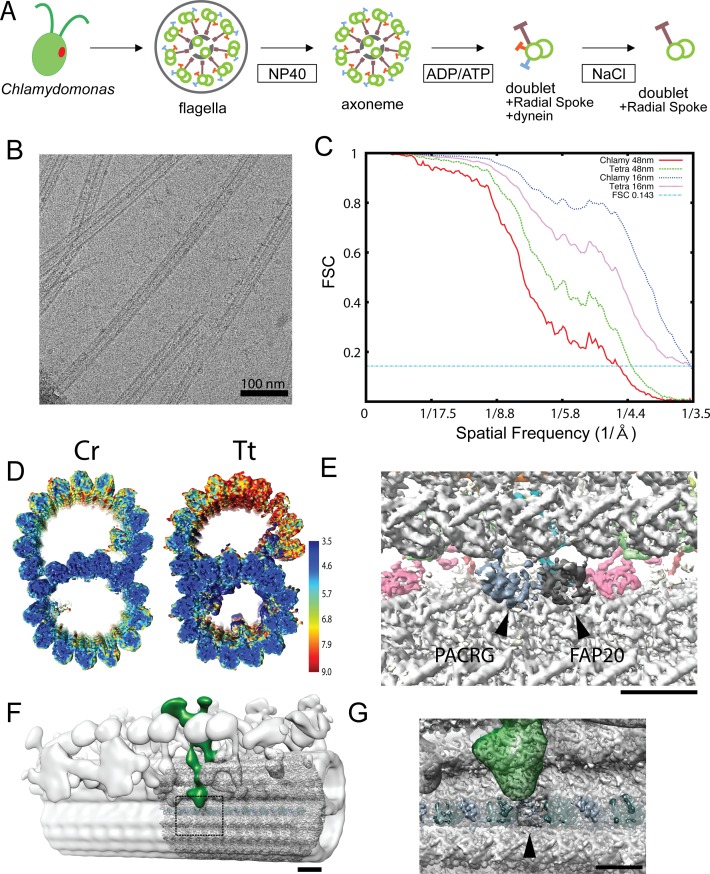
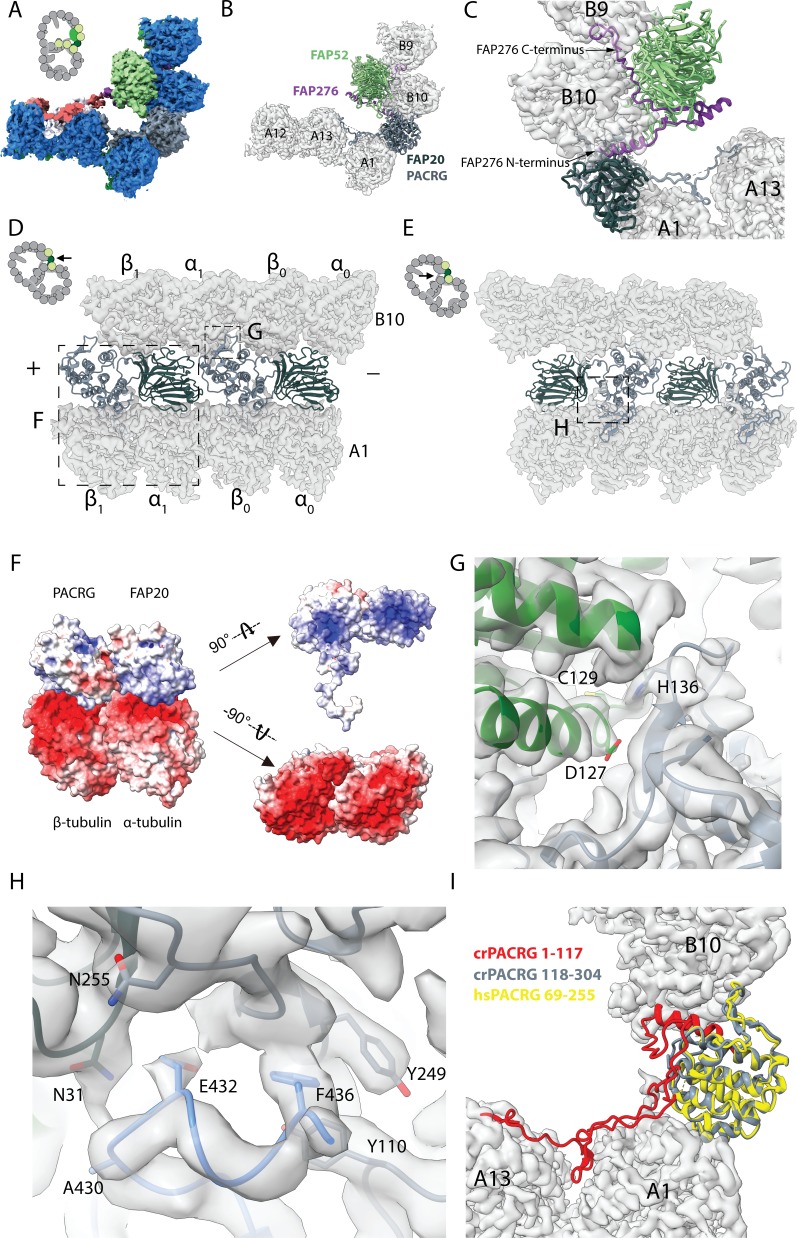
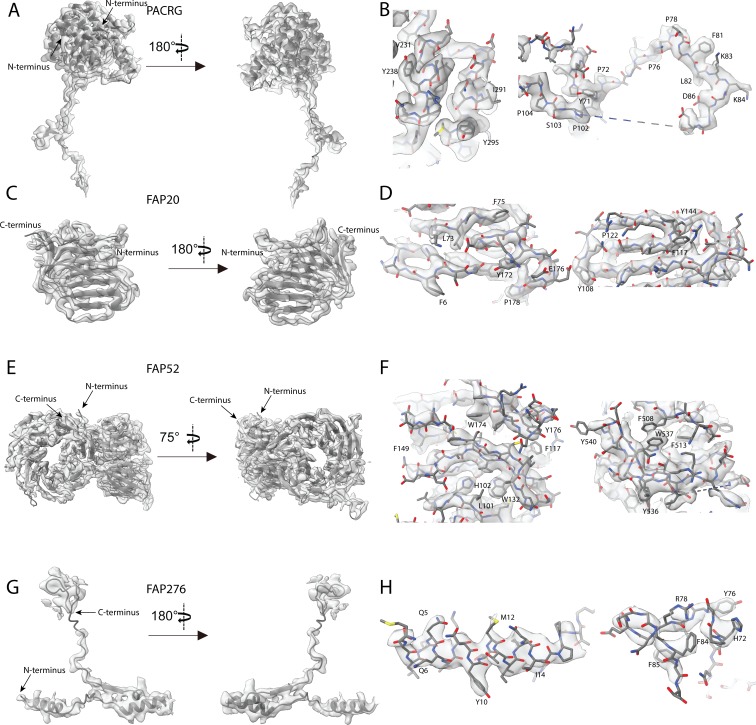
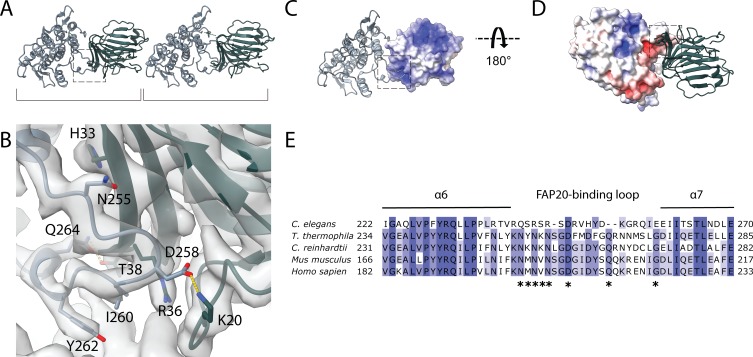
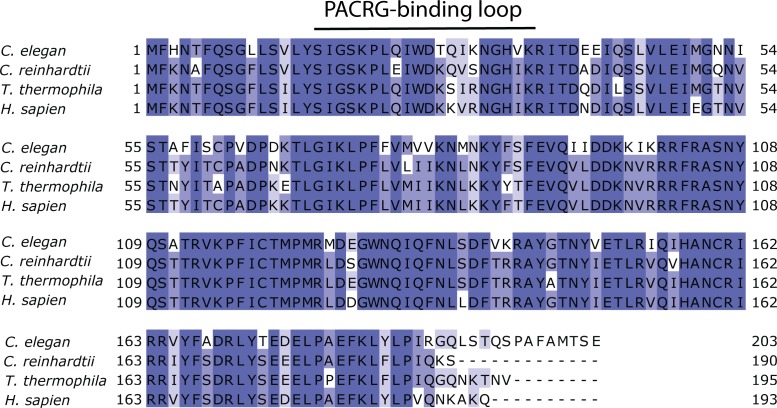
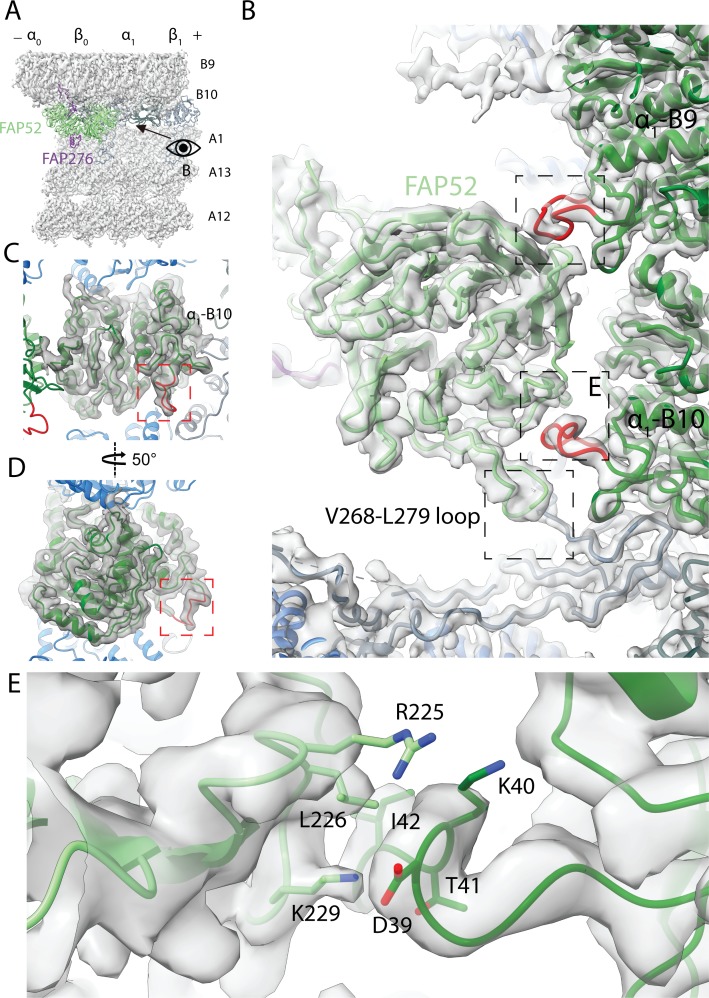
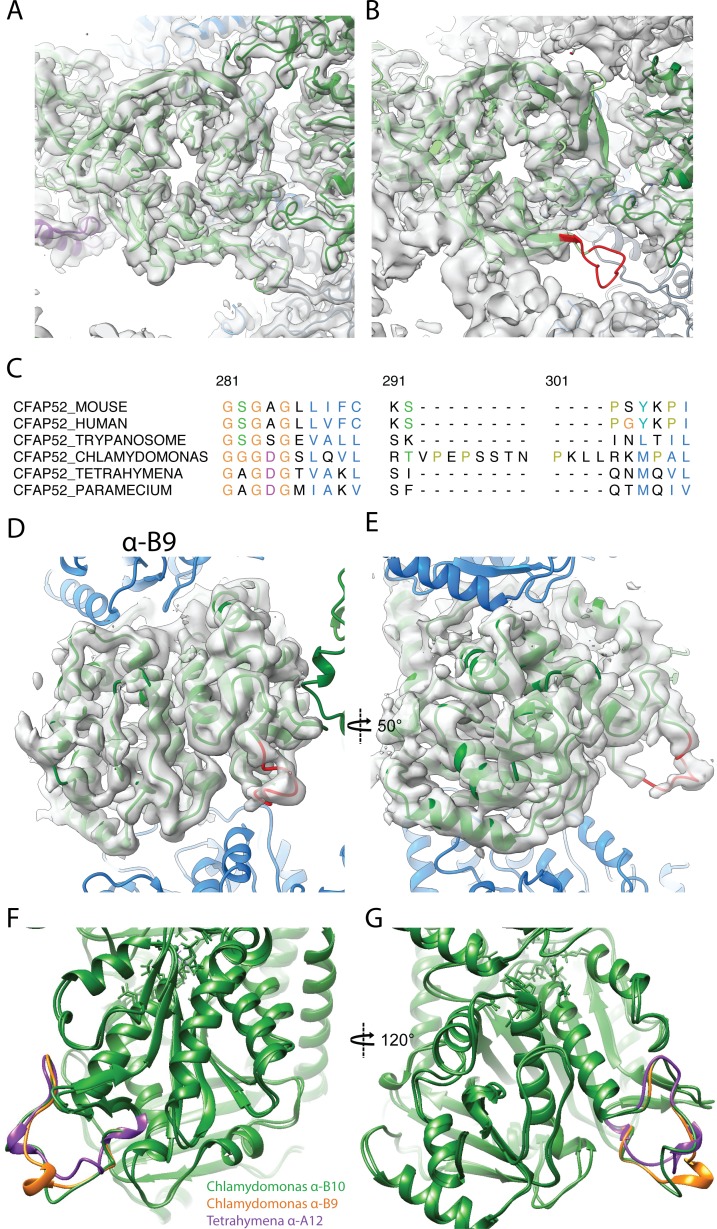
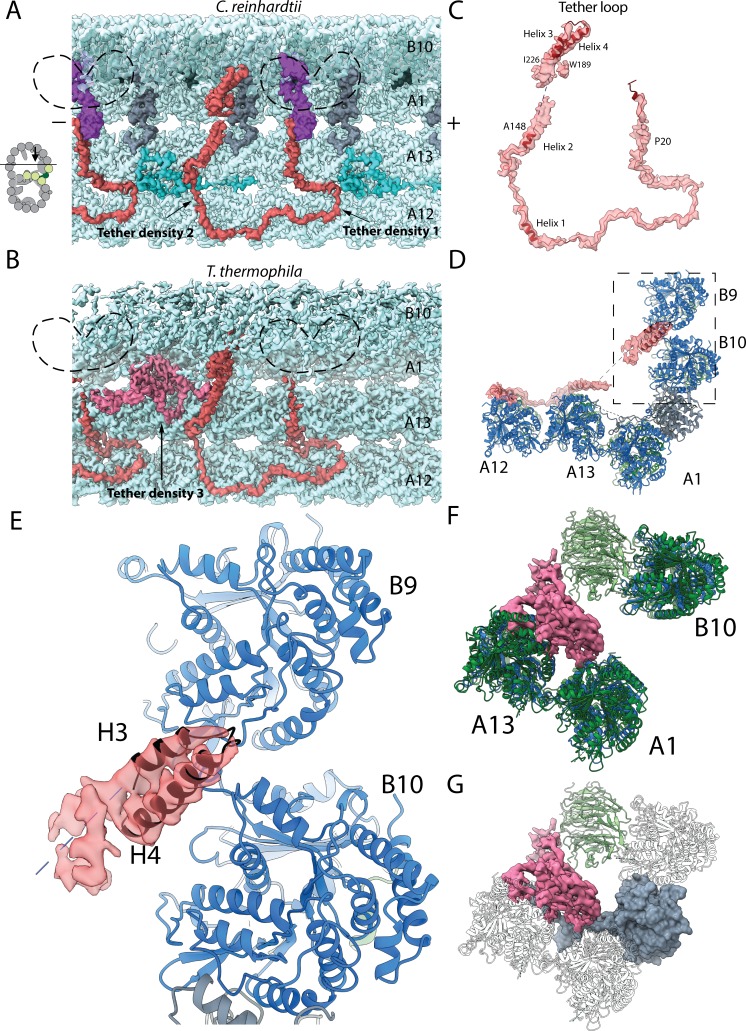
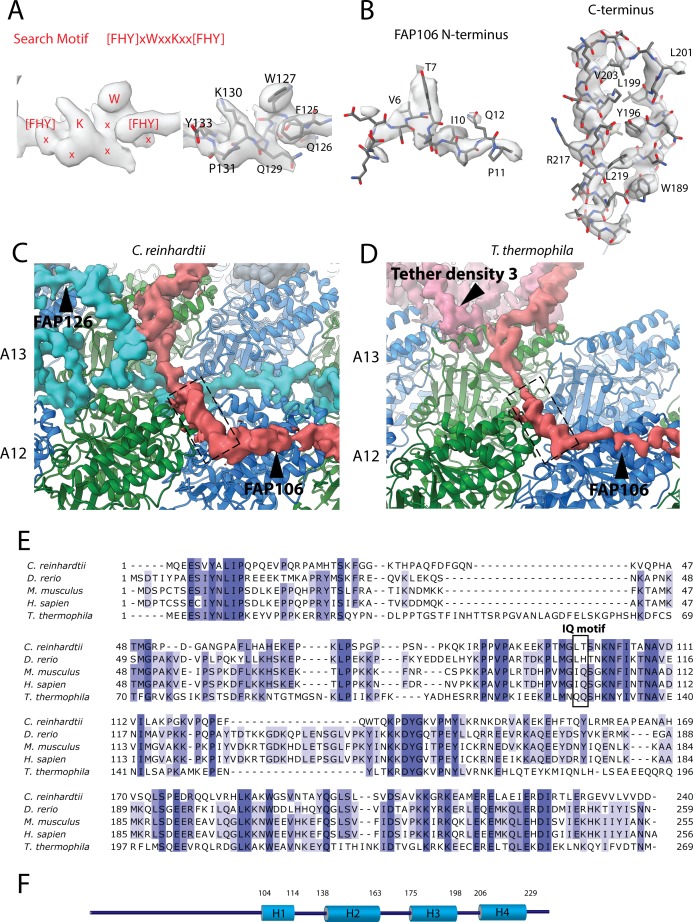
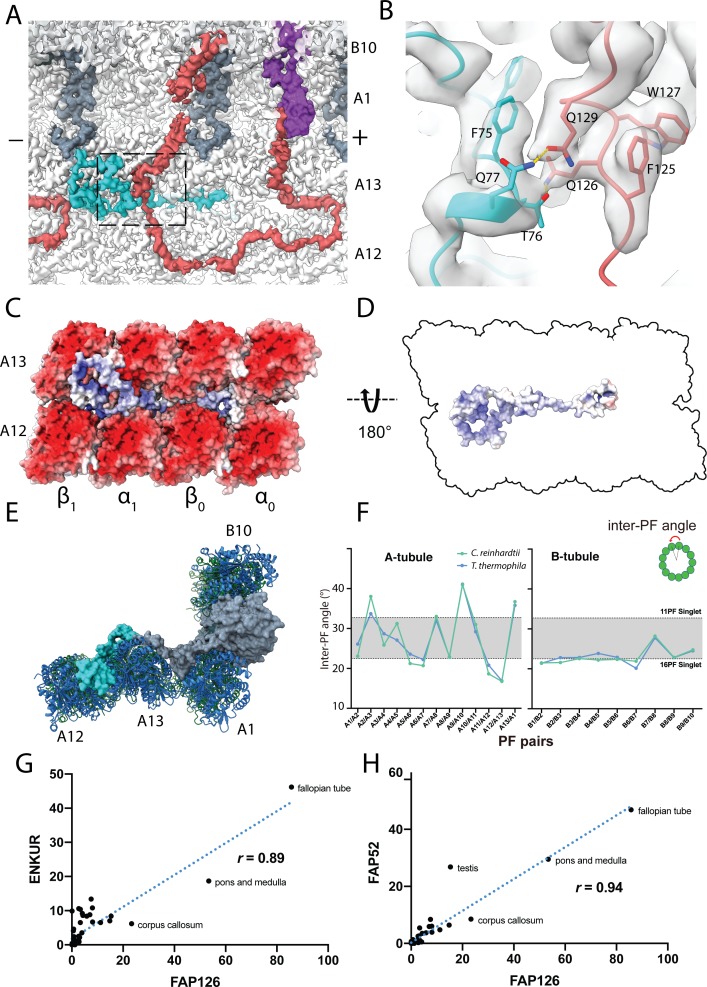
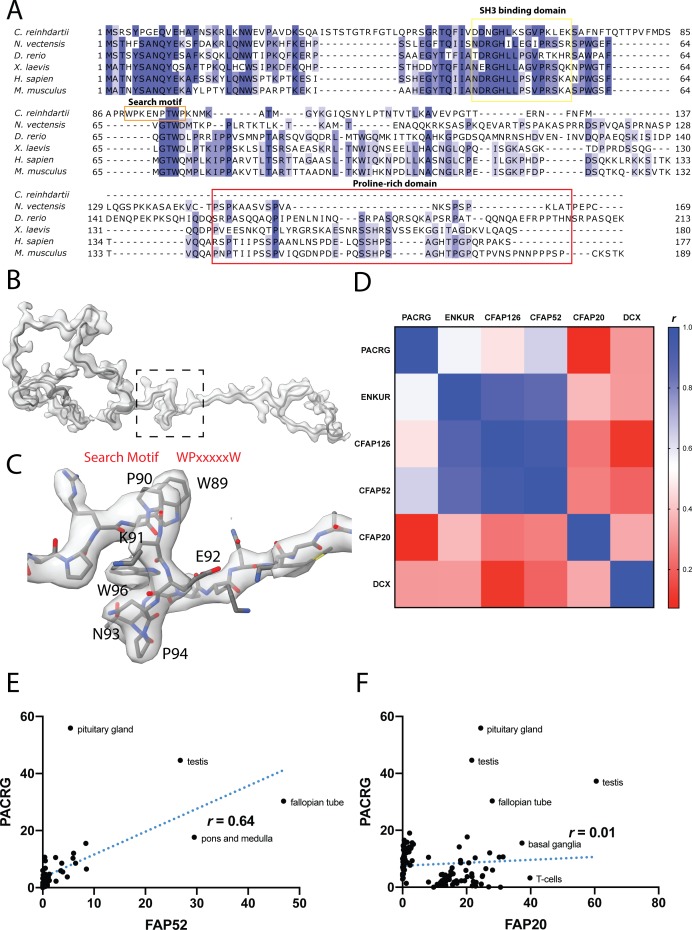
Verification
Claims the paper makes
The claims and statistics of this paper haven’t been checked yet.
Run the check — free, no account needed. It reads the open-access text and checks the sources it cites.
Claims other papers make about this one
Each is checked against this paper’s own text: does it say what the citing paper says it does?
The source backs part of the claim, not all of it — or backs it for a different population, condition or comparison.
In the citing paper
“Based on near-atomic-resolution cryo-electron microscopy reconstructions of motile cilia axonemes, the inner junction is well positioned to act as a scaffold for the radial spoke and dynein regulatory complex machinery19–22.”
From The inner junction protein CFAP20 functions in motile and non-motile cilia and is critical for vision (2022) · cites this paper as [21]
Experimental — accuracy not yet measuredThe source backs part of the claim, not all of it — or backs it for a different population, condition or comparison.
In the citing paper
“From cryo-EM structures of Chlamydomonas and Tetrahymena motile cilia, proteins at or near the inner junction, which include CFAP20, PACRG, CFAP45, CFAP52, CFAP90, CFAP126 and EFHC119–21, are all positioned to form a potential scaffold for, or functionally influence, the radial spokes and dynein regulatory complex that regulates ciliary motility (Fig. 8).”
From The inner junction protein CFAP20 functions in motile and non-motile cilia and is critical for vision (2022) · cites this paper as [21]
Experimental — accuracy not yet measuredThe cited source says what the claim attributes to it.
In the citing paper
“The multiple contacts of CFAP20 with ciliary axoneme tubulins and PACRG, as well as proximity to CFAP52 and other proteins at or near the inner junction19–21,71 (Figs. 1b and 8), could explain this degree of conservation.”
From The inner junction protein CFAP20 functions in motile and non-motile cilia and is critical for vision (2022) · cites this paper as [21]
Self-check
Percentages, sums and reported differences re-computed from the paper’s own numbers.
The self-check needs the paper’s full text.
Citations
Cites
UCSF Chimera—A visualization system for exploratory research and analysis
Pettersen, E. F., Goddard, T. D., Huang, C. C., Couch, G. S., Greenblatt, D. M., Meng, E. C., & Ferrin, T. E. (2004) · Journal of Computational Chemistry · doi:10.1002/jcc.20084 · Cited by 46,047
Features and development of Coot
Emsley, P., Lohkamp, B., Scott, W. G., & Cowtan, K. (2010) · Acta Crystallographica Section D Biological Crystallography · doi:10.1107/s0907444910007493 · Cited by 29,915
PHENIX : a comprehensive Python-based system for macromolecular structure solution
Adams, P. D., Afonine, P. V., Bunkóczi, G., Chen, V. B., Davis, I. W., Echols, N., Headd, J. J., Hung, L.-W., Kapral, G. J., Grosse-Kunstleve, R. W., et al. (2010) · Acta Crystallographica Section D Biological Crystallography · doi:10.1107/s0907444909052925 · Cited by 23,716
MotionCor2: anisotropic correction of beam-induced motion for improved cryo-electron microscopy
Zheng, S. Q., Palovcak, E. J., Armache, J., Verba, K. A., Cheng, Y., & Agard, D. A. (2017) · Nature Methods · doi:10.1038/nmeth.4193 · Cited by 7,496
PHENIX: a comprehensive Python-based system for macromolecular structure solution
Adams, P. D., Afonine, P. V., Bunkòczi, G., Chen, V. B., Davis, I., Echols, N., Headd, J. J., Hung, L., Kapral, G. J., Grosse‐Kunstleve, R. W., et al. (2012) · International Tables for Crystallography · doi:10.1107/97809553602060000865 · Cited by 7,334
The I-TASSER Suite: protein structure and function prediction
Yang, J., Yan, R., Roy, A., Xu, D., Poisson, J., & Zhang, Y. (2015) · Nature Methods · doi:10.1038/nmeth.3213 · Cited by 5,596
UCSF ChimeraX: Meeting modern challenges in visualization and analysis
Goddard, T. D., Huang, C. C., Meng, E. C., Pettersen, E. F., Couch, G. S., Morris, J. H., & Ferrin, T. E. (2018) · Protein Science · doi:10.1002/pro.3235 · Cited by 5,267
Mutations in the parkin gene cause autosomal recessive juvenile parkinsonism
Kitada, T., Asakawa, S., Hattori, N., Matsumine, H., Yamamura, Y., Minoshima, S., Yokochi, M., Mizuno, Y., & Shimizu, N. (1998) · Nature · doi:10.1038/33416 · Cited by 5,227
New tools for automated high-resolution cryo-EM structure determination in RELION-3
Zivanov, J., Nakane, T., Forsberg, B., Kimanius, D., Hagen, W., Lindahl, E., & Scheres, S. (2018) · eLife · doi:10.7554/elife.42166 · Cited by 4,377
Gctf: Real-time CTF determination and correction
Zhang, K. (2015) · Journal of Structural Biology · doi:10.1016/j.jsb.2015.11.003 · Cited by 3,417
Cited by
Sorted by citations
Items 801–900 of 999
Theoretical insights into rotary mechanism of MotAB in the bacterial flagellar motor
Kubo, S., Okada, Y., & Takada, S. (2024) · Biophysical Journal · doi:10.1016/j.bpj.2024.09.010 · Cited by 6
Self-citationNutritional state-dependent modulation of insulin-producing cells in Drosophila
Bisen, R. S., Iqbal, F. M., Cascino-Milani, F., Bockemühl, T., & Ache, J. M. (2024) · eLife · doi:10.7554/elife.98514.3 · Cited by 23
Tanaka, P. P., de Oliveira, E. H. D., Vieira-Machado, M. C., Duarte, M. J., Assis, A. F., Bombonato‐Prado, K. F., & Passos, G. A. S. (2022) · BMC Genomics · doi:10.1186/s12864-022-08631-4 · Cited by 6
Banerjee, T., Pati, S., Tiwari, P., & Vaidya, V. A. (2022) · Journal of Biosciences · doi:10.1007/s12038-022-00308-0 · Cited by 6
Expansion microscopy reveals subdomains in C. elegans germ granules
Suen, K. M., Sheard, T. M. D., Lin, C., Milonaitytė, D., Jayasinghe, I., & Ladbury, J. E. (2023) · Life Science Alliance · doi:10.26508/lsa.202201650 · Cited by 6
Duchet, B., Ghezzi, F., Weerasinghe, G., Tinkhauser, G., Kühn, A. A., Brown, P., Bick, C., & Bogacz, R. (2020) · bioRxiv (Cold Spring Harbor Laboratory) · doi:10.1101/2020.04.27.064246 · Cited by 6
Immuno-epidemiological life-history and the dynamics of SARS-CoV-2 over the next five yearsPreprint
Saad-Roy, C. M., Wagner, C. E., Baker, R. E., Morris, S. E., Farrar, J., Graham, A. L., Levin, S. A., Metcalf, C. J. E., & Grenfell, B. T. (2020) · medRxiv · doi:10.1101/2020.07.15.20154401 · Cited by 6
Limited haplotype diversity underlies polygenic trait architecture across 70 years of wheat breedingPreprint
Scott, M. F., Fradgley, N. S., Bentley, A. R., Brabbs, T., Corke, F. M. K., Gardner, K. A., Horsnell, R. A., Howell, P., Ladejobi, O., Mackay, I., et al. (2020) · bioRxiv (Cold Spring Harbor Laboratory) · doi:10.1101/2020.09.15.296533 · Cited by 6
Benn, R. A., Mars, R. B., Xu, T., Yee, J. R., Rodríguez‐Esparragoza, L., Montesinos, P., Manzano-Patron, J. P., López-Martín, G. J., Fuster, V., Sánchez‐Gonzalez, J., et al. (2020) · bioRxiv (Cold Spring Harbor Laboratory) · doi:10.1101/2020.10.13.337436 · Cited by 6
Mamou, G., Inns, P. G., Sun, D., Kaminska, R., Housden, N. G., Cohen-Khait, R., Miller, H., Storek, K. M., Rutherford, S. T., Payandeh, J., et al. (2021) · bioRxiv (Cold Spring Harbor Laboratory) · doi:10.1101/2021.01.27.428258 · Cited by 6
Interventions to control nosocomial transmission of SARS-CoV-2: a modelling studyPreprint
Pham, T. M., Tahir, H., van de Wijgert, J. H. H. M., der Roest, B. R. V., Ellerbroek, P. M., Bonten, M. J. M., Bootsma, M., & Kretzschmar, M. (2021) · medRxiv · doi:10.1101/2021.02.26.21252327 · Cited by 6
Caarls, L., Bassetti, N., van Doesburg, F., Verbaarschot, P., van Loon, J. J. A., Schranz, M. E., & Fatouros, N. E. (2021) · bioRxiv (Cold Spring Harbor Laboratory) · doi:10.1101/2021.03.29.437462 · Cited by 6
A hymenopteran odorant alerts flies to bury eggsPreprint
Davis, S. M., Chism, G. T., Maurer, M. M., Trejo, J. E., Garcia, R. J., & Schlenke, T. A. (2021) · bioRxiv (Cold Spring Harbor Laboratory) · doi:10.1101/2021.09.30.462443 · Cited by 6
Assessing the sensitivity of EEG-based frequency-tagging as a metric for statistical learningPreprint
Pinto, D., & Golumbic, E. Z. (2023) · OSF Preprints (OSF Preprints) · Cited by 6
Cerebellar associative learning underlies skilled reach adaptationPreprint
Calame, D. J., Becker, M. I., & Person, A. L. (2021) · bioRxiv (Cold Spring Harbor Laboratory) · doi:10.1101/2021.12.17.473247 · Cited by 6
Transcranial Direct Current Stimulation Alters the Waveform Shape of Cortical Gamma OscillationsPreprint
Marshall, T. R., Quinn, A. J., Jensen, O. B., & Bergmann, T. O. (2022) · bioRxiv (Cold Spring Harbor Laboratory) · doi:10.1101/2022.04.25.489371 · Cited by 5
WITHDRAWN: Multisensory learning binds modality-specific neurons into a cross-modal memory engramPreprint
Okray, Z., Jacob, P. F., Stern, C., Desmond, K., Otto, N., Vargas-Gutierrez, P., & Waddell, S. (2022) · bioRxiv (Cold Spring Harbor Laboratory) · doi:10.1101/2022.07.08.499174 · Cited by 6
Vaccination shapes evolutionary trajectories of SARS-CoV-2Preprint
Meijers, M., Ruchnewitz, D., Łuksza, M., & Lässig, M. (2022) · bioRxiv (Cold Spring Harbor Laboratory) · doi:10.1101/2022.07.19.500637 · Cited by 6
Ultra-weak protein-protein interactions can modulate proteome-wide searching and bindingPreprint
Hofmann, J. L., Maheshwari, A. J., Sunol, A. M., Endy, D., & Zia, R. N. (2022) · bioRxiv (Cold Spring Harbor Laboratory) · doi:10.1101/2022.09.30.510365 · Cited by 6
Cell types in the mouse amygdala and their transcriptional response to fear conditioningPreprint
Hochgerner, H., Tibi, M., Netser, S., Ophir, O., Reinhardt, N., Singh, S., Lin, Z.-H., Wagner, S., & Zeisel, A. (2022) · bioRxiv · doi:10.1101/2022.10.25.513733 · Cited by 2
Demixing model: A normative explanation for inter-item biases in memory and perceptionPreprint
Четвериков, А. А. (2023) · bioRxiv (Cold Spring Harbor Laboratory) · doi:10.1101/2023.03.26.534226 · Cited by 9
Membrane mechanics dictate axonal morphology and functionPreprint
Griswold, J. M., Bonilla-Quintana, M., Pepper, R., Lee, C. T., Raychaudhuri, S., Ma, S., Gan, Q., Syed, S., Zhu, C., Bell, M. K., et al. (2023) · bioRxiv (Cold Spring Harbor Laboratory) · doi:10.1101/2023.07.20.549958 · Cited by 6
Tralamazza, S. M., Gluck‐Thaler, E., Feurtey, A., & Croll, D. (2023) · bioRxiv (Cold Spring Harbor Laboratory) · doi:10.1101/2023.09.22.559077 · Cited by 6
A population code for spatial representation in the larval zebrafish telencephalonPreprint
Yang, C., Mammen, L. C. C., Kim, B., Li, M., Robson, D. N., & Li, J. (2023) · bioRxiv (Cold Spring Harbor Laboratory) · doi:10.1101/2023.11.12.566708 · Cited by 6
Aguilar-Rodríguez, J., Vila, J. C. C., Chen, S.-A. A., Razo‐Mejia, M., Ghosh, O. M., Jarosz, D. F., Fraser, H. B., & Petrov, D. A. (2024) · bioRxiv (Cold Spring Harbor Laboratory) · doi:10.1101/2024.10.30.621178 · Cited by 12
Zebrafish: Lessons and Insights into Skeletal Muscle ResearchPreprint
Lu, Y., Ruparelia, A. A., & Currie, P. D. (2025) · Cold Spring Harbor Perspectives in Biology · doi:10.1101/cshperspect.a041515 · Cited by 6
β3 accelerates microtubule plus end maturation through a divergent lateral interface
Wood, L. M., & Moore, J. K. (2025) · Molecular Biology of the Cell · doi:10.1091/mbc.e24-08-0354 · Cited by 5
Mef2c Controls Postnatal Callosal Axon Targeting by Regulating Sensitivity to Ephrin Repulsion
Sudarsanam, S., Guzman-Clavel, L., Dar, N., Žiak, J., Shahid, N., Jin, X. O., & Kolodkin, A. L. (2025) · Journal of Neuroscience · doi:10.1523/jneurosci.0201-25.2025 · Cited by 5
Razo‐Mejia, M., Mani, M., & Petrov, D. A. (2026) · PRX Life · doi:10.1103/zyj4-qt72 · Cited by 3
Evolution of explorative and exploitative search strategies in collective foraging
Garg, K., Smaldino, P. E., & Kello, C. T. (2024) · Collective Intelligence · doi:10.1177/26339137241228858 · Cited by 5
Rapid evolution of colistin resistance in a bioreactor model of infection of Klebsiella pneumoniae
Jiménez-Castellanos, J.-C., Waclaw, B., Meynert, A. M., McAteer, S. P., & Schneiders, T. (2024) · Communications Biology · doi:10.1038/s42003-024-06378-0 · Cited by 5
Defective Integrator activity shapes the transcriptome of patients with multiple sclerosis
Porozhan, Y., Carstensen, M., Thouroude, S., Costallat, M., Rachez, C., Batsché, É., Petersen, T., Christensen, T., & Muchardt, C. (2024) · Life Science Alliance · doi:10.26508/lsa.202402586 · Cited by 6
Raiser, G., Galizia, C. G., & Szyszka, P. (2024) · Chemical Senses · doi:10.1093/chemse/bjae030 · Cited by 5
Putman, J. N., Watson, S. D., Zhang, Z., Khandelwal, N., Kulkarni, A., Gibson, J. R., & Huber, K. M. (2024) · Journal of Neuroscience · doi:10.1523/jneurosci.0098-24.2024 · Cited by 7
A biomimetic fruit fly robot for studying the neuromechanics of legged locomotion
Goldsmith, C., Haustein, M., Büschges, A., & Szczecinski, N. S. (2024) · Bioinspiration & Biomimetics · doi:10.1088/1748-3190/ad80ec · Cited by 7
Vestibular afferent neurons develop normally in the absence of quantal/glutamatergic input
Regalado, K., Bronson, D. R., Chang, R., & Kalluri, R. (2024) · Frontiers in Neurology · doi:10.3389/fneur.2024.1441964 · Cited by 5
Pasquini, L., Simon, A. J., Gallen, C. L., Kettner, H., Roseman, L., Gazzaley, A. H., Carhart-Harris, R. L., & Timmermann, C. (2025) · Imaging Neuroscience · doi:10.1162/imag_a_00541 · Cited by 5
Neural dynamics encoding risky choices during deliberation reveal separate choice subspaces
Peters, L. M., Roadarmel, A., Overton, J. A., Stickle, M. P., Lin, J. J., Kong, Z., Sáez, I., & Moxon, K. A. (2025) · Progress in Neurobiology · doi:10.1016/j.pneurobio.2025.102776 · Cited by 5
Human CCR4 deadenylase homolog Angel1 is a non-stop mRNA decay factor
Shaw, T., Dowdle, M. E., Ajaj, Y., Perelis, M., Fulzele, A., Yeo, G. W.-M., Bennett, E. J., & Lykke‐Andersen, J. (2025) · RNA · doi:10.1261/rna.080399.125 · Cited by 5
Shirra, M. K., Kocik, R. A., Ellison, M. A., & Arndt, K. M. (2021) · G3 Genes Genomes Genetics · doi:10.1093/g3journal/jkab298 · Cited by 5
Casanova-Ferrer, P., Ares, S., & Muñoz-García, J. (2022) · PLoS Computational Biology · doi:10.1371/journal.pcbi.1010359 · Cited by 5
Ameijeiras, P., Capriotti, N., Ons, S., de Oliveira, P. L., & Sterkel, M. (2023) · Insect Science · doi:10.1111/1744-7917.13174 · Cited by 5
Yoshida, K., & Hayashi, S. (2023) · Development · doi:10.1242/dev.201231 · Cited by 5
Effect of α-tubulin acetylation on the doublet microtubule structure
Yang, S. K., Kubo, S., Black, C. S., Peri, K., Dai, D., Legal, T., Valente-Paterno, M., Gaertig, J., & Bui, K. H. (2023) · eLife · doi:10.7554/elife.92219 · Cited by 17
Self-citationSensory input to cortex encoded on low-dimensional periphery-correlated subspaces
Barreiro, A. K., Fontenele, A. J., Ly, C., Raju, P. C., Gautam, S. H., & Shew, W. L. (2023) · PNAS Nexus · doi:10.1093/pnasnexus/pgae010 · Cited by 5
Brooks, E., Zeidler, M. P., Ong, A. C. M., & Evans, I. R. (2024) · Frontiers in Immunology · doi:10.3389/fimmu.2023.1310117 · Cited by 5
A combinatory genetic strategy for targeting neurogliaform neurons in the mouse basolateral amygdala
Ozsvár, A., Sieburg, M. C., Sietam, M. D., Hou, W., & Capogna, M. (2024) · Frontiers in Cellular Neuroscience · doi:10.3389/fncel.2024.1254460 · Cited by 6
FAP20 is required for flagellum assembly in Trypanosoma brucei
Shimogawa, M. M., Jonnalagadda, K., & Hill, K. L. (2024) · Molecular Biology of the Cell · doi:10.1091/mbc.e23-12-0497 · Cited by 5
Alpha-tubulin tails regulate axoneme differentiation
Li, M., Chen, Z., Guo, Z., Wang, Y., Chai, Y., Li, W., & Ou, G. (2025) · Proceedings of the National Academy of Sciences · doi:10.1073/pnas.2414731122 · Cited by 4
Anderson, A. C., Schultz, B. J., Snow, E. D., Brott, A. S., Stangherlin, S., Malloch, T., London, J., Walker, S., & Clarke, A. J. (2025) · Journal of Biological Chemistry · doi:10.1016/j.jbc.2025.108531 · Cited by 5
Guilmi, M. N. D., & Rodríguez‐Contreras, A. (2021) · Frontiers in Neuroscience · doi:10.3389/fnins.2021.654479 · Cited by 5
Accelerated signal propagation speed in human neocortical dendrites
Oláh, G., Lákovics, R., Shapira, S., Leibner, Y., Szűcs, A. L., Csajbók, É., Barzó, P., Molnár, G., Segev, I., & Tamás, G. (2025) · eLife · doi:10.1101/2022.09.30.510270 · Cited by 4
Dynamics of immune memory and learning in bacterial communities
Bonsma-Fisher, M., & Goyal, S. (2023) · eLife · doi:10.7554/elife.81692 · Cited by 4
Neural mechanism of experience-dependent sensory gain control in C. elegans
Ikejiri, Y., Tanimoto, Y., Fujita, K., Hiramatsu, F., Yamazaki, S. J., Endo, Y., Iwatani, Y., Fujimoto, K., & Kimura, K. D. (2023) · Neuroscience Research · doi:10.1016/j.neures.2023.01.006 · Cited by 4
Landmark contributions of Chlamydomonas to understanding cilia
Sale, W. S., & Dutcher, S. K. (2023) · Elsevier eBooks · doi:10.1016/b978-0-12-822508-0.00014-9 · Cited by 4
Medwig-Kinney, T. N., Kinney, B. A., Martinez, M. A., Yee, C., Sirota, S. S., Mullarkey, A. A., Somineni, N., Hippler, J., Zhang, W., Shen, K., et al. (2023) · eLife · doi:10.7554/elife.84355.3 · Cited by 5
Nagaeva, E. I., Schäfer, A., Linden, A.-M., Elsilä, L. V., Ryazantseva, M., Umemori, J., Egorova, K., & Korpi, E. R. (2023) · eNeuro · doi:10.1523/eneuro.0149-23.2023 · Cited by 5
Co-existence of prediction and error signals in electrophysiological responses to natural speechPreprint
Broderick, M. P., & Lalor, E. C. (2020) · bioRxiv (Cold Spring Harbor Laboratory) · doi:10.1101/2020.11.20.391227 · Cited by 5
Spectral inference reveals principal cone-integration rules of the zebrafish inner retinaPreprint
Bartel, P., Yoshimatsu, T., Janiak, F. K., & Baden, T. (2021) · bioRxiv (Cold Spring Harbor Laboratory) · doi:10.1101/2021.08.10.455697 · Cited by 5
Goal-centered representations in the human hippocampusPreprint
Crivelli-Decker, J. E., Clarke, A., Park, S. A., Huffman, D. J., Boorman, E. D., & Ranganath, C. (2021) · bioRxiv (Cold Spring Harbor Laboratory) · doi:10.1101/2021.08.18.456881 · Cited by 5
Gamma Entrainment Improves Synchronization Deficits in Dementia PatientsPreprint
Lahijanian, M., Aghajan, H. K., Vahabi, Z., & Afzal, A. (2021) · bioRxiv (Cold Spring Harbor Laboratory) · doi:10.1101/2021.09.30.462389 · Cited by 5
Fujiwara, T., Brotas, M., & Chiappe, M. E. (2021) · bioRxiv (Cold Spring Harbor Laboratory) · doi:10.1101/2021.10.10.463817 · Cited by 5
Gokuladhas, S., Schierding, W. S., Fadason, T., Choi, M., & O'Sullivan, J. M. (2021) · bioRxiv (Cold Spring Harbor Laboratory) · doi:10.1101/2021.12.08.471841 · Cited by 5
Beniaguev, D., Shapira, S., Segev, I., & London, M. (2022) · bioRxiv (Cold Spring Harbor Laboratory) · doi:10.1101/2022.01.28.478132 · Cited by 5
Non canonical scaffold-type ligase complex mediates protein UFMylationPreprint
Peter, J. J., Magnussen, H., DaRosa, P. A., Millrine, D., Matthews, S. P., Lamoliatte, F., Sundaramoorthy, R., Kopito, R. R., & Kulathu, Y. (2022) · bioRxiv (Cold Spring Harbor Laboratory) · doi:10.1101/2022.01.31.478489 · Cited by 5
Autoantibodies linked to autoimmune diseases associate with COVID-19 outcomesPreprint
Baiocchi, G. C., Vojdani, A., Rosenberg, A. Z., Vojdani, E., Halpert, G., Ostrinski, Y., Zyskind, I., Filgueiras, I. S., Schimke, L. F., Marques, A. H. C., et al. (2022) · medRxiv · doi:10.1101/2022.02.17.22271057 · Cited by 5
Call, C. L., Neely, S. A., Early, J. J., James, O. G., Zoupi, L., Williams, A., Chandran, S., Lyons, D. A., & Bergles, D. E. (2022) · bioRxiv (Cold Spring Harbor Laboratory) · doi:10.1101/2022.02.16.480718 · Cited by 5
Bollinger, J. L., Dadosky, D. T., Flurer, J. K., Rainer, I. L., Woodburn, S. C., & Wohleb, E. S. (2022) · bioRxiv (Cold Spring Harbor Laboratory) · doi:10.1101/2022.03.16.484487 · Cited by 5
Picchianti, L., Hernández, V. S. D. M., Zhan, N., Irwin, N. A. T., Stephani, M., Hornegger, H., Beveridge, R., Sawa-Makarska, J. Z., Lendl, T., Grujic, N., et al. (2022) · bioRxiv (Cold Spring Harbor Laboratory) · doi:10.1101/2022.04.26.489478 · Cited by 5
Avvisati, R., Kaufmann, A.-K., Young, C. J., Portlock, G. E., Cancemi, S., Costa, R. P., Magill, P. J., & Dodson, P. D. (2022) · bioRxiv (Cold Spring Harbor Laboratory) · doi:10.1101/2022.07.18.500429 · Cited by 5
Zn 2+ is Essential for Ca 2+ Oscillations in Mouse EggsPreprint
Akizawa, H., Lopes, E., & Fissore, R. A. (2023) · bioRxiv (Cold Spring Harbor Laboratory) · doi:10.1101/2023.04.13.536745 · Cited by 5
Rivera-Irizarry, J. K., Hámor, P. U., Rowson, S. A., Asfouri, J. J., Liu, D., Zallar, L. J., Garcia, A. F., Skelly, M. J., & Pleil, K. E. (2023) · bioRxiv (Cold Spring Harbor Laboratory) · doi:10.1101/2023.07.03.547570 · Cited by 6
Random, de novo and conserved proteins: How structure and disorder predictors perform differentlyPreprint
Middendorf, L., & Eicholt, L. A. (2023) · bioRxiv (Cold Spring Harbor Laboratory) · doi:10.1101/2023.07.18.549582 · Cited by 5
Oßwald, M., Cakici, A. L., de Oliveira, D. S., Braun, D. I., & Vecchio, A. D. (2023) · bioRxiv (Cold Spring Harbor Laboratory) · doi:10.1101/2023.07.25.550369 · Cited by 5
Raun, N., Jones, S. G., Kerr, O., Keung, C., Ibrahim, V., Williams, M., Top, D., & Kramer, J. M. (2023) · bioRxiv (Cold Spring Harbor Laboratory) · doi:10.1101/2023.08.08.549887 · Cited by 5
Miettinen, A., Dannewitz, J., Palm, S., Ahi, E. P., Romakkaniemi, A., Vähä, V., Östergren, J., Primmer, C. R., & Pritchard, V. L. (2023) · bioRxiv (Cold Spring Harbor Laboratory) · doi:10.1101/2023.08.23.553800 · Cited by 5
Wang, X., Krieger‐Redwood, K., Lyu, B., Lowndes, R., Wu, G., Souter, N. E., Wang, X., Kong, R., Shafiei, G., Bernhardt, B. C., et al. (2023) · bioRxiv (Cold Spring Harbor Laboratory) · doi:10.1101/2023.09.06.556465 · Cited by 5
Langin, G., Raffeiner, M., Biermann, D., Franz‐Wachtel, M., Spinti, D., Börnke, F. A. J., Maček, B., & Üstün, Ş. (2023) · bioRxiv (Cold Spring Harbor Laboratory) · doi:10.1101/2023.12.11.571118 · Cited by 6
Circadian control of a sex-specific behavior in DrosophilaPreprint
Riva, S., Ceriani, M. F., Risau-Gusman, S., & Franco, D. L. (2024) · eLife · doi:10.7554/elife.103359 · Cited by 5
Li, J., Zhu, Z., & Song, C. (2026) · Quantitative Biology · doi:10.1101/2024.06.09.598121 · Cited by 6
N2 Sleep Inspires InsightPreprint
Löwe, A. T., Petzka, M., Tzegka, M. M., & Schuck, N. W. (2024) · bioRxiv (Cold Spring Harbor Laboratory) · doi:10.1101/2024.06.24.600359 · Cited by 5
Spontaneous emergence and evolution of neuronal sequences in recurrent networksPreprint
Shao, S., Riquelme, J. L., & Gjorgjieva, J. (2024) · bioRxiv (Cold Spring Harbor Laboratory) · doi:10.1101/2024.09.27.615499 · Cited by 6
Fang, Y., González-Nieves, S., Cifarelli, V., & Imoukhuede, P. I. (2025) · bioRxiv (Cold Spring Harbor Laboratory) · doi:10.1101/2025.02.14.638177 · Cited by 5
Li, A., Allen, P. C., Wang, Y., Cui, H., Lin, T., Sun, Y., Wang, X. M., Tan, X., Walker, A., Wang, S., et al. (2025) · medRxiv · doi:10.1101/2025.05.24.25328275 · Cited by 7
Matuszewski, J., Bola, Ł., Collignon, O., & Marchewka, A. (2025) · Journal of Neuroscience · doi:10.1523/jneurosci.1153-24.2024 · Cited by 5
Regulation of pericentromeric DNA loop size via Scc2-cohesin interaction
Nguyen, S. A., Sakata, T., Shirahige, K., & Sutani, T. (2025) · iScience · doi:10.1016/j.isci.2025.112322 · Cited by 6
The evolution of an individual-like dispersive stage in colonial siphonophores
Mańko, M. K., Munro, C., & Leclère, L. (2025) · Current Biology · doi:10.1016/j.cub.2025.08.068 · Cited by 4
Zhu, Y., & Momeni, B. (2024) · PLoS Computational Biology · doi:10.1371/journal.pcbi.1012193 · Cited by 4
Loss of PI5P4Kα Slows the Progression of a Pten Mutant Basal Cell Model of Prostate Cancer
Triscott, J., Lehner, M., Benjak, A., Reist, M., Emerling, B. M., Ng, C. K. Y., de Brot, S., & Rubin, M. A. (2024) · Molecular Cancer Research · doi:10.1158/1541-7786.mcr-24-0290 · Cited by 4
Jo, S., Pearson, E., Yoon, D., Kim, J., & Park, W. M. (2024) · ACS Applied Materials & Interfaces · doi:10.1021/acsami.4c14249 · Cited by 4
Rachel, J., Möck, M., Daigle, T. L., Tasic, B., Witte, M., & Staiger, J. F. (2025) · Journal of Neuroscience · doi:10.1523/jneurosci.0949-24.2025 · Cited by 6
Nikitashina, L., Chen, X., Radosa, L., Li, K., Straßburger, M., Seelbinder, B., Böhnke, W., Vielreicher, S., Nietzsche, S., Heinekamp, T., et al. (2025) · Cell Reports · doi:10.1016/j.celrep.2025.115442 · Cited by 4
Inactivation of primate cortex reveals inductive biases in visual learning
Laamerad, P., Krause, M. R., Guitton, D., & Pack, C. C. (2025) · Current Biology · doi:10.1016/j.cub.2025.08.027 · Cited by 5
Kovacheva, L., Shin, J., Zaldívar-Díez, J., Mankel, J., Farassat, N., Costa, K. M., Thakur, P. S., Obeso, J. A., & Roeper, J. (2025) · eLife · doi:10.7554/elife.104037 · Cited by 4
Obstacles regulate membrane tension propagation to enable localized mechanotransduction
Català-Castro, F., Bonilla-Quintana, M., Sanfeliu-Cerdán, N., Rangamani, P., & Krieg, M. (2025) · Nature Physics · doi:10.1038/s41567-025-03037-x · Cited by 4
Toward Unified Biomarkers for Focal Epilepsy
Wang, S. H., Ferrari, P., Arnulfo, G., Marzulli, M., Degras, D., Myrov, V. O., Palva, S., Nobili, L., Ciuciu, P., & Palva, J. M. (2025) · Journal of Neuroscience · doi:10.1523/jneurosci.0879-25.2025 · Cited by 5
Kanda, T., Liu, F., Kooshapour, H., Reichardt, S., Wang, M., Icyishaka, P., Obana, N., Westermann, A. J., Chao, Y., & Miyakoshi, M. (2025) · Nucleic Acids Research · doi:10.1093/nar/gkaf1371 · Cited by 4
Hong, I., Kim, Y. K., Jung, H., Kim, C., Cho, J.-H., & Kaang, B. (2026) · Proceedings of the National Academy of Sciences · doi:10.1073/pnas.2510016123 · Cited by 4
MRBLE-pep Measurements Reveal Accurate Binding Affinities for B56, a PP2A Regulatory Subunit
Hein, J. B., Cyert, M., & Fordyce, P. M. (2021) · ACS Measurement Science Au · doi:10.1021/acsmeasuresciau.1c00008 · Cited by 4
Metadata
- Authors
- Khalifa, A. A. Z., Ichikawa, M., Dai, D., Kubo, S., Black, C. S., Peri, K., McAlear, T. S., Veyron, S., Yang, S. K., Vargas, J., Bechstedt, S., Trempe, J.-F., & Bui, K. H.
- Affiliations
- McGill University (CA)
- Kyoto University (JP)
- Corresponding author
- Bui, Khanh Huy
- ORCID
- Venue
- eLife
- Publisher
- eLife Sciences Publications, Ltd
- Published
- 2020-01-17
- Volume
- 9
- ISSN
- 2050-084X (ISSN-L)
- PMC
- PMC6994238
- OpenAlex
- W3000377151
- Cited by
- 1,676
- References
- 67
- Citations by year
- 2026: 159 · 2025: 264 · 2024: 275 · 2023: 301 · 2022: 336 · 2021: 273 · 2020: 64
- FWCI
- 142.78
- Type
- journal article
- Language
- en
- Open access
- gold
- doi.org
- Licence
- Locations
- eLife (publishedVersion, cc-by)
- PubMed Central (publishedVersion, cc-by)
- PubMed (publishedVersion)
- DOAJ (DOAJ: Directory of Open Access Journals) (submittedVersion, cc-by-sa)
- Funders
- Canadian Institutes of Health Research (PJT-156354)
- Natural Sciences and Engineering Research Council of Canada (RGPIN-2016-04954, RGPIN-2018-04813, RGPIN-2017-04649)
- Canadian Institute for Advanced Research (Arzieli Global Scholar Program)
- Japan Society for the Promotion of Science
- Abdulla Al Ghurair Foundation for Education (Al Ghurair STEM program scholarship)
- Canada Research Chairs (950-229792)
- Topics
- Life Sciences › Biochemistry, Genetics and Molecular Biology › Genetics › Genetic and Kidney Cyst Diseases
- Life Sciences › Biochemistry, Genetics and Molecular Biology › Cell Biology › Microtubule and mitosis dynamics
- Health Sciences › Medicine › Pulmonary and Respiratory Medicine › Cystic Fibrosis Research Advances
- Keywords
- tubulin post-translational modifications, Chlamydomonas reinhardtii, Tetrahymena thermophila, ciliary motility, microtubule stability, cryo-electron microscopy
- MeSH terms
- Cilia, Microtubules, Plant Proteins, Protein Processing, Post-Translational, Mass Spectrometry, Protozoan Proteins, Tetrahymena thermophila, Chlamydomonas reinhardtii, Computational Biology, Cryoelectron Microscopy
About these checks
Registry, retraction, Cites and statistics results are computed, not judged, with one exception: a printed reference that no index lists is read once by a model before it counts as a citation error. Claims are extracted by a model and kept only when their quote appears verbatim in the text; each cited source is then checked, with a model’s help, for whether it says what the claim relies on. Those verdicts can be wrong — read the claim’s quote and the cited source before relying on one.
Statistics and arithmetic are recomputed, not judged.
Confidence bands are shown only for fields calibrated on our annotated test set. None is calibrated yet, so no band is shown.
What counts as a claim ›How we measure confidence ›How we check this ›
Are you an author, or do you see a problem with this page? Request a review
