Cited by 16

The DOI matches its Crossref record; 4 of the 4 references it cites were found in a registry or an index.

Epac2 in midbrain dopamine neurons contributes to cocaine reinforcement via enhancement of dopamine release

Liu, Xiaojie, Vickstrom, Casey R, Yu, Hao, Liu, Shuai, Snarrenberg, Shana Terai, Friedman, Vladislav, Mu, Lianwei, Chen, Bixuan, Kelly, Thomas J, Baker, David A, Liu, Qing-song·2022·eLife

Published version of a preprint

Abstract

Repeated exposure to drugs of abuse results in an upregulation of cAMP signaling in the mesolimbic dopamine system, a molecular adaptation thought to be critically involved in the development of drug dependence. Exchange protein directly activated by cAMP (Epac2) is a major cAMP effector abundantly expressed in the brain. However, it remains unknown whether Epac2 contributes to cocaine reinforcement. Here, we report that Epac2 in the mesolimbic dopamine system promotes cocaine reinforcement via enhancement of dopamine release. Conditional knockout of Epac2 from midbrain dopamine neurons (Epac2-cKO) and the selective Epac2 inhibitor ESI-05 decreased cocaine self-administration in mice under both fixed-ratio and progressive-ratio reinforcement schedules and across a broad range of cocaine doses. In addition, Epac2-cKO led to reduced evoked dopamine release, whereas Epac2 agonism robustly enhanced dopamine release in the nucleus accumbens in vitro. This mechanism is central to the behavioral effects of Epac2 disruption, as chemogenetic stimulation of ventral tegmental area (VTA) dopamine neurons via deschloroclozapine (DCZ)-induced activation of Gs-DREADD increased dopamine release and reversed the impairment of cocaine self-administration in Epac2-cKO mice. Conversely, chemogenetic inhibition of VTA dopamine neurons with Gi-DREADD reduced dopamine release and cocaine self-administration in wild-type mice. Epac2-mediated enhancement of dopamine release may therefore represent a novel and powerful mechanism that contributes to cocaine reinforcement.

Overview

The claims and statistics of this paper haven’t been checked yet.

Run the check — free, no account needed. It reads the open-access text and checks the sources it cites.

A few free checks a day · papers already verified open instantly · results are public

Integrity signals

Registry

Crossref · 10.7554/elife.80747

Cites

4 of 4 references verified0 citation errors · 0 not checkable

Statistics

Figures

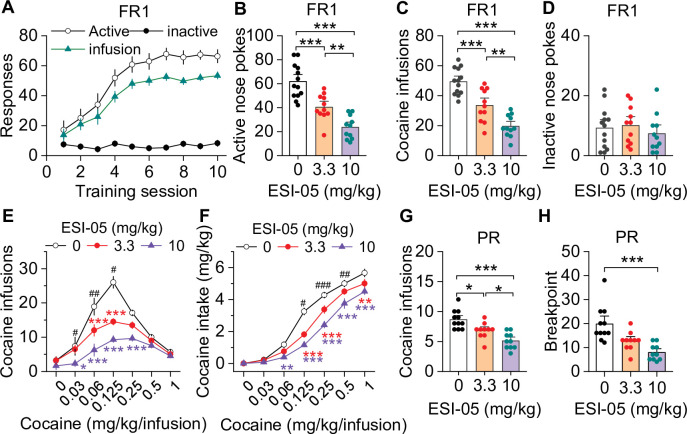
Figure 1. ESI-05 dose-dependently decreased cocaine self-administration under fixed ratio-1 (FR1) and progressive ratio (PR) reinforcement schedules in mice. (A) Active nose pokes and inactive nose pokes and cocaine infusions during 10-day FR1 self-administration training (0.5 mg/kg/infusion, n=18, 9 male and 9 female). The FR1 schedule has a brief timeout (10 s) period following each active nose poke during which additional nose pokes do not result in cocaine infusions. As a result, the number of nose pokes is higher than the number of cocaine infusions. (B–D) The mean number of active nose pokes (one-way ANOVA: F2,32 = 30.9, p<0.001), cocaine infusions (one-way ANOVA: F2,32=31.9, p<0.001), and inactive nose pokes (one-way ANOVA: F2,32 = 0.5, p=0.613) in response to ESI-05 pretreatments (0, 3.3, 10 mg/kg, i.p.) under an FR1 reinforcement schedule (n=11–13, 6 male and 5–7 female per group). (E–F) ESI-05 pretreatments produced a significant downward shift in the dose-response curve for cocaine infusions (two-way repeated-measures ANOVA: ESI-05 treatment, F2,22 = 45.5, p<0.001; cocaine dose, F6,132 = 51.0, p<0.001; ESI-05 treatment × cocaine dose interaction, F12,132 = 6.5, p<0.001; 3.3 vs. 0 mg/kg ESI-05, red *; 10 vs. 0 mg/kg ESI-05, violet *; 3.3 vs. 10 mg/kg ESI-05 black #) and decreased total cocaine intake (two-way repeated-measures ANOVA: ESI-05 treatment, F2,22 = 66.5, p<0.001; cocaine dose, F6,132 = 498.1, p<0.001; ESI-05 × cocaine dose interaction, F12,132 = 6.7, p<0.001; 3.3 vs. 0 mg/kg ESI-05, red *; 10 vs. 0 mg/kg ESI-05 violet *; 3.3 vs. 10 mg/kg ESI-05 black #) on the dose-response curve (n=8–9, 5 male and 4 female). (G–H) ESI-05 dose-dependently decreased the number of cocaine infusions (one-way ANOVA: F2,28 = 16.1, p<0.001; n=10–11, 5 male and 5–6 female) and breakpoint (Brown-Forsythe equal variance: p<0.05; Kruskal-Wallis one-way ANOVA on ranks: ESI-05, H=17.5, p<0.001; n=10–11, 5 male and 5–6 female) under a PR reinforcement schedule. *p<0.05, **p<0.01, ***p<0.001; #p<0.05, ##p<0.01, ###p<0.001 (see also Figure 1—figure supplement 1).
Figure 1. ESI-05 dose-dependently decreased cocaine self-administration under fixed ratio-1 (FR1) and progressive ratio (PR) reinforcement schedules in mice. (A) Active nose pokes and inactive nose pokes and cocaine infusions during 10-day FR1 self-administration training (0.5 mg/kg/infusion, n=18, 9 male and 9 female). The FR1 schedule has a brief timeout (10 s) period following each active nose poke during which additional nose pokes do not result in cocaine infusions. As a result, the number of nose pokes is higher than the number of cocaine infusions. (B–D) The mean number of active nose pokes (one-way ANOVA: F2,32 = 30.9, p<0.001), cocaine infusions (one-way ANOVA: F2,32=31.9, p<0.001), and inactive nose pokes (one-way ANOVA: F2,32 = 0.5, p=0.613) in response to ESI-05 pretreatments (0, 3.3, 10 mg/kg, i.p.) under an FR1 reinforcement schedule (n=11–13, 6 male and 5–7 female per group). (E–F) ESI-05 pretreatments produced a significant downward shift in the dose-response curve for cocaine infusions (two-way repeated-measures ANOVA: ESI-05 treatment, F2,22 = 45.5, p<0.001; cocaine dose, F6,132 = 51.0, p<0.001; ESI-05 treatment × cocaine dose interaction, F12,132 = 6.5, p<0.001; 3.3 vs. 0 mg/kg ESI-05, red *; 10 vs. 0 mg/kg ESI-05, violet *; 3.3 vs. 10 mg/kg ESI-05 black #) and decreased total cocaine intake (two-way repeated-measures ANOVA: ESI-05 treatment, F2,22 = 66.5, p<0.001; cocaine dose, F6,132 = 498.1, p<0.001; ESI-05 × cocaine dose interaction, F12,132 = 6.7, p<0.001; 3.3 vs. 0 mg/kg ESI-05, red *; 10 vs. 0 mg/kg ESI-05 violet *; 3.3 vs. 10 mg/kg ESI-05 black #) on the dose-response curve (n=8–9, 5 male and 4 female). (G–H) ESI-05 dose-dependently decreased the number of cocaine infusions (one-way ANOVA: F2,28 = 16.1, p<0.001; n=10–11, 5 male and 5–6 female) and breakpoint (Brown-Forsythe equal variance: p<0.05; Kruskal-Wallis one-way ANOVA on ranks: ESI-05, H=17.5, p<0.001; n=10–11, 5 male and 5–6 female) under a PR reinforcement schedule. *p<0.05, **p<0.01, ***p<0.001; #p<0.05, ##p<0.01, ###p<0.001 (see also Figure 1—figure supplement 1).CC BY · PubMed Central
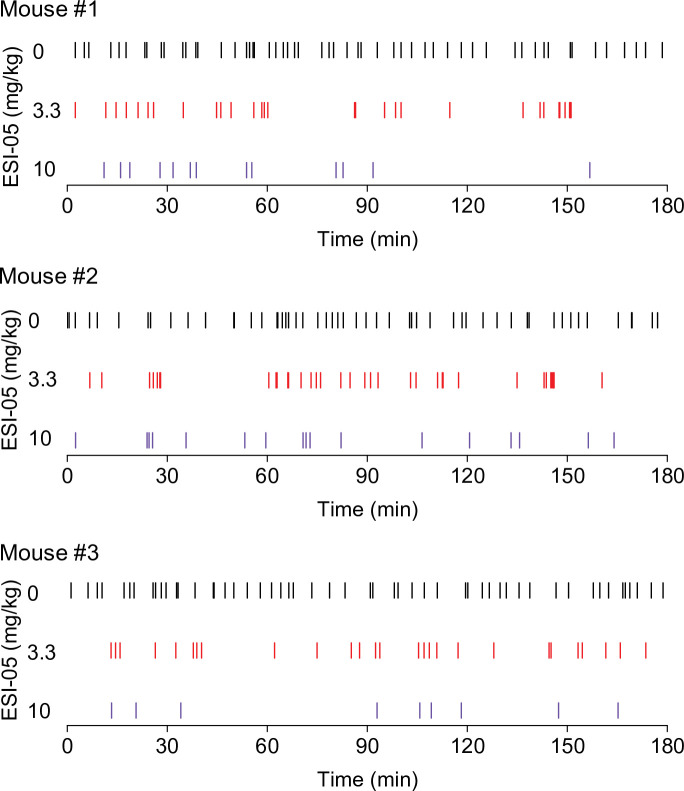
Figure 1—figure supplement 1. Representative temporal patterns of cocaine infusions in vehicle- and ESI-05-treated mice (associated with Figure 1). ESI-05 dose-dependently reduced the number of infusions, resulting in sporadic intake with uneven intervals.
Figure 1—figure supplement 1. Representative temporal patterns of cocaine infusions in vehicle- and ESI-05-treated mice (associated with Figure 1). ESI-05 dose-dependently reduced the number of infusions, resulting in sporadic intake with uneven intervals.CC BY · PubMed Central
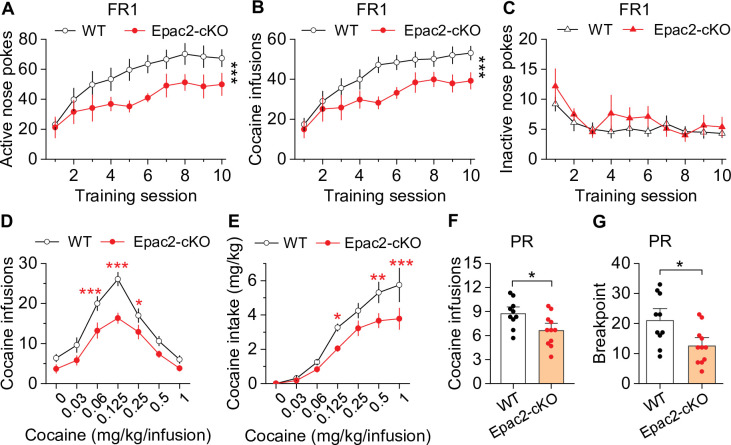
Figure 2. Dopamine neuron-specific knockout of Epac2 impaired cocaine self-administration acquisition and reinforcing efficacy. (A) Epac2 conditional knockout (Epac2-cKO) mice displayed significantly lower active nose pokes during fixed ratio-1 (FR1) self-administration training (two-way repeated-measures ANOVA: genotype, F1,19 = 8.2, p=0.010; training session, F9,171 = 10.0, p<0.001; genotype × training session interaction, F9,171 = 0.7, p=0.670; n=10–11, 5 male and 5–6 female per group). (B) The number of cocaine infusions during training was significantly reduced by Epac2-cKO (two-way repeated-measures ANOVA: genotype, F1,19 = 8.3, p=0.010; training session, F9,171 = 13.3, p<0.001; genotype × training session interaction, F9,171 = 0.9, p=0.543; n=10–11). (C) There was no significant difference in inactive nose pokes between genotypes (two-way repeated-measures ANOVA: genotype, F 1,19 = 1.4, p=0.247; n=10–11, 5 male and 5–6 female per group). (D–E) Epac2-cKO mice exhibited a downward shift in the cocaine dose-response curve ( two-way repeated-measures ANOVA: genotype, F1,15 = 20.0, p<0.001; cocaine dose, F6,90 = 49.4, p<0.001; genotype × cocaine dose interaction, F6,90 = 2.2, p=0.046; n=8–9, 4–5 male and 4 female per group) and decreased cocaine intake (two-way repeated-measures ANOVA: genotype, F 1,15 = 10.4, p=0.006; cocaine dose, F 6,90 = 62.0, p<0.001; genotype × cocaine dose interaction, F6,90 = 2.5, p=0.025; n=8–9, 4 male and 4–5 female per group). (F–G) Epac2-cKO mice displayed a reduced number of cocaine infusions (t-test: t19=2.6, p=0.019) and lower breakpoint (t-test: t19=2.7, p=0.015) under a progressive ratio (PR) reinforcement schedule (n=9–11, 5 male and 4–6 female per group). *p<0.05, **p<0.01, ***p<0.001 (see also Figure 2—figure supplements 1–4).
Figure 2. Dopamine neuron-specific knockout of Epac2 impaired cocaine self-administration acquisition and reinforcing efficacy. (A) Epac2 conditional knockout (Epac2-cKO) mice displayed significantly lower active nose pokes during fixed ratio-1 (FR1) self-administration training (two-way repeated-measures ANOVA: genotype, F1,19 = 8.2, p=0.010; training session, F9,171 = 10.0, p<0.001; genotype × training session interaction, F9,171 = 0.7, p=0.670; n=10–11, 5 male and 5–6 female per group). (B) The number of cocaine infusions during training was significantly reduced by Epac2-cKO (two-way repeated-measures ANOVA: genotype, F1,19 = 8.3, p=0.010; training session, F9,171 = 13.3, p<0.001; genotype × training session interaction, F9,171 = 0.9, p=0.543; n=10–11). (C) There was no significant difference in inactive nose pokes between genotypes (two-way repeated-measures ANOVA: genotype, F 1,19 = 1.4, p=0.247; n=10–11, 5 male and 5–6 female per group). (D–E) Epac2-cKO mice exhibited a downward shift in the cocaine dose-response curve ( two-way repeated-measures ANOVA: genotype, F1,15 = 20.0, p<0.001; cocaine dose, F6,90 = 49.4, p<0.001; genotype × cocaine dose interaction, F6,90 = 2.2, p=0.046; n=8–9, 4–5 male and 4 female per group) and decreased cocaine intake (two-way repeated-measures ANOVA: genotype, F 1,15 = 10.4, p=0.006; cocaine dose, F 6,90 = 62.0, p<0.001; genotype × cocaine dose interaction, F6,90 = 2.5, p=0.025; n=8–9, 4 male and 4–5 female per group). (F–G) Epac2-cKO mice displayed a reduced number of cocaine infusions (t-test: t19=2.6, p=0.019) and lower breakpoint (t-test: t19=2.7, p=0.015) under a progressive ratio (PR) reinforcement schedule (n=9–11, 5 male and 4–6 female per group). *p<0.05, **p<0.01, ***p<0.001 (see also Figure 2—figure supplements 1–4).CC BY · PubMed Central
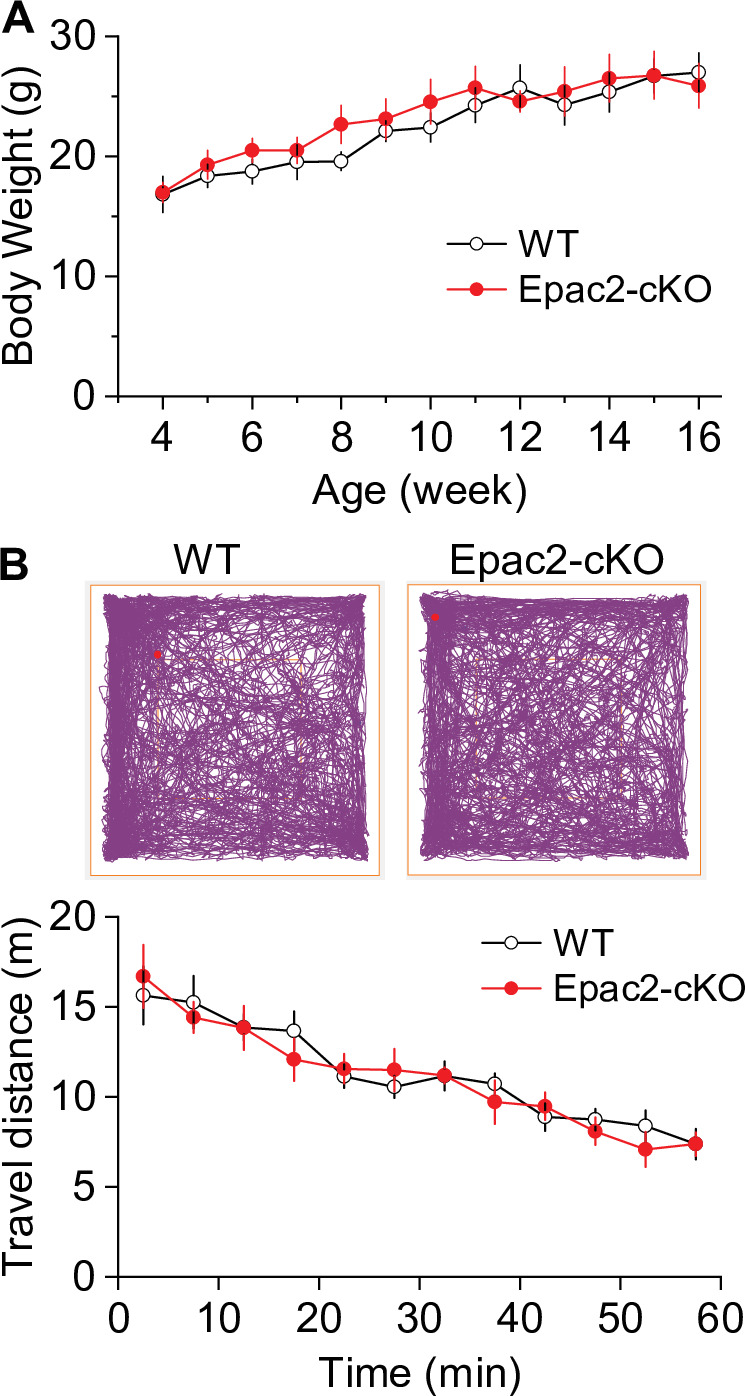
Figure 2—figure supplement 1. There were no significant differences in body weight and baseline locomotor activity between Epac2 conditional knockout (Epac2-cKO) and wild-type (WT) mice (associated with Figure 2). (A) Epac2-cKO and WT mice had no significant difference in body weight (t-test: t18=0.4, p=0.667) at 4–16 weeks of age. n=10, 5 male and 5 female per group. (B) During a 1 hr open-field test, Epac2-cKO and WT mice had no significant difference in baseline locomotor activity (two-way repeated-measures ANOVA: genotype, F1,14 = 0.1, p=0.799; time, F11,154 = 21.2, p<0.001; genotype × time interaction, F11,154 = 0.5, p=0.512). n=8, 4 male and 4 female per group.
Figure 2—figure supplement 1. There were no significant differences in body weight and baseline locomotor activity between Epac2 conditional knockout (Epac2-cKO) and wild-type (WT) mice (associated with Figure 2). (A) Epac2-cKO and WT mice had no significant difference in body weight (t-test: t18=0.4, p=0.667) at 4–16 weeks of age. n=10, 5 male and 5 female per group. (B) During a 1 hr open-field test, Epac2-cKO and WT mice had no significant difference in baseline locomotor activity (two-way repeated-measures ANOVA: genotype, F1,14 = 0.1, p=0.799; time, F11,154 = 21.2, p<0.001; genotype × time interaction, F11,154 = 0.5, p=0.512). n=8, 4 male and 4 female per group.CC BY · PubMed Central
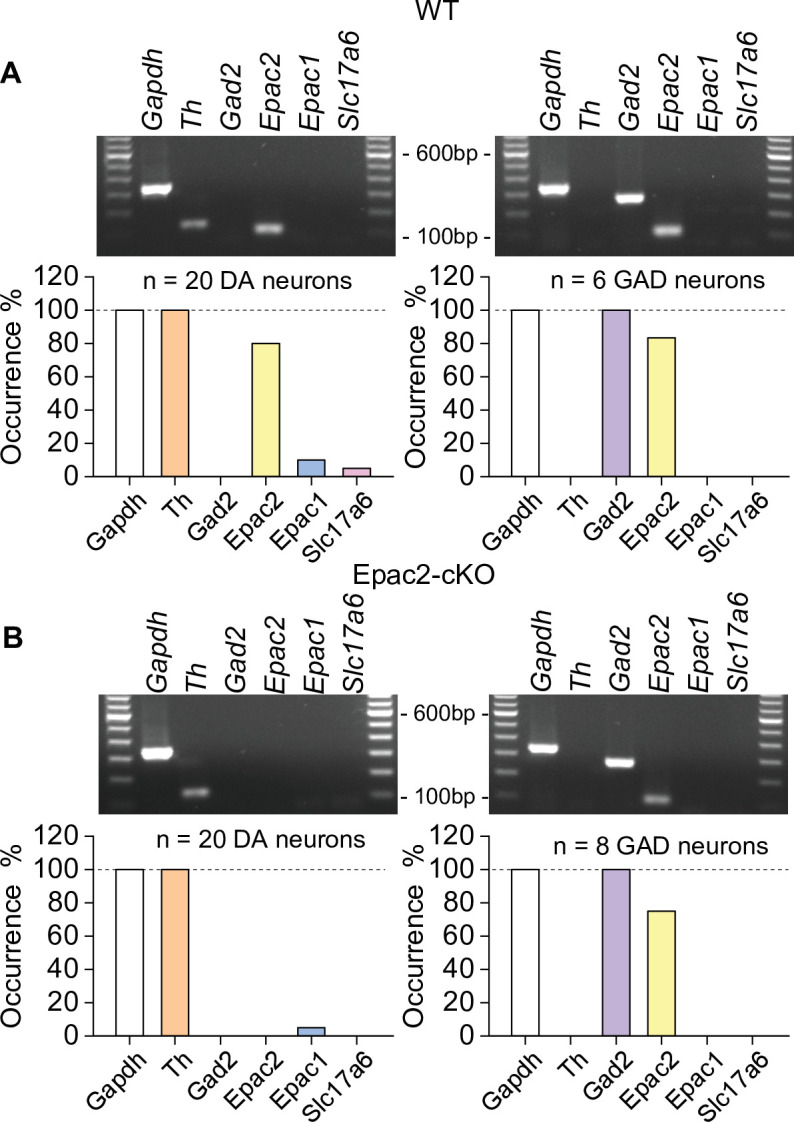
Figure 2—figure supplement 2. Epac2 was selectively deleted from midbrain dopamine neurons in Epac2 conditional knockout (Epac2-cKO) mice (associated with Figure 2). (A) In wild-type (WT) mice, Epac2 expression was detected in 80% of dopamine neurons (TH+) and 83% of GABAergic neurons (Gad2+). (B) In Epac2-cKO mice, Epac2 was not detected in any TH+ neurons but was present in 75% of Gad2+ neurons.
Figure 2—figure supplement 2. Epac2 was selectively deleted from midbrain dopamine neurons in Epac2 conditional knockout (Epac2-cKO) mice (associated with Figure 2). (A) In wild-type (WT) mice, Epac2 expression was detected in 80% of dopamine neurons (TH+) and 83% of GABAergic neurons (Gad2+). (B) In Epac2-cKO mice, Epac2 was not detected in any TH+ neurons but was present in 75% of Gad2+ neurons.CC BY · PubMed Central
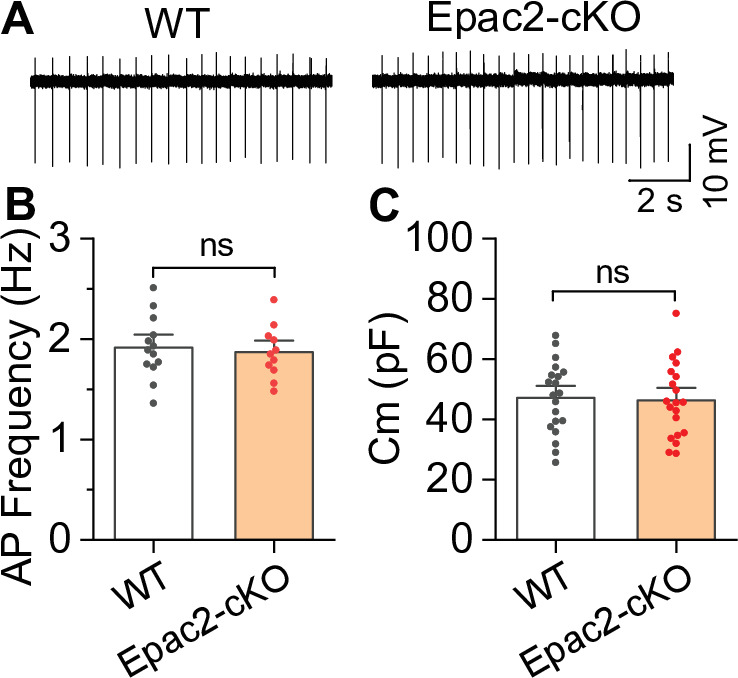
Figure 2—figure supplement 3. Epac2 conditional knockout (Epac2-cKO) did not alter the frequency of spontaneous action potential firing of ventral tegmental area (VTA) dopamine neurons (associated with Figure 2). (A–C) The frequency of action potential firing (t-test: t22=0.4, p=0.705; n=11–13 cells from 4 to 5 male and female mice) or membrane capacitance (t-test: t38=0.2, p=0.827; n=20 cells from 4 to 5 male and female mice) in VTA dopamine neurons were not significantly different between wild-type (WT) and Epac2-cKO mice. ns, not significant. p>0.05.
Figure 2—figure supplement 3. Epac2 conditional knockout (Epac2-cKO) did not alter the frequency of spontaneous action potential firing of ventral tegmental area (VTA) dopamine neurons (associated with Figure 2). (A–C) The frequency of action potential firing (t-test: t22=0.4, p=0.705; n=11–13 cells from 4 to 5 male and female mice) or membrane capacitance (t-test: t38=0.2, p=0.827; n=20 cells from 4 to 5 male and female mice) in VTA dopamine neurons were not significantly different between wild-type (WT) and Epac2-cKO mice. ns, not significant. p>0.05.CC BY · PubMed Central
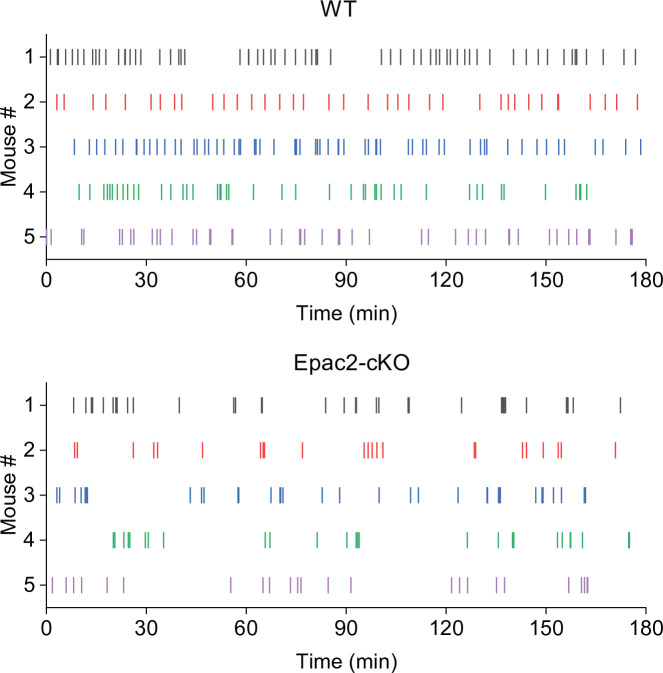
Figure 2—figure supplement 4. Representative temporal patterns of cocaine infusions in wild-type (WT) and Epac2 conditional knockout (Epac2-cKO) mice (associated with Figure 2). WT mice show predominantly even-spaced, high-rate cocaine responding, while Epac2-cKO mice exhibited sporadic intake interspersed by long gaps.
Figure 2—figure supplement 4. Representative temporal patterns of cocaine infusions in wild-type (WT) and Epac2 conditional knockout (Epac2-cKO) mice (associated with Figure 2). WT mice show predominantly even-spaced, high-rate cocaine responding, while Epac2-cKO mice exhibited sporadic intake interspersed by long gaps.CC BY · PubMed Central
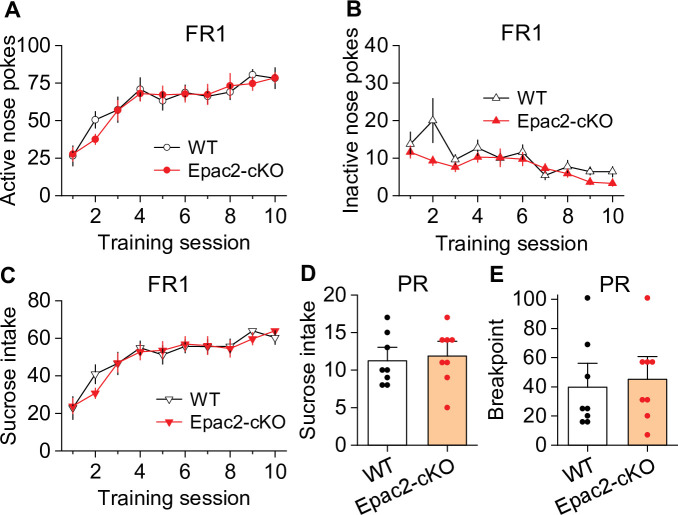
Figure 3. Epac2 conditional knockout (Epac2-cKO) did not affect sucrose self-administration under fixed ratio-1 (FR1) and progressive ratio (PR) reinforcement schedules in mice. (A–C) Epac2-cKO did not affect the acquisition of sucrose self-administration after 10 days of training under a FR1 schedule (two-way repeated-measures ANOVA: training session on active nose pokes, F9,126 = 20.8, p<0.001; training session on inactive nose pokes, F9,126 = 6.4, p<0.001; training session on sucrose intake, F9,126 = 21.3, p<0.001; genotype on active nose pokes, F1,14 = 0.07, p=0.802; genotype on inactive nose pokes, F1,14 = 3.1, p=0.099; genotype on sucrose rewards, F1,14 = 0.08, p=0.787; training session × genotype interaction in active nose pokes, F9,126 = 0.5, p=0.849; in inactive nose pokes, F9,126 = 1.5, p=0.151; in sucrose intake, F9,126 = 0.6, p=0.8). (D–E) Epac2-cKO did not alter the mean number of sucrose intake (t-test: t14=0.4, p=0.730) or breakpoints (Mann-Whitney rank: U=0.6, p=0.561) under a PR schedule. n=8, 4 male and 4 female per group (see also Figure 3—figure supplement 1).
Figure 3. Epac2 conditional knockout (Epac2-cKO) did not affect sucrose self-administration under fixed ratio-1 (FR1) and progressive ratio (PR) reinforcement schedules in mice. (A–C) Epac2-cKO did not affect the acquisition of sucrose self-administration after 10 days of training under a FR1 schedule (two-way repeated-measures ANOVA: training session on active nose pokes, F9,126 = 20.8, p<0.001; training session on inactive nose pokes, F9,126 = 6.4, p<0.001; training session on sucrose intake, F9,126 = 21.3, p<0.001; genotype on active nose pokes, F1,14 = 0.07, p=0.802; genotype on inactive nose pokes, F1,14 = 3.1, p=0.099; genotype on sucrose rewards, F1,14 = 0.08, p=0.787; training session × genotype interaction in active nose pokes, F9,126 = 0.5, p=0.849; in inactive nose pokes, F9,126 = 1.5, p=0.151; in sucrose intake, F9,126 = 0.6, p=0.8). (D–E) Epac2-cKO did not alter the mean number of sucrose intake (t-test: t14=0.4, p=0.730) or breakpoints (Mann-Whitney rank: U=0.6, p=0.561) under a PR schedule. n=8, 4 male and 4 female per group (see also Figure 3—figure supplement 1).CC BY · PubMed Central
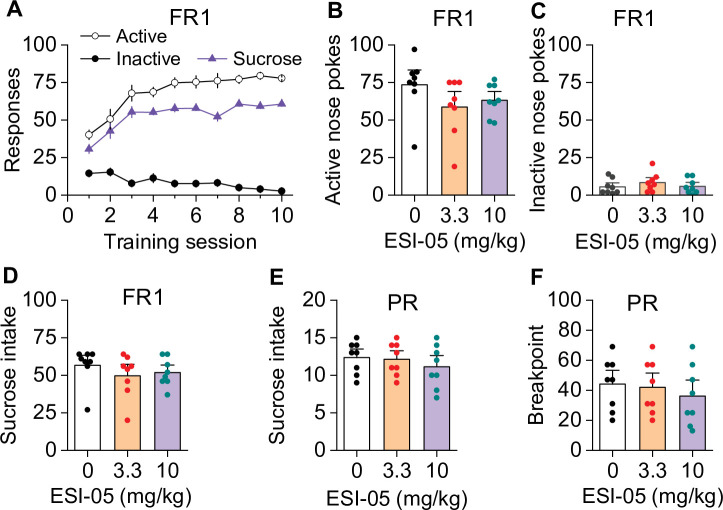
Figure 3—figure supplement 1. ESI-05 did not affect sucrose self-administration under fixed ratio-1 (FR1) and progressive ratio (PR) reinforcement schedules in mice (associated with Figure 3). Active and inactive nose pokes and sucrose reinforcers attained during the 10 days of FR1 self-administration training. (B–D) ESI-05 did not affect the mean number of active (one-way ANOVA: F2,21 = 1.65, p=0.217) and inactive nose pokes (one-way ANOVA: F2,21 = 0.67, p=0.525) or sucrose intake (one-way ANOVA: F2,21 = 0.69, p=0.512) under FR1 reinforcement schedule. (E–F) ESI-05 pretreatment did not affect sucrose intake (one-way ANOVA: F2,21 = 0.60, p=0.566) or breakpoint (one-way ANOVA: F2,21 = 0.40, p=0.681) under a PR reinforcement schedule. n=8, 4 male and 4 female per group.
Figure 3—figure supplement 1. ESI-05 did not affect sucrose self-administration under fixed ratio-1 (FR1) and progressive ratio (PR) reinforcement schedules in mice (associated with Figure 3). Active and inactive nose pokes and sucrose reinforcers attained during the 10 days of FR1 self-administration training. (B–D) ESI-05 did not affect the mean number of active (one-way ANOVA: F2,21 = 1.65, p=0.217) and inactive nose pokes (one-way ANOVA: F2,21 = 0.67, p=0.525) or sucrose intake (one-way ANOVA: F2,21 = 0.69, p=0.512) under FR1 reinforcement schedule. (E–F) ESI-05 pretreatment did not affect sucrose intake (one-way ANOVA: F2,21 = 0.60, p=0.566) or breakpoint (one-way ANOVA: F2,21 = 0.40, p=0.681) under a PR reinforcement schedule. n=8, 4 male and 4 female per group.CC BY · PubMed Central
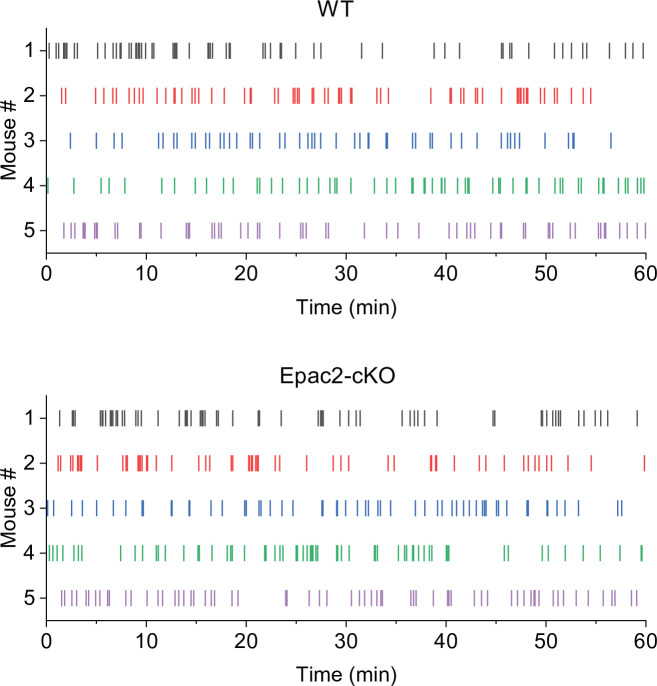
Figure 3—figure supplement 2. Representative temporal patterns of sucrose intake in wild-type (WT) and Epac2 conditional knockout (Epac2-cKO) mice (associated with Figure 3).
Figure 3—figure supplement 2. Representative temporal patterns of sucrose intake in wild-type (WT) and Epac2 conditional knockout (Epac2-cKO) mice (associated with Figure 3).CC BY · PubMed Central
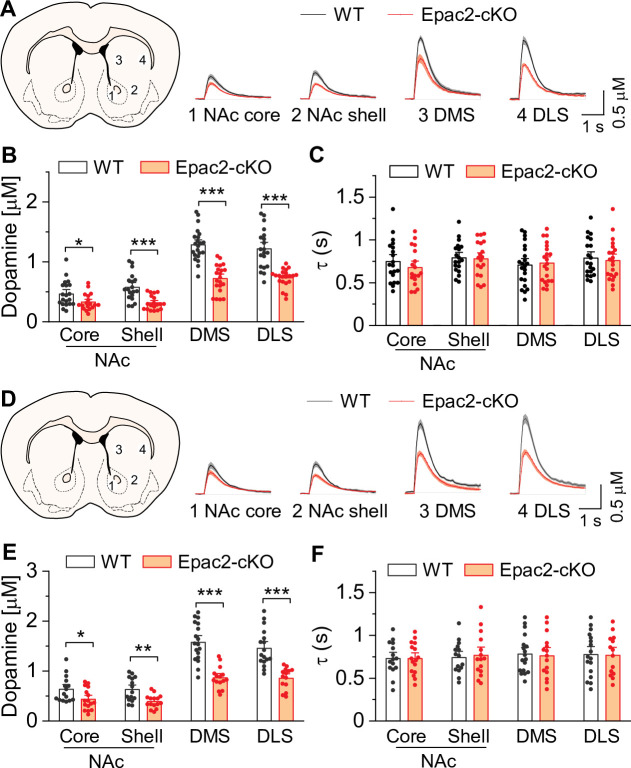
Figure 4. Epac2 knockout decreased evoked dopamine release in the striatum in vitro. (A) Averaged dopamine concentration vs. time traces from four different striatal subregions (nucleus accumbens [NAc] core, NAc shell, dorsal medial striatum [DMS] and dorsal lateral striatum [DLS]) evoked by a single electrical pulse. (B) Compared to wild-type (WT) mice, Epac2 conditional knockout (Epac2-cKO) mice displayed decreased evoked dopamine release across all striatum subregions in response to single pulse stimulation (t-tests: NAc core, t36=2.3, p=0.028; NAc shell, t36=4.4, p<0.001; DMS, t41=7.4, p<0.001; DLS, t39=6.1, p<0.001; n=18–22 slices from 4 to 5 male and female mice). (C) There were no significant differences in the decay time constants between WT and Epac2-cKO mice with single pulse stimulation across all recording sites (t-tests: NAc core, t36=0.9, p=0.366; NAc shell, t36=0.2, p=0.842; DMS, t41=0.3, p=0.736; DLS, t39=0.4, p=0.676; n=18–22 slices from 4 to 5 male and female mice). (D) Averaged dopamine concentration vs. time traces from four different striatal subregions in response to 100 Hz of 5-pulse electrical stimulation. (E) Compared to WT mice, Epac2-cKO mice displayed decreased evoked dopamine release across all striatum subregions in response to 5-pulse electrical stimulation (t-tests: NAc core, t29=2.4, p=0.025; NAc shell, t28=3.4, p=0.002; DMS, t31=6.3, p<0.001; DLS, t29=5.3, p<0.001; n=14–18 slices from 4 to 5 male and female mice). (F) There were no significant differences in the decay time constants between WT and Epac2-cKO mice with 5-pulse electrical stimulation (t-tests: NAc core, t29=0.006, p=0.999; NAc shell, t28=0.3, p=0.770; DMS, t31=0.3, p=0.801; DLS, t29=0.1, p=0.918; n=14–18 slices from 4 to 5 male and female mice). *p<0.05, **p<0.01, ***p<0.001.
Figure 4. Epac2 knockout decreased evoked dopamine release in the striatum in vitro. (A) Averaged dopamine concentration vs. time traces from four different striatal subregions (nucleus accumbens [NAc] core, NAc shell, dorsal medial striatum [DMS] and dorsal lateral striatum [DLS]) evoked by a single electrical pulse. (B) Compared to wild-type (WT) mice, Epac2 conditional knockout (Epac2-cKO) mice displayed decreased evoked dopamine release across all striatum subregions in response to single pulse stimulation (t-tests: NAc core, t36=2.3, p=0.028; NAc shell, t36=4.4, p<0.001; DMS, t41=7.4, p<0.001; DLS, t39=6.1, p<0.001; n=18–22 slices from 4 to 5 male and female mice). (C) There were no significant differences in the decay time constants between WT and Epac2-cKO mice with single pulse stimulation across all recording sites (t-tests: NAc core, t36=0.9, p=0.366; NAc shell, t36=0.2, p=0.842; DMS, t41=0.3, p=0.736; DLS, t39=0.4, p=0.676; n=18–22 slices from 4 to 5 male and female mice). (D) Averaged dopamine concentration vs. time traces from four different striatal subregions in response to 100 Hz of 5-pulse electrical stimulation. (E) Compared to WT mice, Epac2-cKO mice displayed decreased evoked dopamine release across all striatum subregions in response to 5-pulse electrical stimulation (t-tests: NAc core, t29=2.4, p=0.025; NAc shell, t28=3.4, p=0.002; DMS, t31=6.3, p<0.001; DLS, t29=5.3, p<0.001; n=14–18 slices from 4 to 5 male and female mice). (F) There were no significant differences in the decay time constants between WT and Epac2-cKO mice with 5-pulse electrical stimulation (t-tests: NAc core, t29=0.006, p=0.999; NAc shell, t28=0.3, p=0.770; DMS, t31=0.3, p=0.801; DLS, t29=0.1, p=0.918; n=14–18 slices from 4 to 5 male and female mice). *p<0.05, **p<0.01, ***p<0.001.CC BY · PubMed Central
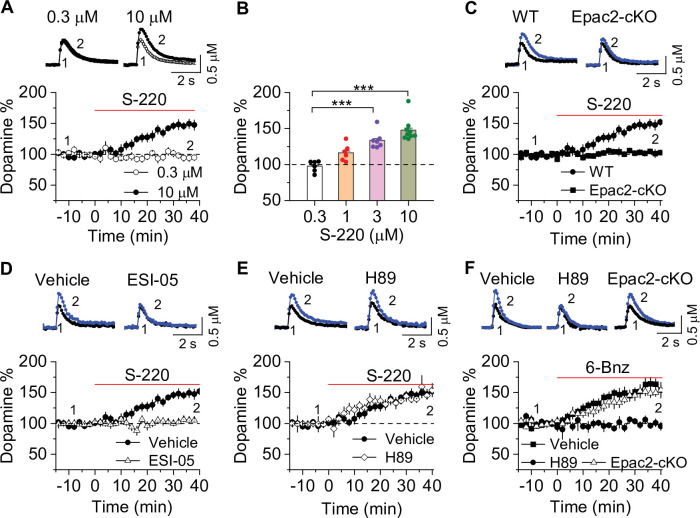
Figure 5. Epac2 activation increased dopamine release in the nucleus accumbens (NAc) in vitro. (A) Dopamine release was markedly increased by perfusion of S-220 (10 μM) in NAc slices from wild-type (WT) mice (paired t-test; t8=9.1, p<0.001; n=9 slices from 3 to 4 male and female mice). (B) S-220 increased dopamine release in a dose-dependent manner in NAc slices from WT mice (one-way ANOVA: F3,27 = 20.4, p<0.001, n=6–9 slices from 3 to 4 male and female mice). (C) S-220 (10 µM) did not increase dopamine release in NAc slices from Epac2 conditional knockout (Epac2-cKO) mice (paired t-test: t9 = 0.4, p=0.680, p=0.236; n=9 slices from 3 to 4 male and female mice). (D) Preincubation of slices with ESI-05 (20 µM) blocked the S-220-induced increase in dopamine release (t-test: t16=7.4, p<0.001; n=9 slices from 3 to 4 male and female mice). (E) Preincubation of slices with H89 (1 µM) did not alter the S-220-induced increase in dopamine release (t-test: t15 = 1.47, p=0.162; n=8–9 slices from 3 to 4 male and female mice). (F) 6-Bnz (1 µM) increased dopamine release in NAc slices prepared from WT mice (paired t-test: t8=6.5, p<0.001; n=9 slices from 3 to 4 male and female mice). The increase was blocked by H89 (1 µM; t-test: t14 = 5.1, p<0.001; n=7–9 slices from 3 to 4 male and female mice). 6-Bnz also induced an increase in dopamine release in slices from Epac2-cKO mice (paired t-test: t8=6.5, p<0.001; n=8 slices from 3 to 4 male and female mice), which was not significantly different from WT mice (t-test: t15=0.9, p=0.408; n=8–9 slices from 3 to 4 male and female mice). ***p<0.001.
Figure 5. Epac2 activation increased dopamine release in the nucleus accumbens (NAc) in vitro. (A) Dopamine release was markedly increased by perfusion of S-220 (10 μM) in NAc slices from wild-type (WT) mice (paired t-test; t8=9.1, p<0.001; n=9 slices from 3 to 4 male and female mice). (B) S-220 increased dopamine release in a dose-dependent manner in NAc slices from WT mice (one-way ANOVA: F3,27 = 20.4, p<0.001, n=6–9 slices from 3 to 4 male and female mice). (C) S-220 (10 µM) did not increase dopamine release in NAc slices from Epac2 conditional knockout (Epac2-cKO) mice (paired t-test: t9 = 0.4, p=0.680, p=0.236; n=9 slices from 3 to 4 male and female mice). (D) Preincubation of slices with ESI-05 (20 µM) blocked the S-220-induced increase in dopamine release (t-test: t16=7.4, p<0.001; n=9 slices from 3 to 4 male and female mice). (E) Preincubation of slices with H89 (1 µM) did not alter the S-220-induced increase in dopamine release (t-test: t15 = 1.47, p=0.162; n=8–9 slices from 3 to 4 male and female mice). (F) 6-Bnz (1 µM) increased dopamine release in NAc slices prepared from WT mice (paired t-test: t8=6.5, p<0.001; n=9 slices from 3 to 4 male and female mice). The increase was blocked by H89 (1 µM; t-test: t14 = 5.1, p<0.001; n=7–9 slices from 3 to 4 male and female mice). 6-Bnz also induced an increase in dopamine release in slices from Epac2-cKO mice (paired t-test: t8=6.5, p<0.001; n=8 slices from 3 to 4 male and female mice), which was not significantly different from WT mice (t-test: t15=0.9, p=0.408; n=8–9 slices from 3 to 4 male and female mice). ***p<0.001.CC BY · PubMed Central
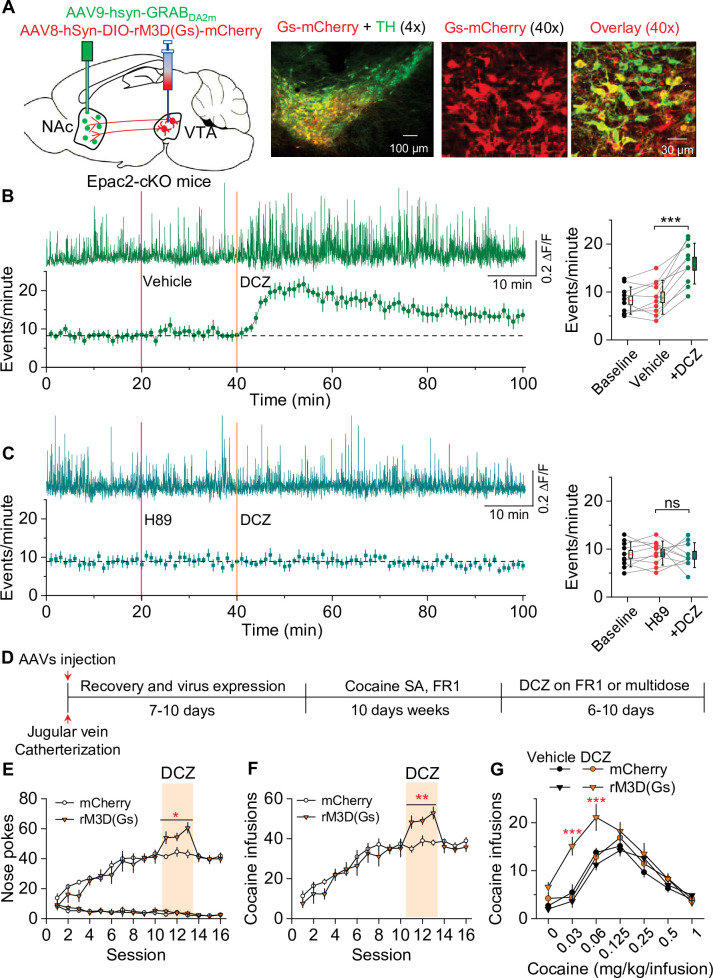
Figure 6. Chemogenetic enhancement of dopamine release increased cocaine self-administration in Epac2 conditional knockout (Epac2-cKO) mice. (A) AAV8-hSyn-DIO-rM3D(Gs)-mCherry (rM3D(Gs)) or AAV8-hSyn-DIO-mCherry (mCherry) was bilaterally microinjected into the ventral tegmental area (VTA) of Epac2-cKO mice. Immunohistochemistry in VTA sections showed that rM3D(Gs) and mCherry were expressed in the majority of TH+ dopamine neurons but not in TH- neurons. (B) Left, representative dopamine signal and the time course of dopamine transients in the nucleus accumbens (NAc) of Epac2-cKO mice before and after deschloroclozapine (DCZ). Right, DCZ (10 µg/kg, i.p.) significantly increased the frequency of dopamine transients in the NAc shell of Epac2-cKO mice following vehicle pretreatment (paired t-test: t9=7.6, p<0.001; n=10, 5 male and 5 female). (C) DCZ did not affect the dopamine transient frequency in mice which received H89 (1 mg/kg, i.p.) pretreatment (paired t-test: t9=0.1, p=0.889; n=10, 5 male and 5 female). (D) Timeline of AAV injection, cocaine self-administration and DCZ treatment. (E) DCZ pretreatment significantly increased active nose pokes (two-way repeated-measures ANOVA: rM3D(Gs), F1,14 = 12.8, p=0.003; time, F2,28 = 1.9, p=0.164; rM3D(Gs) × time interaction, F2,28 = 1.6, p=0.225) without affecting inactive nose pokes (two-way repeated-measures ANOVA: rM3D(Gs), F1,14 = 0.3, p=0.613; time, F2,28 = 3.0, p=0.065; rM3D(Gs) × time interaction, F2,28 = 1.7, p=0.209) in rM3D(Gs)-expressing Epac2-cKO mice under a fixed ratio-1 (FR1) schedule (n=7–9, 4 male and 3–5 female). (F) DCZ pretreatment significantly increased the number of cocaine infusions (rM3D(Gs), F1,14 = 17.8, p<0.001; time, F2,28 = 3.2, p=0.058; rM3D(Gs) × time interaction, F2,28 = 1.3, p=0.283; n=7–9, 4 male and 3–5 female) under an FR1 schedule in rM3D(Gs)-expressing Epac2-cKO mice. (G) DCZ produced an upward shift in the ascending limb of the cocaine dose-response curve in rM3D(Gs)-expressing Epac2-cKO mice (two-way repeated-measures ANOVA: rM3D(Gs), F3,30 = 8.1, p<0.001; cocaine dose, F6,180 = 79.3, p<0.001; rM3D(Gs) × cocaine dose interaction, F18,180 = 3.6, p<0.001; n=8–9, 4 male and 4–5 female). ns, p>0.05, *p<0.05, **p<0.01, ***p<0.001 (see also Figure 6—figure supplement 1).
Figure 6. Chemogenetic enhancement of dopamine release increased cocaine self-administration in Epac2 conditional knockout (Epac2-cKO) mice. (A) AAV8-hSyn-DIO-rM3D(Gs)-mCherry (rM3D(Gs)) or AAV8-hSyn-DIO-mCherry (mCherry) was bilaterally microinjected into the ventral tegmental area (VTA) of Epac2-cKO mice. Immunohistochemistry in VTA sections showed that rM3D(Gs) and mCherry were expressed in the majority of TH+ dopamine neurons but not in TH- neurons. (B) Left, representative dopamine signal and the time course of dopamine transients in the nucleus accumbens (NAc) of Epac2-cKO mice before and after deschloroclozapine (DCZ). Right, DCZ (10 µg/kg, i.p.) significantly increased the frequency of dopamine transients in the NAc shell of Epac2-cKO mice following vehicle pretreatment (paired t-test: t9=7.6, p<0.001; n=10, 5 male and 5 female). (C) DCZ did not affect the dopamine transient frequency in mice which received H89 (1 mg/kg, i.p.) pretreatment (paired t-test: t9=0.1, p=0.889; n=10, 5 male and 5 female). (D) Timeline of AAV injection, cocaine self-administration and DCZ treatment. (E) DCZ pretreatment significantly increased active nose pokes (two-way repeated-measures ANOVA: rM3D(Gs), F1,14 = 12.8, p=0.003; time, F2,28 = 1.9, p=0.164; rM3D(Gs) × time interaction, F2,28 = 1.6, p=0.225) without affecting inactive nose pokes (two-way repeated-measures ANOVA: rM3D(Gs), F1,14 = 0.3, p=0.613; time, F2,28 = 3.0, p=0.065; rM3D(Gs) × time interaction, F2,28 = 1.7, p=0.209) in rM3D(Gs)-expressing Epac2-cKO mice under a fixed ratio-1 (FR1) schedule (n=7–9, 4 male and 3–5 female). (F) DCZ pretreatment significantly increased the number of cocaine infusions (rM3D(Gs), F1,14 = 17.8, p<0.001; time, F2,28 = 3.2, p=0.058; rM3D(Gs) × time interaction, F2,28 = 1.3, p=0.283; n=7–9, 4 male and 3–5 female) under an FR1 schedule in rM3D(Gs)-expressing Epac2-cKO mice. (G) DCZ produced an upward shift in the ascending limb of the cocaine dose-response curve in rM3D(Gs)-expressing Epac2-cKO mice (two-way repeated-measures ANOVA: rM3D(Gs), F3,30 = 8.1, p<0.001; cocaine dose, F6,180 = 79.3, p<0.001; rM3D(Gs) × cocaine dose interaction, F18,180 = 3.6, p<0.001; n=8–9, 4 male and 4–5 female). ns, p>0.05, *p<0.05, **p<0.01, ***p<0.001 (see also Figure 6—figure supplement 1).CC BY · PubMed Central
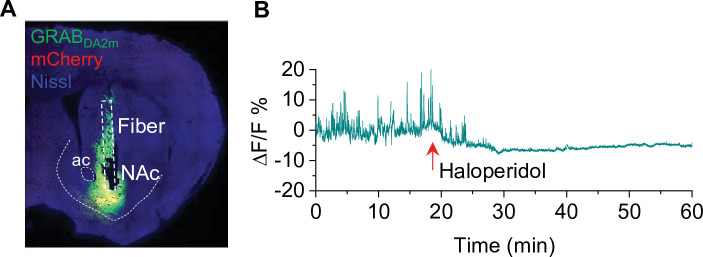
Figure 6—figure supplement 1. Verification of GRABDA2m injection and activity in the nucleus accumbens (NAc) (associated with Figure 6). (A) mCherry and GRABDA2m expression in the NAc after viral injection. The cannula implantation was targeted to the virus injection site in the NAc (n = 3 mice). (B) The D2 receptor antagonist haloperidol (0.1 mg/kg, i.p.) abolished GRABDA2m dopamine signals within 10 min of treatment and caused a decrease in baseline GRABDA2m fluorescence. n=3.
Figure 6—figure supplement 1. Verification of GRABDA2m injection and activity in the nucleus accumbens (NAc) (associated with Figure 6). (A) mCherry and GRABDA2m expression in the NAc after viral injection. The cannula implantation was targeted to the virus injection site in the NAc (n = 3 mice). (B) The D2 receptor antagonist haloperidol (0.1 mg/kg, i.p.) abolished GRABDA2m dopamine signals within 10 min of treatment and caused a decrease in baseline GRABDA2m fluorescence. n=3.CC BY · PubMed Central
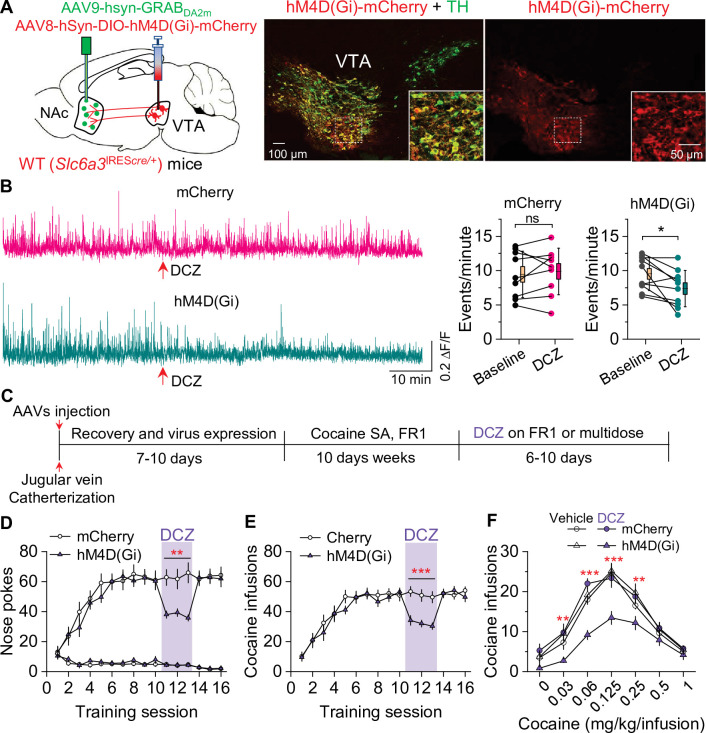
Figure 7. Chemogenetic inhibition of dopamine release decreased cocaine self-administration in wild-type (WT) mice. (A) AAV8-hSyn-DIO-hM4D(Gi)-mCherry (hM4D(Gi)) or AAV8-hSyn-DIO-mCherry (mCherry) was bilaterally microinjected into the ventral tegmental area (VTA) of WT mice, and the dopamine sensor AAV9-hsyn-DA2m (GRABDA2m) was injected into the NAc shell followed by implantation of a fiber-optic cannula. Immunohistochemistry showed that hM4D(Gi) was expressed in the majority of TH+ dopamine neurons (green) but was not expressed in TH- neurons in the VTA. (B) Left, representative dopamine signal in the nucleus accumbens (NAc) of WT mice before and after deschloroclozapine (DCZ) treatment. Right, DCZ (10 µg/kg, i.p.) did not alter the frequency of dopamine transients in mice with mCherry expression (paired t-test: t8=0.7, p=0.514; n=9, 5 male and 4 female). The frequency of dopamine transients was significantly decreased after DCZ treatment in WT mice expressing hM4D(Gi) in VTA dopamine neurons (paired t-test: t9=2.9, p=0.017; n=10, 5 male and 5 female). (C) Timeline of cocaine self-administration and DCZ treatment. (D–E) DCZ pretreatment significantly decreased active nose pokes (two-way repeated-measures ANOVA: hM4D(Gi), F1,15 = 18.6, p<0.001; time, F2,30 = 0.03, p=0.966; hM4D(Gi) × time interaction, F2,30 = 2.5, p=0.096) and cocaine infusions (two-way repeated-measures ANOVA: hM4D(Gi), F1,15 = 25.7, p<0.001; time, F2,30 = 2.2, p=0.132; hM4D(Gi) × time interaction, F2,30 = 0.02, p=0.986) without altering inactive nose pokes (hM4D(Gi), F1,15 = 0.01, p=0.911; time, F2,30 = 0.5, p=0.627; hM4D(Gi) × time interaction, F2,30 = 0.9, p=0.402) in hM4D(Gi)-expressing WT mice (n=8–9, 4 male and 4–5 female). (F) DCZ produced a significant downward shift of the cocaine dose-response curve (two-way repeated-measures ANOVA: hM4D(Gi), F3,26 = 13.8, p<0.001; cocaine dose, F6,156 = 100.2, p<0.001; hM4D(Gi) × cocaine dose interaction, F18,156 = 2.2, p=0.006; n=7–8, 4 male and 3–4 female) in WT mice that expressed hM4D(Gi) in VTA dopamine neurons. ns, p>0.05, *p<0.05, **p<0.01, ***p<0.001.
Figure 7. Chemogenetic inhibition of dopamine release decreased cocaine self-administration in wild-type (WT) mice. (A) AAV8-hSyn-DIO-hM4D(Gi)-mCherry (hM4D(Gi)) or AAV8-hSyn-DIO-mCherry (mCherry) was bilaterally microinjected into the ventral tegmental area (VTA) of WT mice, and the dopamine sensor AAV9-hsyn-DA2m (GRABDA2m) was injected into the NAc shell followed by implantation of a fiber-optic cannula. Immunohistochemistry showed that hM4D(Gi) was expressed in the majority of TH+ dopamine neurons (green) but was not expressed in TH- neurons in the VTA. (B) Left, representative dopamine signal in the nucleus accumbens (NAc) of WT mice before and after deschloroclozapine (DCZ) treatment. Right, DCZ (10 µg/kg, i.p.) did not alter the frequency of dopamine transients in mice with mCherry expression (paired t-test: t8=0.7, p=0.514; n=9, 5 male and 4 female). The frequency of dopamine transients was significantly decreased after DCZ treatment in WT mice expressing hM4D(Gi) in VTA dopamine neurons (paired t-test: t9=2.9, p=0.017; n=10, 5 male and 5 female). (C) Timeline of cocaine self-administration and DCZ treatment. (D–E) DCZ pretreatment significantly decreased active nose pokes (two-way repeated-measures ANOVA: hM4D(Gi), F1,15 = 18.6, p<0.001; time, F2,30 = 0.03, p=0.966; hM4D(Gi) × time interaction, F2,30 = 2.5, p=0.096) and cocaine infusions (two-way repeated-measures ANOVA: hM4D(Gi), F1,15 = 25.7, p<0.001; time, F2,30 = 2.2, p=0.132; hM4D(Gi) × time interaction, F2,30 = 0.02, p=0.986) without altering inactive nose pokes (hM4D(Gi), F1,15 = 0.01, p=0.911; time, F2,30 = 0.5, p=0.627; hM4D(Gi) × time interaction, F2,30 = 0.9, p=0.402) in hM4D(Gi)-expressing WT mice (n=8–9, 4 male and 4–5 female). (F) DCZ produced a significant downward shift of the cocaine dose-response curve (two-way repeated-measures ANOVA: hM4D(Gi), F3,26 = 13.8, p<0.001; cocaine dose, F6,156 = 100.2, p<0.001; hM4D(Gi) × cocaine dose interaction, F18,156 = 2.2, p=0.006; n=7–8, 4 male and 3–4 female) in WT mice that expressed hM4D(Gi) in VTA dopamine neurons. ns, p>0.05, *p<0.05, **p<0.01, ***p<0.001.CC BY · PubMed Central
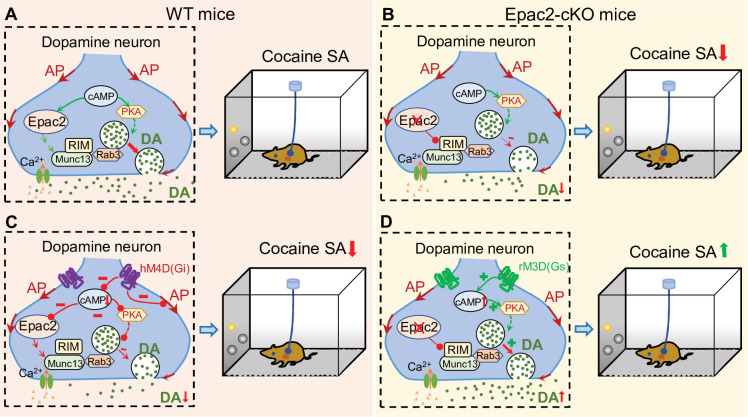
Figure 8. A hypothetical model that explains the relationship between Epac2 disruption, decreased dopamine release, and impairment of cocaine self-administration. (A) Epac2 is known to interact with the active zone proteins RIM, Munc13, and Rab3. A potential interaction of Epac2 with active zone proteins in the axonal varicosity of dopamine neurons facilitates dopamine exocytosis, which supports cocaine reinforcement during self-administration (SA). (B) Epac2 conditional knockout (Epac2-cKO) mice led to decreased dopamine release and cocaine SA. (C) hM4D(Gi)-mediated inhibition of action potential (AP) firing and dopamine release from axonal terminals of ventral tegmental area (VTA) dopamine neurons in WT mice led to a reduction of cocaine self-administration (mimicking the effect of Epac2-cKO). (D) Enhancing dopamine release via rM3D(Gs) activation in VTA dopamine neurons increases dopamine release via the PKA pathway and enhances cocaine self-administration in Epac2-cKO mice.
Figure 8. A hypothetical model that explains the relationship between Epac2 disruption, decreased dopamine release, and impairment of cocaine self-administration. (A) Epac2 is known to interact with the active zone proteins RIM, Munc13, and Rab3. A potential interaction of Epac2 with active zone proteins in the axonal varicosity of dopamine neurons facilitates dopamine exocytosis, which supports cocaine reinforcement during self-administration (SA). (B) Epac2 conditional knockout (Epac2-cKO) mice led to decreased dopamine release and cocaine SA. (C) hM4D(Gi)-mediated inhibition of action potential (AP) firing and dopamine release from axonal terminals of ventral tegmental area (VTA) dopamine neurons in WT mice led to a reduction of cocaine self-administration (mimicking the effect of Epac2-cKO). (D) Enhancing dopamine release via rM3D(Gs) activation in VTA dopamine neurons increases dopamine release via the PKA pathway and enhances cocaine self-administration in Epac2-cKO mice.CC BY · PubMed Central

Verification

Claims the paper makes

The claims and statistics of this paper haven’t been checked yet.

Run the check — free, no account needed. It reads the open-access text and checks the sources it cites.

A few free checks a day · papers already verified open instantly · results are public

Claims other papers make about this one

Each is checked against this paper’s own text: does it say what the citing paper says it does?

Self-check

Percentages, sums and reported differences re-computed from the paper’s own numbers.

The self-check needs the paper’s full text.

Citations

Cites

Show all 4 references

Research works printed but not linked: 75

  1. Acuna, 2016, How to make an active zone: unexpected universal functional redundancy between rims and RIM-bps, Neuron, 91, 792, 10.1016/j.neuron.2016.07.042 · DOI
  2. Anderson, 2005, Cocaine-induced alterations in dopamine receptor signaling: implications for reinforcement and reinstatement, Pharmacology & Therapeutics, 106, 389, 10.1016/j.pharmthera.2004.12.004 · DOI
  3. Anderson, 2018, Overexpression of the histone dimethyltransferase g9a in nucleus accumbens shell increases cocaine self-administration, stress-induced reinstatement, and anxiety, The Journal of Neuroscience, 38, 803, 10.1523/JNEUROSCI.1657-17.2017 · DOI
  4. Baameur, 2016, Epac1 interacts with importin β1 and controls neurite outgrowth independently of camp and rap1, Scientific Reports, 6, 10.1038/srep36370 · DOI
  5. Barrientos, 2018, Cocaine-induced structural plasticity in input regions to distinct cell types in nucleus accumbens, Biological Psychiatry, 84, 893, 10.1016/j.biopsych.2018.04.019 · DOI
  6. Benoit-Marand, 2000, Release and elimination of dopamine in vivo in mice lacking the dopamine transporter: functional consequences, The European Journal of Neuroscience, 12, 2985, 10.1046/j.1460-9568.2000.00155.x · DOI
  7. Cachope, 2012, Selective activation of cholinergic interneurons enhances accumbal phasic dopamine release: setting the tone for reward processing, Cell Reports, 2, 33, 10.1016/j.celrep.2012.05.011 · DOI
  8. Cahill, 2016, Bidirectional synaptic structural plasticity after chronic cocaine administration occurs through rap1 small gtpase signaling, Neuron, 89, 566, 10.1016/j.neuron.2016.01.031 · DOI
  9. Carelli, 2002, Nucleus accumbens cell firing during goal-directed behaviors for cocaine vs. “natural” reinforcement, Physiology & Behavior, 76, 379, 10.1016/s0031-9384(02)00760-6 · DOI
  10. Chen, 2018, High and low doses of cocaine intake are differentially regulated by dopamine D2 receptors in the ventral tegmental area and the nucleus accumbens, Neuroscience Letters, 671, 133, 10.1016/j.neulet.2018.02.026 · DOI
  11. Christensen, 2003, CAMP analog mapping of epac1 and CAMP kinase: discriminating analogs demonstrate that epac and CAMP kinase act synergistically to promote PC-12 cell neurite extension, The Journal of Biological Chemistry, 278, 35394, 10.1074/jbc.M302179200 · DOI
  12. Corre, 2018, Dopamine neurons projecting to medial shell of the nucleus accumbens drive heroin reinforcement, eLife, 7, 10.7554/eLife.39945 · DOI
  13. de Rooij, 1998, Epac is a rap1 guanine-nucleotide-exchange factor directly activated by cyclic AMP, Nature, 396, 474, 10.1038/24884 · DOI
  14. Di Chiara, 1988, Drugs abused by humans preferentially increase synaptic dopamine concentrations in the mesolimbic system of freely moving rats, PNAS, 85, 5274, 10.1073/pnas.85.14.5274 · DOI · Paper page
  15. Dong, 2017, Circuit and synaptic plasticity mechanisms of drug relapse, The Journal of Neuroscience, 37, 10867, 10.1523/JNEUROSCI.1821-17.2017 · DOI
  16. Fernandes, 2015, Epac2 mediates camp-dependent potentiation of neurotransmission in the hippocampus, The Journal of Neuroscience, 35, 6544, 10.1523/JNEUROSCI.0314-14.2015 · DOI
  17. Ferrero, 2013, β-adrenergic receptors activate exchange protein directly activated by camp (epac), translocate munc13-1, and enhance the rab3a-rim1α interaction to potentiate glutamate release at cerebrocortical nerve terminals, The Journal of Biological Chemistry, 288, 31370, 10.1074/jbc.M113.463877 · DOI
  18. Gainetdinov, 1998, Re-evaluation of the role of the dopamine transporter in dopamine system homeostasis, Brain Research. Brain Research Reviews, 26, 148, 10.1016/s0165-0173(97)00063-5 · DOI
  19. Hewer, 2011, PKA and epac synergistically inhibit smooth muscle cell proliferation, Journal of Molecular and Cellular Cardiology, 50, 87, 10.1016/j.yjmcc.2010.10.010 · DOI
  20. Hiranita, 2015, Medications discovery: importance of assessment of drug self administration dose-effect curves, Journal of Alcoholism and Drug Dependence, 3, 10.4172/2329-6488.1000e121 · DOI
  21. Kalivas, 2018, Deconstructing and reconstructing the dichotomy that is dopamine receptor-1- and dopamine receptor-2-expressing neurons, Biological Psychiatry, 84, 862, 10.1016/j.biopsych.2018.10.007 · DOI
  22. Kawasaki, 1998, A family of camp-binding proteins that directly activate rap1, Science, 282, 2275, 10.1126/science.282.5397.2275 · DOI
  23. Keck, 2014, A novel mglur5 antagonist, MFZ 10-7, inhibits cocaine-taking and cocaine-seeking behavior in rats, Addiction Biology, 19, 195, 10.1111/adb.12086 · DOI
  24. Koob, 1988, Cellular and molecular mechanisms of drug dependence, Science, 242, 715, 10.1126/science.2903550 · DOI · Paper page
  25. Laurent, 2012, Role of epac in brain and heart, Biochemical Society Transactions, 40, 51, 10.1042/BST20110642 · DOI
  26. Levy, 2007, Repeated electrical stimulation of reward-related brain regions affects cocaine but not “natural” reinforcement, The Journal of Neuroscience, 27, 14179, 10.1523/JNEUROSCI.4477-07.2007 · DOI
  27. Liu, 2016, Epac signaling is required for cocaine-induced change in AMPA receptor subunit composition in the ventral tegmental area, The Journal of Neuroscience, 36, 4802, 10.1523/JNEUROSCI.3186-15.2016 · DOI
  28. Liu, 2018, Dopamine secretion is mediated by sparse active zone-like release sites, Cell, 172, 706, 10.1016/j.cell.2018.01.008 · DOI
  29. Liu, 2018, VTA mtor signaling regulates dopamine dynamics, cocaine-induced synaptic alterations, and reward, Neuropsychopharmacology: Official Publication of the American College of Neuropsychopharmacology, 43, 1066, 10.1038/npp.2017.247 · DOI
  30. Liu, 2019, Mechanisms and regulation of dopamine release, Current Opinion in Neurobiology, 57, 46, 10.1016/j.conb.2019.01.001 · DOI
  31. Liu, 2022, CB2 agonist gw842166x protected against 6-OHDA-induced anxiogenic- and depressive-related behaviors in mice, Biomedicines, 10, 10.3390/biomedicines10081776 · DOI
  32. Mahler, 2018, Chemogenetic Manipulations of Ventral Tegmental Area Dopamine Neurons Reveal Multifaceted Roles in Cocaine Abuse, 10.1101/246595 · DOI
  33. Martín, 2020, β-adrenergic receptors/epac signaling increases the size of the readily releasable pool of synaptic vesicles required for parallel fiber LTP, The Journal of Neuroscience, 40, 8604, 10.1523/JNEUROSCI.0716-20.2020 · DOI
  34. Mello, 1996, Preclinical evaluation of pharmacotherapies for treatment of cocaine and opioid abuse using drug self-administration procedures, Neuropsychopharmacology, 14, 375, 10.1016/0893-133X(95)00274-H · DOI
  35. Meng, 2018, Spectrally resolved fiber photometry for multi-component analysis of brain circuits, Neuron, 98, 707, 10.1016/j.neuron.2018.04.012 · DOI
  36. Mereu, 2020, Modafinil potentiates cocaine self-administration by a dopamine-independent mechanism: possible involvement of gap junctions, Neuropsychopharmacology, 45, 1518, 10.1038/s41386-020-0680-5 · DOI
  37. Mu, 2021, Ibudilast attenuates cocaine self-administration and prime- and cue-induced reinstatement of cocaine seeking in rats, Neuropharmacology, 201, 10.1016/j.neuropharm.2021.108830 · DOI
  38. Nagai, 2020, Deschloroclozapine, a potent and selective chemogenetic actuator enables rapid neuronal and behavioral modulations in mice and monkeys, Nature Neuroscience, 23, 1157, 10.1038/s41593-020-0661-3 · DOI
  39. Nestler, 1990, Chronic cocaine treatment decreases levels of the G protein subunits gi alpha and go alpha in discrete regions of rat brain, Journal of Neurochemistry, 55, 1079, 10.1111/j.1471-4159.1990.tb04602.x · DOI · Paper page
  40. Nestler, 2001, Molecular basis of long-term plasticity underlying addiction, Nature Reviews. Neuroscience, 2, 119, 10.1038/35053570 · DOI
  41. Nestler, 2016, Reflections on: “A general role for adaptations in G-proteins and the cyclic AMP system in mediating the chronic actions of morphine and cocaine on neuronal function.”, Brain Research, 1645, 71, 10.1016/j.brainres.2015.12.039 · DOI
  42. O’Connor, 2011, The predictive validity of the rat self-administration model for abuse liability, Neuroscience and Biobehavioral Reviews, 35, 912, 10.1016/j.neubiorev.2010.10.012 · DOI
  43. Ogawa, 2018, Organization of dopamine and serotonin system: anatomical and functional mapping of monosynaptic inputs using rabies virus, Pharmacology, Biochemistry, and Behavior, 174, 9, 10.1016/j.pbb.2017.05.001 · DOI
  44. Ozaki, 2000, CAMP-GEFII is a direct target of camp in regulated exocytosis, Nature Cell Biology, 2, 805, 10.1038/35041046 · DOI · Paper page
  45. Patriarchi, 2018, Ultrafast neuronal imaging of dopamine dynamics with designed genetically encoded sensors, Science, 360, 10.1126/science.aat4422 · DOI
  46. Pereira, 2013, Epac2 mediates cardiac β1-adrenergic-dependent sarcoplasmic reticulum ca2+ leak and arrhythmia, Circulation, 127, 913, 10.1161/CIRCULATIONAHA.12.148619 · DOI
  47. Richardson, 1996, Progressive ratio schedules in drug self-administration studies in rats: a method to evaluate reinforcing efficacy, Journal of Neuroscience Methods, 66, 1, 10.1016/0165-0270(95)00153-0 · DOI
  48. Roberts, 2013, Conflation of cocaine seeking and cocaine taking responses in IV self-administration experiments in rats: methodological and interpretational considerations, Neuroscience and Biobehavioral Reviews, 37, 2026, 10.1016/j.neubiorev.2013.04.017 · DOI
  49. Roberts, 2020, GABA uptake transporters support dopamine release in dorsal striatum with maladaptive downregulation in a parkinsonism model, Nature Communications, 11, 10.1038/s41467-020-18247-5 · DOI
  50. Robichaux, 2018, Intracellular camp sensor EPAC: physiology, pathophysiology, and therapeutics development, Physiological Reviews, 98, 919, 10.1152/physrev.00025.2017 · DOI
  51. Romieu, 2008, Histone deacetylase inhibitors decrease cocaine but not sucrose self-administration in rats, The Journal of Neuroscience, 28, 9342, 10.1523/JNEUROSCI.0379-08.2008 · DOI
  52. Roth, 2016, DREADDs for neuroscientists, Neuron, 89, 683, 10.1016/j.neuron.2016.01.040 · DOI · Paper page
  53. Schmidt, 2010, Cocaine-induced neuroadaptations in glutamate transmission: potential therapeutic targets for craving and addiction, Annals of the New York Academy of Sciences, 1187, 35, 10.1111/j.1749-6632.2009.05144.x · DOI
  54. Schwede, 2015, Structure-guided design of selective epac1 and epac2 agonists, PLOS Biology, 13, 10.1371/journal.pbio.1002038 · DOI
  55. Shibasaki, 2004, Interaction of ATP sensor, camp sensor, ca2+ sensor, and voltage-dependent ca2+ channel in insulin granule exocytosis, The Journal of Biological Chemistry, 279, 7956, 10.1074/jbc.M309068200 · DOI
  56. Slosky, 2020, β-arrestin-biased allosteric modulator of ntsr1 selectively attenuates addictive behaviors, Cell, 181, 1364, 10.1016/j.cell.2020.04.053 · DOI
  57. Slosky, 2021, Establishment of Multi-Stage Intravenous Self-Administration Paradigms in Mice, 10.1101/2020.11.25.398503 · DOI
  58. Striplin, 1992, Correlation between behavioral sensitization to cocaine and G protein ADP-ribosylation in the ventral tegmental area, Brain Research, 579, 181, 10.1016/0006-8993(92)90049-f · DOI
  59. Sun, 2020, Next-generation GRAB sensors for monitoring dopaminergic activity in vivo, Nature Methods, 17, 1156, 10.1038/s41592-020-00981-9 · DOI
  60. Tengholm, 2017, CAMP signalling in insulin and glucagon secretion, Diabetes, Obesity & Metabolism, 19 Suppl 1, 42, 10.1111/dom.12993 · DOI
  61. Threlfell, 2012, Striatal dopamine release is triggered by synchronized activity in cholinergic interneurons, Neuron, 75, 58, 10.1016/j.neuron.2012.04.038 · DOI · Paper page
  62. Tong, 2017, The epac-phospholipase cε pathway regulates endocannabinoid signaling and cocaine-induced disinhibition of ventral tegmental area dopamine neurons, The Journal of Neuroscience, 37, 3030, 10.1523/JNEUROSCI.2810-16.2017 · DOI
  63. Tritsch, 2012, Dopaminergic modulation of synaptic transmission in cortex and striatum, Neuron, 76, 33, 10.1016/j.neuron.2012.09.023 · DOI · Paper page
  64. Tsalkova, 2012, Isoform-specific antagonists of exchange proteins directly activated by camp, PNAS, 109, 18613, 10.1073/pnas.1210209109 · DOI
  65. Vickstrom, 2020, T-type calcium channels contribute to burst firing in a subpopulation of medial habenula neurons, ENeuro, 7, 10.1523/ENEURO.0201-20.2020 · DOI
  66. Vickstrom, 2021, Role of endocannabinoid signaling in a septohabenular pathway in the regulation of anxiety- and depressive-like behavior, Molecular Psychiatry, 26, 3178, 10.1038/s41380-020-00905-1 · DOI
  67. Volkow, 2006, Cocaine cues and dopamine in dorsal striatum: mechanism of craving in cocaine addiction, The Journal of Neuroscience, 26, 6583, 10.1523/JNEUROSCI.1544-06.2006 · DOI · Paper page
  68. Volkow, 2012, Food and drug reward: overlapping circuits in human obesity and addiction, Current Topics in Behavioral Neurosciences, 11, 1, 10.1007/7854_2011_169 · DOI · Paper page
  69. Wang, 2018, Cascades of homeostatic dysregulation promote incubation of cocaine craving, The Journal of Neuroscience, 38, 4316, 10.1523/JNEUROSCI.3291-17.2018 · DOI
  70. Wolf, 2016, Synaptic mechanisms underlying persistent cocaine craving, Nature Reviews. Neuroscience, 17, 351, 10.1038/nrn.2016.39 · DOI
  71. Xi, 2017, CTDP-32476: A promising agonist therapy for treatment of cocaine addiction, Neuropsychopharmacology, 42, 682, 10.1038/npp.2016.155 · DOI
  72. Yang, 2012, EPAC null mutation impairs learning and social interactions via aberrant regulation of mir-124 and zif268 translation, Neuron, 73, 774, 10.1016/j.neuron.2012.02.003 · DOI
  73. Yorgason, 2011, Demon voltammetry and analysis software: analysis of cocaine-induced alterations in dopamine signaling using multiple kinetic measures, Journal of Neuroscience Methods, 202, 158, 10.1016/j.jneumeth.2011.03.001 · DOI
  74. Zimmer, 2011, Brain-cocaine concentrations determine the dose self-administered by rats on a novel behaviorally dependent dosing schedule, Neuropsychopharmacology, 36, 2741, 10.1038/npp.2011.165 · DOI
  75. Zinsmaier, 2022, Cocaine-induced projection-specific and cell type-specific adaptations in the nucleus accumbens, Molecular Psychiatry, 27, 669, 10.1038/s41380-021-01112-2 · DOI

Cited by

Sorted by citations

Metadata

Authors
Liu, X., Vickstrom, C. R., Yu, H., Liu, S., Snarrenberg, S. T., Friedman, V., Mu, L., Chen, B., Kelly, T. J., Baker, D. A., & Liu, Q.-S.
Venue
eLife
Published
2022-08-22
Volume
11
ISSN
2050-084X
Cited by
16
References
4
Language
en
Funders
  • National Institute on Drug Abuse (R01DA035217, R01DA047269, R01DA050180, F31DA054759)
  • National Institute of Mental Health (F30MH115536, MH121454)

About these checks

Registry, retraction, Cites and statistics results are computed, not judged, with one exception: a printed reference that no index lists is read once by a model before it counts as a citation error. Claims are extracted by a model and kept only when their quote appears verbatim in the text; each cited source is then checked, with a model’s help, for whether it says what the claim relies on. Those verdicts can be wrong — read the claim’s quote and the cited source before relying on one.

Statistics and arithmetic are recomputed, not judged.

Confidence bands are shown only for fields calibrated on our annotated test set. None is calibrated yet, so no band is shown.

What counts as a claim ›How we measure confidence ›How we check this ›

Are you an author, or do you see a problem with this page? Request a review