

The DOI matches its Crossref record; 48 of the 48 references it cites were found in a registry or an index.
Transcriptomic profiling of pancreatic alpha, beta and delta cell populations identifies delta cells as a principal target for ghrelin in mouse islets
Open accessAbstract
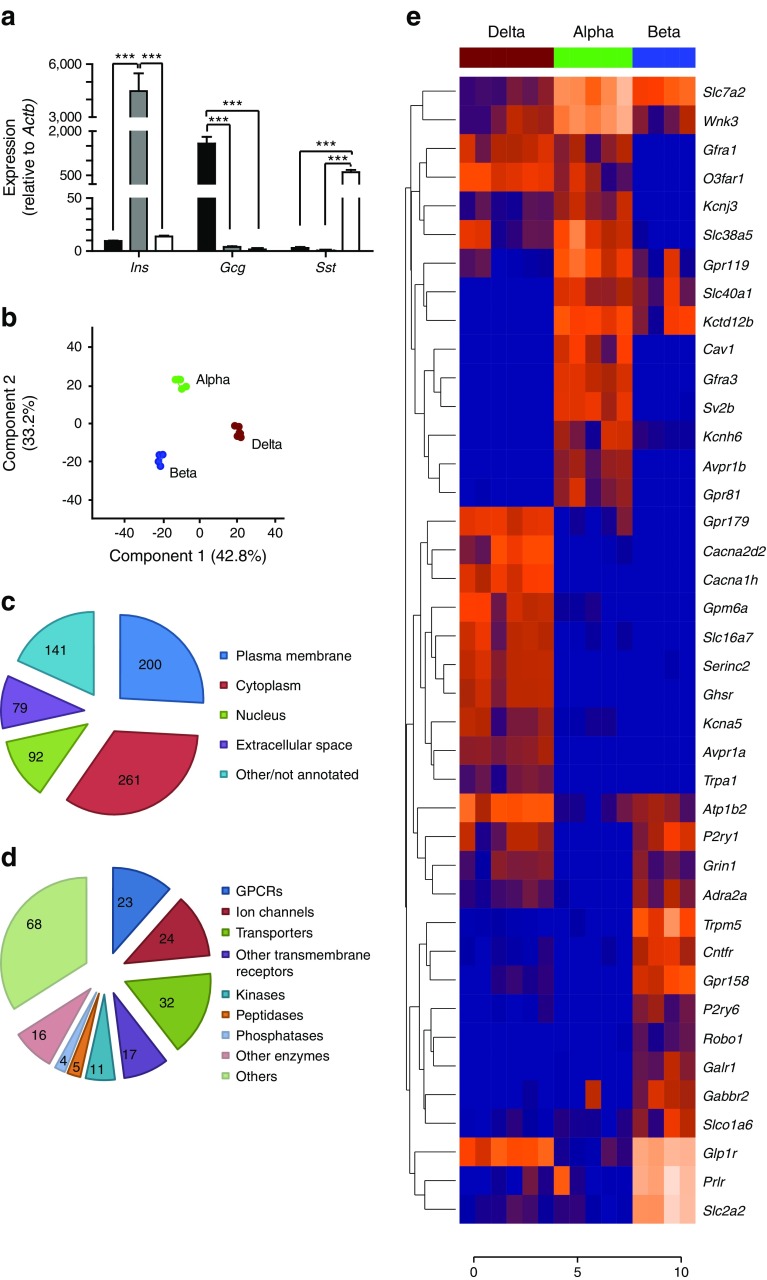
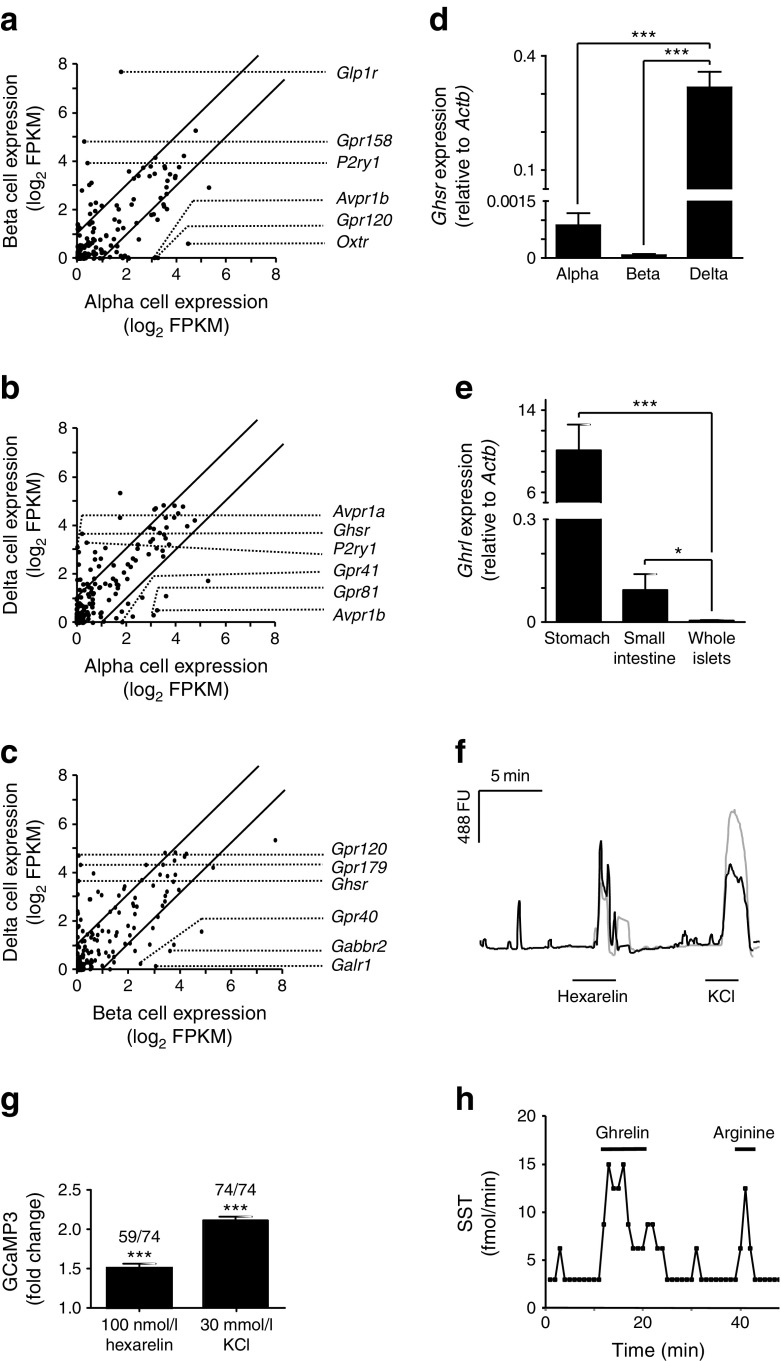
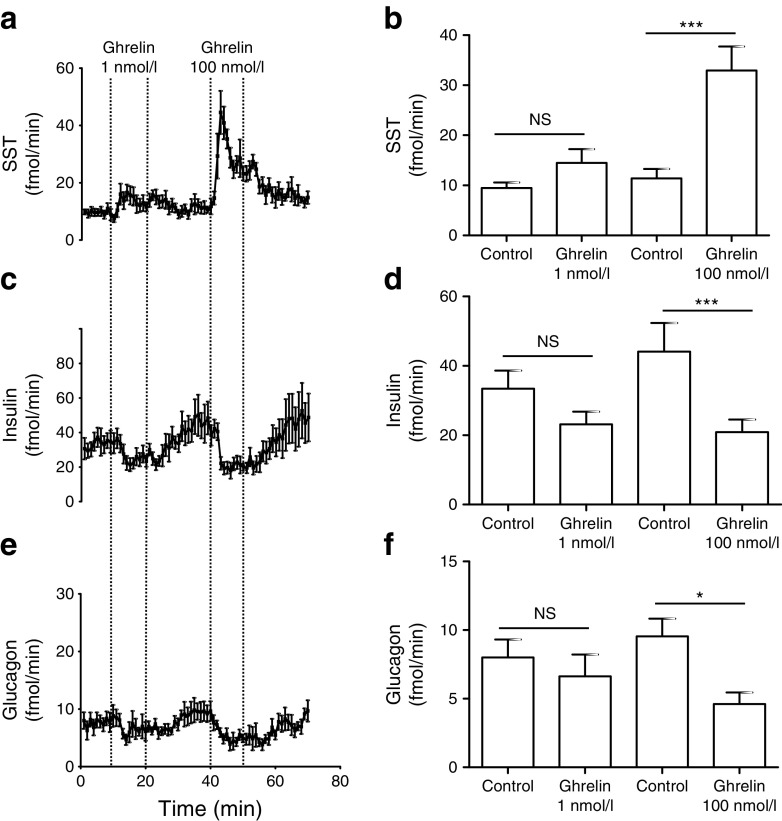
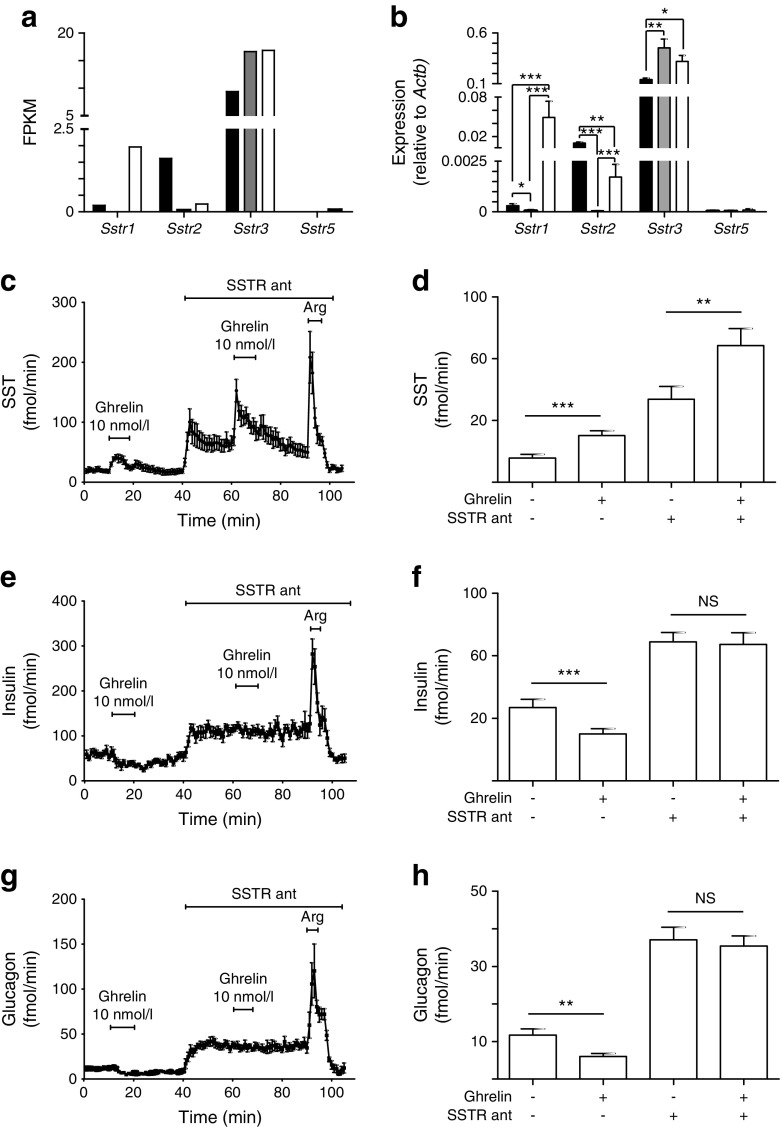
AIMS/HYPOTHESIS: Intra-islet and gut-islet crosstalk are critical in orchestrating basal and postprandial metabolism. The aim of this study was to identify regulatory proteins and receptors underlying somatostatin secretion though the use of transcriptomic comparison of purified murine alpha, beta and delta cells. METHODS: Sst-Cre mice crossed with fluorescent reporters were used to identify delta cells, while Glu-Venus (with Venus reported under the control of the Glu [also known as Gcg] promoter) mice were used to identify alpha and beta cells. Alpha, beta and delta cells were purified using flow cytometry and analysed by RNA sequencing. The role of the ghrelin receptor was validated by imaging delta cell calcium concentrations using islets with delta cell restricted expression of the calcium reporter GCaMP3, and in perfused mouse pancreases. RESULTS: A database was constructed of all genes expressed in alpha, beta and delta cells. The gene encoding the ghrelin receptor, Ghsr, was highlighted as being highly expressed and enriched in delta cells. Activation of the ghrelin receptor raised cytosolic calcium levels in primary pancreatic delta cells and enhanced somatostatin secretion in perfused pancreases, correlating with a decrease in insulin and glucagon release. The inhibition of insulin secretion by ghrelin was prevented by somatostatin receptor antagonism. CONCLUSIONS/INTERPRETATION: Our transcriptomic database of genes expressed in the principal islet cell populations will facilitate rational drug design to target specific islet cell types. The present study indicates that ghrelin acts specifically on delta cells within pancreatic islets to elicit somatostatin secretion, which in turn inhibits insulin and glucagon release. This highlights a potential role for ghrelin in the control of glucose metabolism.
Overview
The claims and statistics of this paper haven’t been checked yet.
Run the check — free, no account needed. It reads the open-access text and checks the sources it cites.
Integrity signals
Registry
Cites
Statistics
Figures
Verification
Claims the paper makes
The claims and statistics of this paper haven’t been checked yet.
Run the check — free, no account needed. It reads the open-access text and checks the sources it cites.
Claims other papers make about this one
Each is checked against this paper’s own text: does it say what the citing paper says it does?
The check wasn’t confident either way, so it gives no verdict — never disputed.
In the citing paper
“Both mouse (3, 146) and human (68, 475) β-cells express Hcn/HCN2-4.”
From Pancreatic β-Cell Electrical Activity and Insulin Secretion: Of Mice and Men (2018) · cites this paper as [3]
Experimental — accuracy not yet measuredThe check wasn’t confident either way, so it gives no verdict — never disputed.
In the citing paper
“which is expressed in mouse β-cells(3, 146).”
From Pancreatic β-Cell Electrical Activity and Insulin Secretion: Of Mice and Men (2018) · cites this paper as [3]
Experimental — accuracy not yet measuredThe check wasn’t confident either way, so it gives no verdict — never disputed.
In the citing paper
“However, these are only expressed at low levels in mouse and human β-cells alike (3, 68, 146, 475).”
From Pancreatic β-Cell Electrical Activity and Insulin Secretion: Of Mice and Men (2018) · cites this paper as [3]
Experimental — accuracy not yet measuredThe check wasn’t confident either way, so it gives no verdict — never disputed.
In the citing paper
“Both human and mouse β-cells also express Slc6a17/SLC6a17 (3, 68, 146, 475) that encodes a synaptic vesicle glycine transporter (502).”
From Pancreatic β-Cell Electrical Activity and Insulin Secretion: Of Mice and Men (2018) · cites this paper as [3]
Experimental — accuracy not yet measuredThe check wasn’t confident either way, so it gives no verdict — never disputed.
In the citing paper
“In human β-cells, only SYN1 is expressed, whereas mouse β-cells express both Syn1 and Syn2 (3, 68, 146, 475).”
From Pancreatic β-Cell Electrical Activity and Insulin Secretion: Of Mice and Men (2018) · cites this paper as [3]
Experimental — accuracy not yet measured
The check wasn’t confident either way, so it gives no verdict — never disputed.
In the citing paper
“These are both expressed at low levels in mouse and human β-cells (3, 68, 146, 475).”
From Pancreatic β-Cell Electrical Activity and Insulin Secretion: Of Mice and Men (2018) · cites this paper as [3]
Experimental — accuracy not yet measuredThe check wasn’t confident either way, so it gives no verdict — never disputed.
In the citing paper
“Mouse and human β-cells express CAPS1 (Cadps/CADPS) and low amounts of CAPS2 (Cadps2/CADPS2) (3, 68, 146, 475).”
From Pancreatic β-Cell Electrical Activity and Insulin Secretion: Of Mice and Men (2018) · cites this paper as [3]
Experimental — accuracy not yet measured
Self-check
Percentages, sums and reported differences re-computed from the paper’s own numbers.
The self-check needs the paper’s full text.
Citations
Cites
Ghrelin is a growth-hormone-releasing acylated peptide from stomach
Kojima, M., Hosoda, H., Date, Y., Nakazato, M., Matsuo, H., & Kangawa, K. (1999) · Nature · doi:10.1038/45230 · Cited by 8,479
Ghrelin induces adiposity in rodents
Tschöp, M., Smiley, D. L., & Heiman, M. L. (2000) · Nature · doi:10.1038/35038090 · Cited by 3,949
Watterson, K. R., Bestow, D., Gallagher, J. R., Hamilton, D. L., Ashford, F. B., Meakin, P. J., & Ashford, M. L. J. (2012) · Neurosignals · doi:10.1159/000334144 · Cited by 3,395
Cowley, M. A., Smith, R. G., Diano, S., Tschöp, M., Pronchuk, N., Grove, K. L., Strasburger, C. J., Bidlingmaier, M., Esterman, M., Heiman, M. L., et al. (2003) · Neuron · doi:10.1016/s0896-6273(03)00063-1 · Cited by 1,679
The tissue distribution of the mRNA of ghrelin and subtypes of its receptor, GHS-R, in humans.
Gnanapavan, S., Kola, B., Bustin, S., Morris, D., McGee, P. J., Fairclough, P., Bhattacharya, S., Carpenter, R., Grossman, A., & Korbonits, M. (2002) · Journal of Clinical Endocrinology and Metabolism · doi:10.1210/jcem.87.6.8739 · Cited by 1,507
Ariyasu, H., Takaya, K., Tagami, T., Ogawa, Y., Hosoda, K., Akamizu, T., Suda, M., Koh, T., Natsui, K., Toyooka, S., et al. (2001) · The Journal of Clinical Endocrinology & Metabolism · doi:10.1210/jcem.86.10.7885 · Cited by 1,300
Müller, T. D., Nogueiras, R., Andermann, M. L., Andrews, Z. B., Anker, S. D., Argente, J., Batterham, R. L., Benoit, S. C., Bowers, C. Y., Broglio, F., et al. (2015) · Molecular Metabolism · doi:10.1016/j.molmet.2015.03.005 · Cited by 1,034
Glucose Sensing in L Cells: A Primary Cell Study
Reimann, F., Habib, A. M., Tolhurst, G., Parker, H. E., Rogers, G. J., & Gribble, F. M. (2008) · Cell Metabolism · doi:10.1016/j.cmet.2008.11.002 · Cited by 733
Self-citationBroglio, F., Arvat, E., Benso, A. S., Gottero, C., Muccioli, G., Papotti, M. G., van der Lely, A. J., Deghenghi, R., & Ghigo, E. (2001) · The Journal of Clinical Endocrinology & Metabolism · doi:10.1210/jcem.86.10.8098 · Cited by 720
Glucagonocentric restructuring of diabetes: A pathophysiologic and therapeutic makeover
Unger, R. H., & Cherrington, A. D. (2012) · Journal of Clinical Investigation · doi:10.1172/jci60016 · Cited by 670
Cited by
Sorted by citations
Items 101–200 of 222
Class A and C GPCR Dimers in Neurodegenerative Diseases
Moreira, I. S., Caniceiro, A. B., Bueschbell, B., & Schiedel, A. C. (2022) · Current Neuropharmacology · doi:10.2174/1570159x20666220327221830 · Cited by 18
Hill, T. G., & Hill, D. J. (2024) · International Journal of Molecular Sciences · doi:10.3390/ijms25074070 · Cited by 21
Shankar, K., Takemi, S., Gupta, D., Varshney, S., Mani, B. K., Osborne-Lawrence, S. L., Metzger, N. P., Richard, C. P., Berglund, E. D., & Zigman, J. M. (2021) · JCI Insight · doi:10.1172/jci.insight.146983 · Cited by 19
The emerging role of heterodimerisation and interacting proteins in ghrelin receptor function
Price, M. L., Ley, C. D., & Gorvin, C. M. (2021) · Journal of Endocrinology · doi:10.1530/joe-21-0206 · Cited by 25
β Cell GHS-R Regulates Insulin Secretion and Sensitivity
Pradhan, G., Wu, C., Villarreal, D., Lee, J. H., Han, H. W., Gaharwar, A. K., Tian, Y., Fu, W., Guo, S., Smith, R. G., et al. (2021) · International Journal of Molecular Sciences · doi:10.3390/ijms22083950 · Cited by 19
Gap junction coupling and islet delta-cell function in health and disease
MIRANDA, C. A., Samad, M., Vergari, E., & Briant, L. J. B. (2021) · Peptides · doi:10.1016/j.peptides.2021.170704 · Cited by 21
Chronic GIPR agonism results in pancreatic islet GIPR functional desensitisation
Davies, I., Adriaenssens, A. E., Scott, W. R., Carling, D., Murphy, K. G., MINNION, J. S., Bloom, S. R., Jones, B. J., & Tan, T. (2025) · Molecular Metabolism · doi:10.1016/j.molmet.2025.102094 · Cited by 18
Self-citationA Novel Role for Somatostatin in the Survival of Mouse Pancreatic Beta Cells
Damsteegt, E. L., Hassan, Z., Hewawasam, N. V., Sarnsamak, K., Jones, P. M., & Hauge-Evans, A. C. (2019) · Cellular Physiology and Biochemistry · doi:10.33594/000000035 · Cited by 18
Murakami, T., Fujimoto, H., Fujita, N., Hamamatsu, K., Matsumoto, K., & Inagaki, N. (2019) · Endocrinology · doi:10.1210/en.2019-00556 · Cited by 18
RetractedAcyl-Ghrelin Influences Pancreatic β-Cell Function by Interference with KATP Channels
Kaiser, J., Krippeit‐Drews, P., & Drews, G. (2020) · Diabetes · doi:10.2337/db20-0231 · Cited by 18
Somatostatin and Its Receptor System in Colorectal Cancer
Kasprzak, A. (2021) · Biomedicines · doi:10.3390/biomedicines9111743 · Cited by 19
Intraislet Ghrelin Signaling Does Not Regulate Insulin Secretion From Adult Mice
Gray, S. M., Niu, J., Zhang, A., Svendsen, B., Campbell, J. E., D’Alessio, D. A., & Tong, J. (2019) · Diabetes · doi:10.2337/db19-0079 · Cited by 17
Self-citationThai, L. M., O’Reilly, L., Reibe, S., Sue, N., Holliday, H., Small, L., Schmitz‐Peiffer, C., Dhenni, R., Tsai, V. W.-W., Norris, N., et al. (2023) · iScience · doi:10.1016/j.isci.2023.106477 · Cited by 16
The emerging role of heterodimerisation and interacting proteins in ghrelin receptor function
Price, M. L., Ley, C. D., & Gorvin, C. M. (2022) · White Rose Research Online (University of Leeds, The University of Sheffield, University of York) · Cited by 17
Viloria, K., Nasteska, D., Ast, J., Hasib, A., Cuozzo, F., Heising, S., Briant, L. J. B., Hewison, M., & Hodson, D. J. (2022) · Diabetes · doi:10.2337/db22-0326 · Cited by 16
The role of GIPR in food intake control
James-Okoro, P.-P., Lewis, J. E., Gribble, F. M., & Reimann, F. M. (2025) · Frontiers in Endocrinology · doi:10.3389/fendo.2025.1532076 · Cited by 19
Self-citationHe, Z., Liu, Q., Wang, Y., Zhao, B., Zhang, L., Yang, X. V., & Wang, Z. (2025) · PeerJ · doi:10.7717/peerj.19192 · Cited by 25
Localized GLP1 receptor pre-internalization directs pancreatic alpha cell to beta cell communication
Tong, J. C. L., Frazer-Morris, C., Shilleh, A. H., Viloria, K., de Bray, A., Nair, A. M., Johnson, P., Spiers, R. M., Kobiita, A., Olaniru, O. E., et al. (2025) · Cell Metabolism · doi:10.1016/j.cmet.2025.06.009 · Cited by 20
Mu-u-min, R., Diané, A., Allouch, A., & Al-Siddiqi, H. (2023) · Biomedicines · doi:10.3390/biomedicines11061577 · Cited by 17
Yada, T., Dezaki, K., & Iwasaki, Y. (2025) · American Journal of Physiology-Cell Physiology · doi:10.1152/ajpcell.00168.2025 · Cited by 15
(Epi)genomic heterogeneity of pancreatic islet function and failure in type 2 diabetes
Lawlor, N. T., & Stitzel, M. L. (2019) · Molecular Metabolism · doi:10.1016/j.molmet.2019.06.002 · Cited by 18
Slow oscillations persist in pancreatic beta cells lacking phosphofructokinase M
Marinelli, I., Parekh, V. S., Fletcher, P. A., Thompson, B. M., Ren, J., Tang, X., Saunders, T. L., Ha, J., Sherman, A., Bertram, R., et al. (2022) · Biophysical Journal · doi:10.1016/j.bpj.2022.01.027 · Cited by 15
Byberg, S., Blond, M. B., Holm, S. K., Amadid, H., Bruhn, L., Clemmensen, K. K. B., Færch, K., & Holst, B. (2023) · American Journal of Physiology-Endocrinology and Metabolism · doi:10.1152/ajpendo.00023.2023 · Cited by 15
Status of ghrelin as an islet hormone and paracrine/autocrine regulator of insulin secretion
Dezaki, K., & Yada, T. (2021) · Peptides · doi:10.1016/j.peptides.2021.170681 · Cited by 14
Lewandowski, S. L., EL, K. M., & Campbell, J. E. (2024) · American Journal of Physiology-Endocrinology and Metabolism · doi:10.1152/ajpendo.00360.2023 · Cited by 15
Mawla, A. M., van der Meulen, T., & Huising, M. O. (2023) · BMC Genomics · doi:10.1186/s12864-023-09293-6 · Cited by 14
Röthe, J., Kraft, R., Ricken, A. M., Kaczmarek, I., Matz‐Soja, M., Winter, K., Dietzsch, A. N., Buchold, J., Ludwig, M., Liebscher, I., et al. (2024) · Communications Biology · doi:10.1038/s42003-024-05783-9 · Cited by 12
The relevance of adhesion G protein-coupled receptors in metabolic functions
Kaczmarek, I., Suchý, T., Prömel, S., Schöneberg, T., Liebscher, I., & Thor, D. (2021) · Biological Chemistry · doi:10.1515/hsz-2021-0146 · Cited by 14
Exploring G Protein-Coupled Receptor Signaling in Primary Pancreatic Islets
Röthe, J., Kraft, R., Schöneberg, T., & Thor, D. (2020) · Biological Procedures Online · doi:10.1186/s12575-019-0116-y · Cited by 12
Song, L., Yuan, J., Liu, Y., Zhang, D., Zhang, C., Lin, Q., Li, M., Su, K., Li, Y., Gao, G., et al. (2020) · Molecular Medicine Reports · doi:10.3892/mmr.2020.11481 · Cited by 14
Singh, B., Khattab, F., & Gilon, P. (2022) · Molecular Metabolism · doi:10.1016/j.molmet.2022.101495 · Cited by 12
Ghrelin deletion and conditional ghrelin cell ablation increase pancreatic islet size in mice
Gupta, D., Burstein, A. W., Schwalbe, D. C., Shankar, K., Varshney, S., Singh, O., Paul, S., Ogden, S. B., Osborne-Lawrence, S. L., Metzger, N. P., et al. (2023) · Journal of Clinical Investigation · doi:10.1172/jci169349 · Cited by 11
Viloria, K., Hewison, M., & Hodson, D. J. (2021) · The Journal of Physiology · doi:10.1113/jp280890 · Cited by 13
Targeting appetite and satiety in diabetes and obesity, via G protein-coupled receptors
Piper, N. B. C., Whitfield, E. A., Stewart, G. D., Xu, X., & Furness, S. G. B. (2022) · Biochemical Pharmacology · doi:10.1016/j.bcp.2022.115115 · Cited by 11
Gu, W., Anker, C. C. B., Christiansen, C., Moede, T., Berggren, P., Hermansen, K., Gregersen, S., & Jeppesen, P. B. (2021) · Nutrients · doi:10.3390/nu13072281 · Cited by 12
G protein-coupled receptors as regulators of pancreatic islet functionality
Thor, D. (2022) · Biochimica et Biophysica Acta (BBA) - Molecular Cell Research · doi:10.1016/j.bbamcr.2022.119235 · Cited by 10
Asadi, F., & Dhanvantari, S. (2019) · Frontiers in Endocrinology · doi:10.3389/fendo.2018.00792 · Cited by 9
High-Resolution Recording of the Circadian Oscillator in Primary Mouse α- and β-Cell Culture
Petrenko, V., Gosmain, Y., & Dibner, C. (2017) · Frontiers in Endocrinology · doi:10.3389/fendo.2017.00068 · Cited by 9
Ghrelin–LEAP2 interactions along the stomach–liver axis
Sakai, K., Nakazato, Y., Shiimura, Y., Zhang, W., & Nakazato, M. (2024) · Endocrine Journal · doi:10.1507/endocrj.ej24-0543 · Cited by 8
Pancreatic Islet Cell Hormones: Secretion, Function, and Diabetes Therapy
Ma, J., Mao, L., Yang, L., Xie, Q., Fan, R., Lu, X., Huang, X., Tong, N., & Duan, Z. (2025) · MedComm · doi:10.1002/mco2.70359 · Cited by 11
Pourhosseinzadeh, M. S., Huang, J. L., Shin, D., Hart, R. G., Framroze, L. Y., Guillen, J. V., Sánchez, J. P. M., Tirado, R. V., Unanwa, K., & Huising, M. O. (2025) · Proceedings of the National Academy of Sciences · doi:10.1073/pnas.2504151122 · Cited by 9
The GHSR1a antagonist LEAP2 regulates islet hormone release in a sex-specific manner
Hewawasam, N. V., Sakar, D., Bolton, O., Delishaj, B., Almutairi, M., King, A., Dereli, A. S., Despontin, C., Gilon, P., Reeves, S., et al. (2024) · Journal of Endocrinology · doi:10.1530/joe-24-0135 · Cited by 8
Ghrelin in rat pancreatic islets decreases islet blood flow
Drott, C. J., Franzèn, P., & Carlsson, P. (2019) · American Journal of Physiology-Endocrinology and Metabolism · doi:10.1152/ajpendo.00004.2019 · Cited by 8
Morriseau, T. S., Doucette, C. A., & Dolinsky, V. W. (2022) · American Journal of Physiology-Endocrinology and Metabolism · doi:10.1152/ajpendo.00411.2021 · Cited by 9
Pradhan, G., Lee, J. H., Wu, C., Wang, H., Lin, L., Donti, T., Graham, B. H., Rajan, A. S., Balasubramanyam, A., Samson, S. L., et al. (2022) · Biomolecules · doi:10.3390/biom12030407 · Cited by 8
Rodriguez, N. S., & Hartmann, P. (2025) · Pharmacological Reviews · doi:10.1016/j.pharmr.2025.100058 · Cited by 10
ErbB3 is required for hyperaminoacidemia-induced pancreatic α cell hyperplasia
Kang, Q., Jia, J., Dean, E. D., Yuan, H., Dai, C., Li, Z., Jiang, F., Zhang, X.-K., Powers, A. C., Chen, W., et al. (2024) · Journal of Biological Chemistry · doi:10.1016/j.jbc.2024.107499 · Cited by 7
Yang, M., Mandal, K., Södergren, M., Dumral, Ö., Winroth, L., & Tengholm, A. (2025) · Acta Physiologica · doi:10.1111/apha.14268 · Cited by 7
Incretin dysfunction and hyperglycemia in cystic fibrosis: Role of acyl-ghrelin
Sun, X., Yi, Y., Liang, B., Yu, Y., He, N., Ode, K. L., Uç, A., Wang, K., Gibson-Corley, K. N., Engelhardt, J. F., et al. (2019) · Journal of Cystic Fibrosis · doi:10.1016/j.jcf.2019.01.010 · Cited by 7
Clough, T. J., Baxan, N., Coakley, E. J., Rivas, C., Zhao, L., Leclerc, I., Martínez-Sánchez, A., Rutter, G. A., & Long, N. J. (2020) · Dalton Transactions · doi:10.1039/d0dt00332h · Cited by 7
Cilia Action in Islets: Lessons From Mouse Models
Cho, J. H., & Hughes, J. W. (2022) · Frontiers in Endocrinology · doi:10.3389/fendo.2022.922983 · Cited by 7
Cell Networks in Endocrine/Neuroendocrine Gland Function
Guérineau, N. C., Campos, P., Tissier, P. L., Hodson, D. J., & Mollard, P. (2022) · Comprehensive physiology · doi:10.1002/cphy.c210031 · Cited by 9
Ghrelin-GHSR-LEAP2 system in the pathophysiology of type 2 diabetes
Pu, Y., Yang, J., Li, W., Wen, Y., Zheng, C., Li, Y., Wu, L., Ming, Y., Zhao, C.-Y., & Chen, C. (2025) · iScience · doi:10.1016/j.isci.2025.113573 · Cited by 8
Molecular determinants and intracellular targets of taurine signalling in pancreatic islet β‐cells
Turbitt, J., Moffett, R. C., Brennan, L., Johnson, P., Flatt, P. R., McClenaghan, N. H., & Tarasov, A. I. (2024) · Acta Physiologica · doi:10.1111/apha.14101 · Cited by 8
Wang, Y., Pi, J.-C., Yao, Y.-F., Peng, X., Li, W., & Xie, M. (2024) · International Journal of Biological Macromolecules · doi:10.1016/j.ijbiomac.2024.136489 · Cited by 6
Nicotinic Signaling Stimulates Glucagon Secretion in Mouse and Human Pancreatic α-Cells
Hamilton, A., Zhang, Q., Gao, R., Hill, T. G., Salehi, A., Knudsen, J. G., Draper, M., Johnson, P. R. V., Rorsman, P., & Tarasov, A. (2024) · Diabetes · doi:10.2337/db23-0809 · Cited by 5
Bilal, A., Casu, A., Yi, F., Dutta, T., Mucinski, J. M., Mercouffer, G., Marak, M. C., Hompesch, M., Kelley, D., & Pratley, R. E. (2025) · Diabetes · doi:10.2337/db25-0096 · Cited by 5
Soriano, S., Castellano-Muñoz, M., Rafacho, A., Alonso‐Magdalena, P., Marroquí, L., Ruiz-Pino, A., Bru-Tarí, E., Merino, B., Irles, E., Belló-Pérez, M., et al. (2018) · Molecular and Cellular Endocrinology · doi:10.1016/j.mce.2018.09.009 · Cited by 6
Godazgar, M., Zhang, Q., Chibalina, M. V., & Rorsman, P. (2018) · The Journal of Physiology · doi:10.1113/jp275587 · Cited by 6
Chemical Biology Toolbox for Studying Pancreatic Islet Function – A Perspective
Huey, J., Keutler, K., & Schultz, C. (2020) · Cell chemical biology · doi:10.1016/j.chembiol.2020.07.023 · Cited by 5
A Membrane Permeable Prodrug of S223 for Selective Epac2 Activation in Living Cells
Xu, Y., Schwede, F., Wienk, H., Tengholm, A., & Rehmann, H. (2019) · Cells · doi:10.3390/cells8121589 · Cited by 5
Draper, M., Willems, M., Malahe, R. S. R. K., Hamilton, A., & Tarasov, A. I. (2021) · Journal of Imaging · doi:10.3390/jimaging7010009 · Cited by 4
The Ghrelin-LEAP2 System in Obesity and Diabetes: Pathophysiological Roles and Therapeutic Potential
Calero, I. V., Frühbeck, G., & Rodrı́guez, A. (2026) · Current Obesity Reports · doi:10.1007/s13679-026-00728-1 · Cited by 5
Pancreatic δ Cells: An Overlooked Cell in Focus
Golson, M. L. (2024) · Advances in anatomy, embryology and cell biology · doi:10.1007/978-3-031-62232-8_6 · Cited by 3
Glucagon-like peptide-1 and impaired counterregulatory responses to hypoglycemia in type 1 diabetes
Rocha, G. R., & de Melo, F. F. (2024) · World Journal of Diabetes · doi:10.4239/wjd.v16.i2.99928 · Cited by 3
Gfi1 Loss Protects against Two Models of Induced Diabetes
Napolitano, T., Avolio, F., Silvano, S., Forcisi, S., Pfeifer, A., Vieira, A., Sanz, S. N., Friano, M. E., Ayachi, C., Garrido‐Utrilla, A., et al. (2021) · Cells · doi:10.3390/cells10112805 · Cited by 4
Ghrelin does not impact the blunted counterregulatory response to recurrent hypoglycemia in mice
Shankar, K., Varshney, S., Gupta, D., Mani, B. K., Osborne-Lawrence, S. L., Metzger, N. P., Richard, C. P., & Zigman, J. M. (2023) · Frontiers in Endocrinology · doi:10.3389/fendo.2023.1181856 · Cited by 3
Impact of Ghrelin on Islet Size in Nonpregnant and Pregnant Female Mice
Gupta, D., Burstein, A. W., Shankar, K., Varshney, S., Singh, O., Osborne-Lawrence, S. L., Richard, C. P., & Zigman, J. M. (2024) · Endocrinology · doi:10.1210/endocr/bqae048 · Cited by 2
Han, H. W., Pradhan, G., Villarreal, D., Kim, D. M., Jain, A., Gaharwar, A., Tian, Y., Guo, S.-D., & Sun, Y. (2024) · Nutrients · doi:10.3390/nu16101464 · Cited by 3
Peart, L. A., Draper, M., & Tarasov, A. I. (2024) · Peptides · doi:10.1016/j.peptides.2024.171243 · Cited by 3
GPR41 and GPR43 modulate rodent pancreatic α-cell function and growth
Sánchez-Roncero, A., Fernández‐Marcelo, T., Perez-Serna, A. A., Martín, M. Á., Alberquilla, O., Sánchez‐Domínguez, R., Segovia, J. C., Escrivá, F., Gálvez, B. G., Álvarez, C., et al. (2025) · Life Sciences · doi:10.1016/j.lfs.2025.123913 · Cited by 2
Generating Human Pancreatic Tissue Slices to Study Endocrine and Exocrine Pancreas Physiology
Panzer, J. K., García, P. A., & Pugliese, A. (2024) · Journal of Visualized Experiments · doi:10.3791/66468 · Cited by 2
Ion Channels and Regulation of Insulin Secretion in Beta-Cells
Oluwamodupe, C., & Babalola, O. O. (2024) · Current Molecular Biology Reports · doi:10.1007/s40610-024-00162-z · Cited by 5
Khan, S., Gaivin, R. J., Liu, Z., Li, V., Samuels, I. S., Son, J., Osei‐Owusu, P., Garvin, J. L., Accili, D., & Schelling, J. R. (2025) · Journal of Clinical Investigation · doi:10.1172/jci192011 · Cited by 2
Nilsson, C. I., Dumral, Ö., Sanchez, G., Xie, B., Müller, A., Solimena, M., Ren, H., & Idevall‐Hagren, O. (2024) · bioRxiv (Cold Spring Harbor Laboratory) · doi:10.1101/2024.06.05.597562 · Cited by 2
Singh, S., Pavan, M. K., Barella, L. F., Telang, J., Shree, A., Agarwal, S., Goel, A., Thaleshwari, S., Wess, J., Zafar, H., et al. (2025) · bioRxiv (Cold Spring Harbor Laboratory) · doi:10.1101/2025.05.29.656754 · Cited by 2
SANCHEZ-ANDRES, J. V., Takeda, Y., & Leech, C. A. (2025) · Elsevier eBooks · doi:10.1016/b978-0-12-811114-7.00006-2 · Cited by 1
Skorkina, M., Kovaleva, T. F., Predeina, I., Smirnov, N., & Mukhina, I. V. (2026) · Cells · doi:10.3390/cells15040324 · Cited by 1
Singh, S., Pavan, M. K., BARELLA, L. F., Telang, J., Shree, A., Agarwal, S., Goel, A., Thaleshwari, S., Wess, J., Zafar, H., et al. (2026) · Molecular Metabolism · doi:10.1016/j.molmet.2026.102387 · Cited by 4
Hart, R. G., Lee, J. J., Zhai, K., Lee, S., Chauhan, R., Hosseini, A., Nguyen, A. D., & Huising, M. O. (2026) · Diabetologia · doi:10.1007/s00125-026-06769-4 · Cited by 2
Sosinski, O., Pruszyńska‐Oszmałek, E., Sassek, M., Leciejewska, N., Pawlak, P., & Kolodziejski, P. A. (2026) · International Journal of Molecular Sciences · doi:10.3390/ijms27177536 · Cited by 1
REININGER, L., Rehman, M., Hart, R., FERRAGNE, S., Tremblay, C. C., Éthier, M., Bouabcha, A., Kimple, M. E., Ghislain, J. J., Huising, M. O., et al. (2026) · Endocrinology · doi:10.1210/endocr/bqag111 · Cited by 1
Enteroendocrine Cells Sense Sucrose and Alter Enteric Neuron Excitability via Insulin Signaling
Snyder, J. R., Ahmed, M., Bhave, S. M., Hotta, R., Koppes, R. A., Goldstein, A. M., & Koppes, A. N. (2024) · Advanced Biology · doi:10.1002/adbi.202300566 · Cited by 1
Pathophysiological and morphological aspects of congenital hyperinsulinism. Review
Перминова, А. А. (2020) · Translational Medicine · doi:10.18705/2311-4495-2020-7-2-12-20 · Cited by 1
δ-α cell-to-cell interactions modulate pancreatic islet Ca2+ oscillation modesPreprint
Ren, H., Li, Y., Xie, B., Qian, W., Yu, Y., Chang, T., Yang, X., Sneppen, K., Chen, L., & Tang, C. (2024) · bioRxiv (Cold Spring Harbor Laboratory) · doi:10.1101/2024.08.21.608986 · Cited by 1
Hart, R. G., Lee, J. J., Zhai, K., Lee, S., Chauhan, R., Hosseini, A., Nguyen, A. D., & Huising, M. O. (2025) · bioRxiv (Cold Spring Harbor Laboratory) · doi:10.1101/2025.11.13.688371 · Cited by 1
Cyclic AMP links glucose stimulation to somatostatin secretion in δ-cells
Tengholm, A. (2019) · The Journal of General Physiology · doi:10.1085/jgp.201912417
Vitamin D-binding protein is required for the maintenance of α-cell function and glucagon secretionPreprint
Viloria, K., Nasteska, D., Briant, L. J. B., Heising, S., Larner, D. P., Fine, N. H. F., Ashford, F. B., Xavier, G. D. S., Ramos, M. J., Fox, J. E. M., et al. (2019) · bioRxiv (Cold Spring Harbor Laboratory) · doi:10.1101/2019.12.19.881185
Constructing roadmaps towards functional cell types using organoids
Beumer, J. (2020) · Utrecht University Repository (Utrecht University) · doi:10.33540/125
Li, B., Li, P., Wang, J., Liu, S., Ye, L., Pi, J., Peng, K., & Sun, Q. (2021) · International Journal of Morphology · doi:10.4067/s0717-95022021000501459
LEAP2 Reduces Postprandial Glucose Excursions and ad libitum Food Intake in Healthy MenPreprint
Hagemann, C. A., Jensen, M. S., Holm, S. K., Gasbjerg, L. S., Byberg, S., Skov‐Jeppesen, K., Hartmann, B., Holst, J. J., Dela, F., Vilsbøll, T., et al. (2021) · SSRN Electronic Journal · doi:10.2139/ssrn.3976479
Self-citationSecretion and Impact of Gut Hormones in Obesity and Diabetes
Holst, J. J. (2022) · Elsevier eBooks · doi:10.1016/b978-0-12-821618-7.00264-9
Self-citationNodweddu effaith signalu ghrelin-GHS-R ar awtoffagi niwronaidd
Roberts, L. D. (2022) · Cronfa (Swansea University) · doi:10.23889/suthesis.62285
Insulin biosynthesis and release in health and disease
Xavier, G. D. S. (2023) · Elsevier eBooks · doi:10.1016/b978-0-323-91707-0.00002-4
Panzer, J. K., Garcia, P. A., & Pugliese, A. (2024) · doi:10.3791/66468-v
Metabolic disorders associated with pancreatic dysfunction
Akash, M. S. H., & Rehman, K. (2025) · Elsevier eBooks · doi:10.1016/b978-0-443-36312-2.00009-7
MAFA Phosphorylation Controls Beta-Cell Identity and Sex-Specific Pancreatic Disease OutcomesPreprint
Ka, M., Druillennec, S., Chabi, S., Céline, R., Dave, Y. N., Péchoux, C., Messaoudi, C., Walczak, C., Soler, M., Besse, L., et al. (2025) · bioRxiv (Cold Spring Harbor Laboratory) · doi:10.1101/2025.06.11.659123
Ghrelin and relamorelin alleviate hypoglycaemia in humanised mice with congenital hyperinsulinismPreprint
Lithovius, V., Montaser, H., Saarimäki-Vire, J., Ibrahim, H., Barsby, T., Balboa, D., & Otonkoski, T. (2025) · bioRxiv · doi:10.1101/2025.10.02.680116
Mawla, A. M., van der Meulen, T., & Huising, M. O. (2023) · Figshare · doi:10.6084/m9.figshare.22649537
Mawla, A. M., van der Meulen, T., & Huising, M. O. (2023) · Figshare · doi:10.6084/m9.figshare.22649504
Metadata
- Authors
- Adriaenssens, A. E., Svendsen, B., Lam, B. Y. H., Yeo, G. S. H., Holst, J. J., Reimann, F., & Gribble, F. M.
- Affiliations
- Wellcome/MRC Institute of Metabolic Science (GB)
- University of Copenhagen (DK)
- Corresponding author
- Reimann, Frank
- Gribble, Fiona M.
- ORCID
- Venue
- Diabetologia
- Published
- 2016-07-07
- Volume
- 59
- Issue
- 10
- Pages
- 2156-2165
- ISSN
- 0012-186X (ISSN-L)
- 1432-0428
- PMC
- PMC5016554
- OpenAlex
- W2460804009
- Cited by
- 223
- References
- 48
- Citations by year
- 2026: 14 · 2025: 21 · 2024: 21 · 2023: 24 · 2022: 21 · 2021: 29 · 2020: 23 · 2019: 28 · 2018: 24 · 2017: 16 · 2016: 2
- FWCI
- 25.85
- Type
- journal article
- Language
- en
- Open access
- hybrid
- doi.org
- Locations
- Diabetologia (publishedVersion, cc-by)
- Europe PMC (PubMed Central) (publishedVersion, cc-by)
- PubMed Central (publishedVersion, cc-by)
- PubMed (publishedVersion)
- Research at the University of Copenhagen (University of Copenhagen) (publishedVersion, cc-by)
- Apollo (University of Cambridge) (submittedVersion, cc-by)
- Apollo (cc-by)
- Funders
- Wellcome Trust (106262/Z/14/Z)
- Medical Research Council (MRC_MC_UU_12012/5)
- Novo Nordisk Foundation
- Topics
- Health Sciences › Medicine › Endocrinology, Diabetes and Metabolism › Pancreatic function and diabetes
- Health Sciences › Medicine › Endocrinology, Diabetes and Metabolism › Diabetes Treatment and Management
- Life Sciences › Neuroscience › Cellular and Molecular Neuroscience › Neuropeptides and Animal Physiology
- Keywords
- ghrelin, growth hormone secretagogue receptor, pancreatic delta cells, somatostatin secretion, pancreatic islets, alpha cells, pancreatic beta cells, insulin secretion, glucagon secretion, glucose metabolism
- MeSH terms
- Animals, Calcium, Glucagon, Insulin, Islets of Langerhans, Male, Mice, Inbred C57BL, Mice, Transgenic, Somatostatin-Secreting Cells, Reverse Transcriptase Polymerase Chain Reaction, Glucagon-Secreting Cells, Insulin-Secreting Cells, Mice, Ghrelin, Transcriptome
About these checks
Registry, retraction, Cites and statistics results are computed, not judged, with one exception: a printed reference that no index lists is read once by a model before it counts as a citation error. Claims are extracted by a model and kept only when their quote appears verbatim in the text; each cited source is then checked, with a model’s help, for whether it says what the claim relies on. Those verdicts can be wrong — read the claim’s quote and the cited source before relying on one.
Statistics and arithmetic are recomputed, not judged.
Confidence bands are shown only for fields calibrated on our annotated test set. None is calibrated yet, so no band is shown.
What counts as a claim ›How we measure confidence ›How we check this ›
Are you an author, or do you see a problem with this page? Request a review
