

The DOI matches its Crossref record; 54 of the 54 references it cites were found in a registry or an index; 28 of the 48 sources its claims cite were checked for support.
TREM2 activation on microglia promotes myelin debris clearance and remyelination in a model of multiple sclerosis
Open accessAbstract
Multiple sclerosis (MS) is an inflammatory, demyelinating, and neurodegenerative disease of the central nervous system (CNS) triggered by autoimmune mechanisms. Microglia are critical for the clearance of myelin debris in areas of demyelination, a key step to allow remyelination. TREM2 is expressed by microglia and promotes microglial survival, proliferation, and phagocytic activity. Herein we demonstrate that TREM2 was highly expressed on myelin-laden phagocytes in active demyelinating lesions in the CNS of subjects with MS. In gene expression studies, macrophages from subjects with TREM2 genetic deficiency displayed a defect in phagocytic pathways. Treatment with a new TREM2 agonistic antibody promoted the clearance of myelin debris in the cuprizone model of CNS demyelination. Effects included enhancement of myelin uptake and degradation, resulting in accelerated myelin debris removal by microglia. Most importantly, antibody-dependent TREM2 activation on microglia increased density of oligodendrocyte precursors in areas of demyelination, as well as the formation of mature oligodendrocytes thus enhancing remyelination and axonal integrity. These results are relevant as they propose TREM2 on microglia as a potential new target to promote remyelination.
Overview
AI snapshot
Written from the paper’s full text.
TL;DR
In the cuprizone demyelination model, the TREM2 agonist antibody AL002a enhanced microglial myelin debris uptake and degradation, increased oligodendrocyte precursor density and maturation, and accelerated remyelination in Trem2+/− mice. TREM2 was highly expressed in active MS lesions, and macrophages from TREM2-deficient Nasu–Hakola patients showed downregulated phagocytic pathways.
Key findings
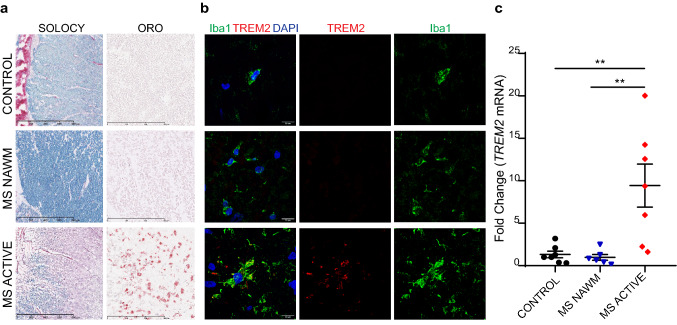
- TREM2 was highly expressed by Iba1+ myelin-laden phagocytes in active MS lesions; TREM2 mRNA was significantly higher in active MS lesions than in MS NAWM or control white matter (7 active lesion samples from 5 MS patients vs 6 NAWM samples from 3 MS patients vs 7 control samples from 4 controls; P < 0.01).
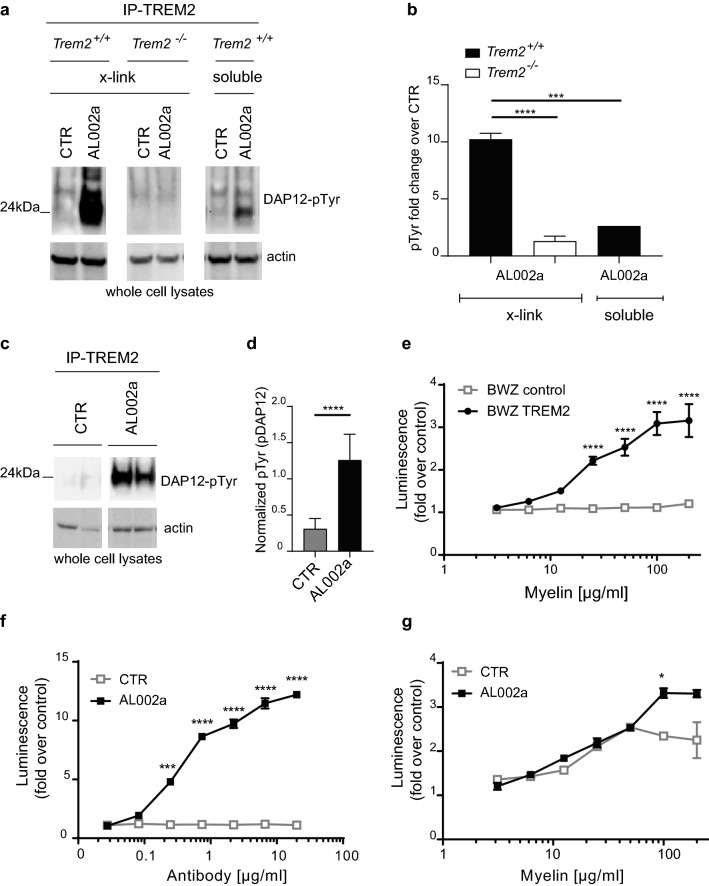
- AL002a acted as a TREM2 agonist: it induced DAP12 phosphorylation in Trem2+/+ but not Trem2−/− BMDM, activated TREM2 signaling in a reporter assay, and potentiated myelin-induced signaling at myelin concentrations >100 µg/ml.
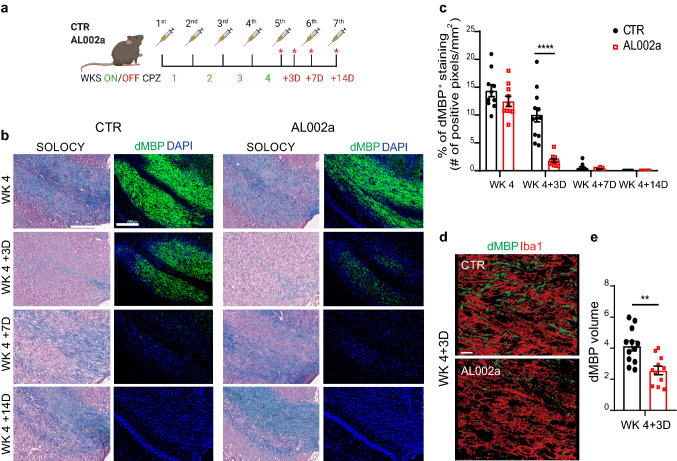
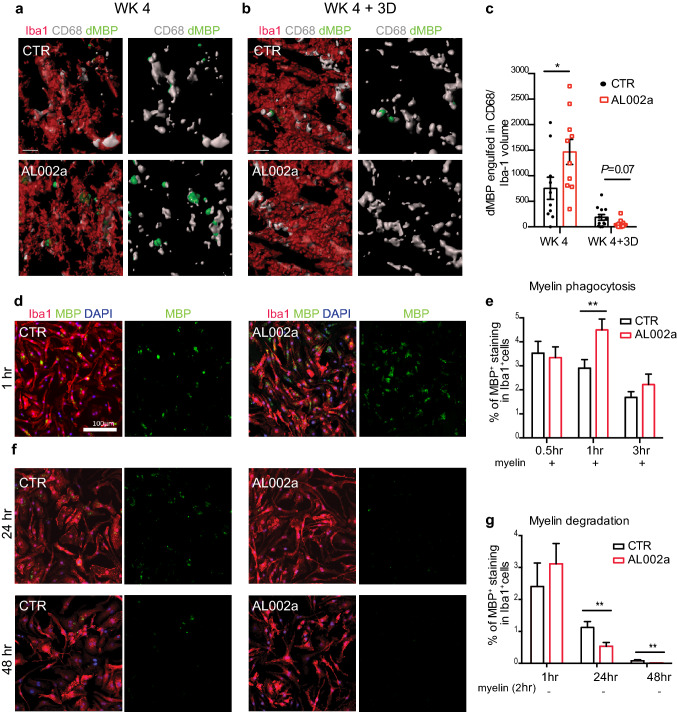
- In Trem2+/− mice after cuprizone, AL002a reduced dMBP at WK 4 + 3D, increased dMBP inside CD68+ phagolysosomes at WK 4, increased myelin uptake by BMDM at 1 h, and increased degradation at 24 and 48 h.
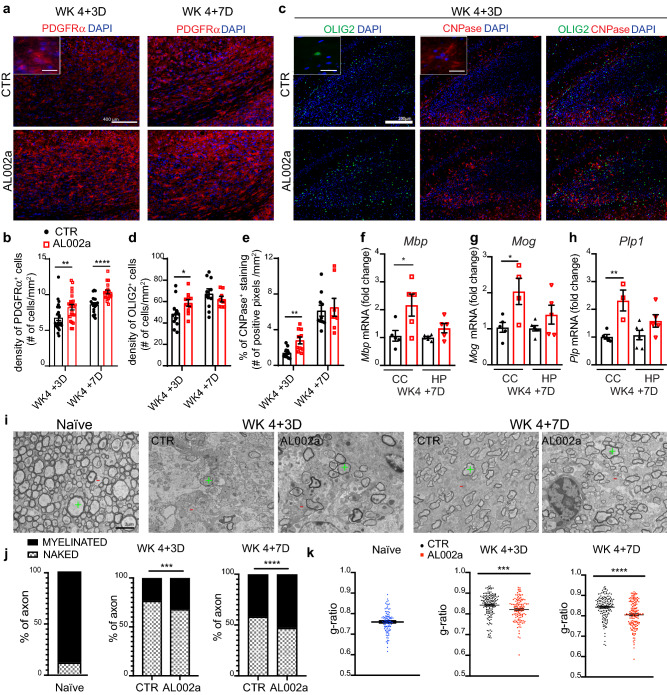
- AL002a increased PDGFRα+ OPC density at WK 4 + 3D and WK 4 + 7D, increased OLIG2+ and CNPase+ cells, increased Mbp/Mag/Plp1 mRNA, and increased myelinated axons by TEM: 32% ± 0.0192 vs 23% ± 0.0122 at WK 4 + 3D and 53% ± 0.0124 vs 42% ± 0.0179 at WK 4 + 7D. Plasma Nf-L was lower with AL002a at WK 4 + 3D, and SMI-31 was higher at WK 4 + 7D.
Methods
- Human CNS autopsy tissue from 8 MS patients and 4 non-neurological controls was analyzed by histology, confocal microscopy, and RT-qPCR; PBMC-derived macrophages from 3 Nasu–Hakola patients and 3 controls were analyzed by microarray.
- Trem2+/+, Trem2+/−, and Trem2−/− C57BL/6 mice were fed 0.2% cuprizone for 4 weeks, then recovered for 3, 7, or 14 days; mice received AL002a or control antibody intraperitoneally at 80 mg/kg weekly, starting 4 days before cuprizone.
- Analyses included BMDM phagocytosis/degradation assays, NFAT-luciferase TREM2 reporter assays, flow cytometry, immunohistochemistry, confocal 3D reconstruction, TEM/g-ratio, and Simoa Nf-L; statistics used ANOVA with post hoc tests, t tests, or Mann–Whitney tests, with P < 0.05 considered significant.
Limitations
- The paper states that TREM2 function in human microglia remains elusive because of experimental difficulties and limitations of human studies.
- The paper states that it is not fully clear whether enhanced remyelination after AL002a is due to accelerated myelin debris removal or an additional TREM2-mediated microglial signal recruiting OPCs; future studies are needed.
- The paper notes that AL002a was tested in Trem2+/− mice because no effect was detected in Trem2+/+ mice, and that future studies are needed to clarify whether TREM2 activation directly enhances microglia proliferation in vivo; the cuprizone model is toxin-induced demyelination rather than autoimmune MS, and the human NHD gene-expression analysis used only 3 patients and 3 controls.
Model-written summary. Check it against the paper before relying on it.
Integrity signals
Registry
Cites
Statistics
Figures
Verification
Claims the paper makes
72 Own result · 33 Own interpretation · 13 No full text of the sources · 9 Supported · 7 Partly supported · 3 Supported so far · 2 Couldn’t confirm · 2 No basis given · 1 Not checked yet · 1 Own method · accuracy not yet measured
The sources with a verdict support this claim; the rest weren’t checked yet, have no full text we could read, or their verdicts aren’t rated yet.
In the paper
“The general consensus is that TREM2 is expressed by microglia in the CNS, especially after activation [6, 21, 47].”
§ TREM2 activation on microglia promotes myelin debris clearance and remyelination in a model of multiple sclerosis > Results > TREM2 is highly expressed in active MS lesions
What the sources say
- Could not verifycites [6] Butovsky O, Jedrychowski MP, Moore CS, Cialic R, Lanser AJ, Gabriely G et al (2014) Identification of a unique TGF-beta-dependent molecular and functional signature in microglia. Nat Neurosci 17:131–143. https://doi.org/10.1038/nn.3599 sourceExperimental — accuracy not yet measured
The Results sections on microglial gene signatures and surface molecules discuss other markers, including P2ry12, but do not address TREM2. Searches for TREM2 expression and activation found no passage in our copy establishing that TREM2 is expressed by CNS microglia, especially after activation. (LLM, conf=0.74)
- Supportedcites [21] Keren-Shaul H, Spinrad A, Weiner A, Matcovitch-Natan O, Dvir-Szternfeld R, Ulland TK et al (2017) A unique microglia type associated with restricting development of Alzheimer’s disease. Cell 169(1276–1290):e1217. https://doi.org/10.1016/j.cell.2017.05.018 source
The Results section identifies Trem2 in disease-associated microglia and reports that it is strongly induced in that activated state. This supports the claim that microglia express TREM2, particularly after activation, in the CNS context studied. (LLM, conf=0.90)
- Not checked — no full text of the sourcecites [47] Ulland TK, Colonna M (2018) TREM2—a key player in microglial biology and Alzheimer disease. Nat Rev Neurol 14:667–675. https://doi.org/10.1038/s41582-018-0072-1 source
boostedcorrelational- Asserted: passes — The authors put it forward as true.
- Checkable: passes — It can be checked against evidence.
- Load-bearing: passes — The paper’s conclusions depend on it.
- Based: passes — The paper gives a reason why it holds.
- Could not verify
The cited sources support only part of this claim — read each source’s verdict below.
In the paper
“Efficient myelin debris removal and clearance by phagocytic cells are critical to eliminate inhibitory signals interfering with OPC activation, recruitment to the site of demyelination and/or differentiation into myelinating mature OLs [14, 26, 27].”
§ TREM2 activation on microglia promotes myelin debris clearance and remyelination in a model of multiple sclerosis > Introduction
What the sources say
- Partly supportedcites [14] Franklin RJM, Ffrench-Constant C (2017) Regenerating CNS myelin—from mechanisms to experimental medicines. Nat Rev Neurosci 18:753–769. https://doi.org/10.1038/nrn.2017.136 sourceExperimental — accuracy not yet measured
In “Systemic factors and remyelination” (page not available), the review says phagocytic macrophages clear myelin debris containing inhibitors of OPC differentiation, and that clearance prevents interference with the final stage of remyelination. It does not say that those debris-borne inhibitors interfere with OPC activation or recruitment; its discussion of macrophages during recruitment concerns a different role. (LLM, conf=0.88)
- Not checked — no full text of the sourcecites [26] Kotter MR, Li WW, Zhao C, Franklin RJ (2006) Myelin impairs CNS remyelination by inhibiting oligodendrocyte precursor cell differentiation. J Neurosci Off J Soc Neurosci 26:328–332. https://doi.org/10.1523/JNEUROSCI.2615-05.2006 source
- Supportedcites [27] Lampron A, Larochelle A, Laflamme N, Prefontaine P, Plante MM, Sanchez MG et al (2015) Inefficient clearance of myelin debris by microglia impairs remyelinating processes. J Exp Med 212:481–495. https://doi.org/10.1084/jem.20141656 source
The Discussion states that myelin debris inhibits OPC differentiation and that macrophages are essential for its removal. The Abstract calls myelin removal critical to remyelination, while the Results report impaired OPC recruitment when microglial debris clearance is impaired. These passages support the claim’s qualified description of the processes affected. (LLM, conf=0.87)
plaindirect- Asserted: passes — The authors put it forward as true.
- Checkable: passes — It can be checked against evidence.
- Load-bearing: passes — The paper’s conclusions depend on it.
- Based: passes — The paper gives a reason why it holds.
- Partly supported
The cited sources that could be checked couldn’t confirm or dispute this claim.
In the paper
“Efficient clearance of myelin debris after demyelination can favorably impact OPC recruitment and differentiation into remyelinating oligodendrocytes [29].”
§ TREM2 activation on microglia promotes myelin debris clearance and remyelination in a model of multiple sclerosis > Results > AL002a treatment leads to increased OPC density, OL maturation, and remyelination
What the sources say
- Could not verifycites [29] Lloyd AF, Miron VE (2019) The pro-remyelination properties of microglia in the central nervous system. Nat Rev Neurol 15:447–458. https://doi.org/10.1038/s41582-019-0184-2 sourceExperimental — accuracy not yet measured
The available passages contain bibliographic details and the review’s title, but no discussion of myelin-debris clearance or its effects on OPC recruitment and differentiation. Searches for those terms and for phagocytosis found no passage addressing the claim, so our copy cannot verify it. (LLM, conf=0.76)
plainconditional- Asserted: passes — The authors put it forward as true.
- Checkable: passes — It can be checked against evidence.
- Load-bearing: passes — The paper’s conclusions depend on it.
- Based: passes — The paper gives a reason why it holds.
- Could not verify
Every source the paper cites for this claim was checked and supports it.
In the paper
“We and others have previously shown that Trem2−/− mice present a significant defect in clearance of myelin debris in the CPZ-induced model of demyelination compared to Trem2+/+ mice [8, 42].”
§ TREM2 activation on microglia promotes myelin debris clearance and remyelination in a model of multiple sclerosis > Results > Trem2 haploinsufficiency results in defective myelin debris clearance in the CPZ model of CNS demyelination
What the sources say
- Supportedcites [8] Cantoni C, Bollman B, Licastro D, Xie M, Mikesell R, Schmidt R et al (2015) TREM2 regulates microglial cell activation in response to demyelination in vivo. Acta Neuropathol 129:429–447. https://doi.org/10.1007/s00401-015-1388-1 source
In the Results section on clearance in the CPZ model (page unavailable), degraded myelin staining was significantly greater in TREM2−/− than in wild-type mice at all measured time points. The paper describes this accumulation as consistent with defective clearance; its analysis of microglia points specifically to impaired myelin breakdown rather than impaired uptake. (LLM, conf=0.90)
- Supportedcites [42] Poliani PL, Wang Y, Fontana E, Robinette ML, Yamanishi Y, Gilfillan S et al (2015) TREM2 sustains microglial expansion during aging and response to demyelination. J Clin Investig 125:2161–2170. https://doi.org/10.1172/JCI77983 source
The Results report abundant myelin debris in Trem2−/− mice compared with WT mice after 12 weeks of cuprizone treatment and explicitly conclude that TREM2 deficiency impairs damaged-myelin clearance. The finding concerns prolonged treatment; the paper does not report the same defect at four weeks. (LLM, conf=0.92)
plaindirect- Asserted: passes — The authors put it forward as true.
- Checkable: passes — It can be checked against evidence.
- Load-bearing: passes — The paper’s conclusions depend on it.
- Based: passes — The paper gives a reason why it holds.
- Supported
The cited sources support only part of this claim — read each source’s verdict below.
In the paper
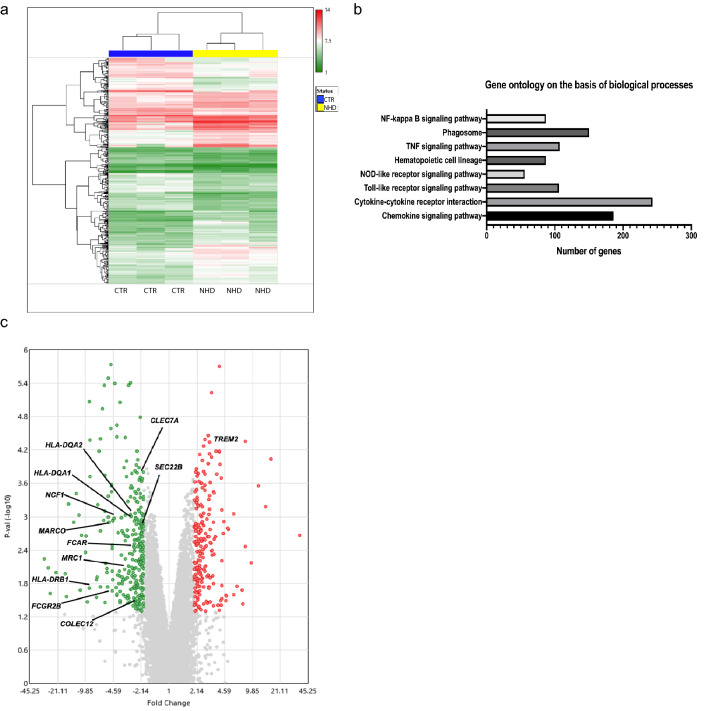
“Only 11 genes, including TREM2, remained significant after adjustment of the absolute fold change cutoff to a FDR < 0.05 [40] (Supplementary Table 1).”
§ TREM2 activation on microglia promotes myelin debris clearance and remyelination in a model of multiple sclerosis > Results > Macrophages derived from Nasu–Hakola subjects display a defect in phagocytic pathways
What the sources say
- Partly supportedcites [40] Pawitan Y, Michiels S, Koscielny S, Gusnanto A, Ploner A (2005) False discovery rate, sensitivity and sample size for microarray studies. Bioinformatics 21:3017–3024. https://doi.org/10.1093/bioinformatics/bti448 sourceExperimental — accuracy not yet measured
Section 2.1 describes using a fold-change statistic to set a cutoff for declaring genes differentially expressed, and Section 3.3 discusses extending FDR analysis to fold-change statistics. The paper does not report that 11 genes, including TREM2, remained significant, or document the claimed FDR < 0.05 result. Page numbers were not available in our copy. (LLM, conf=0.78)
plainn = 3- Asserted: passes — The authors put it forward as true.
- Checkable: passes — It can be checked against evidence.
- Load-bearing: unclear — It is unclear whether the paper’s conclusions depend on it.
- Based: passes — The paper gives a reason why it holds.
- Partly supported
The sources with a verdict support this claim; the rest weren’t checked yet, have no full text we could read, or their verdicts aren’t rated yet.
In the paper
“It was previously demonstrated that TREM2 recognizes myelin-associated lipids [42, 52], suggesting that TREM2 may directly sense lipid components exposed after myelin damage.”
§ TREM2 activation on microglia promotes myelin debris clearance and remyelination in a model of multiple sclerosis > Results > Effects of a newly generated TREM2-specific antibody on TREM2 signaling
What the sources say
- Supportedcites [42] Poliani PL, Wang Y, Fontana E, Robinette ML, Yamanishi Y, Gilfillan S et al (2015) TREM2 sustains microglial expansion during aging and response to demyelination. J Clin Investig 125:2161–2170. https://doi.org/10.1172/JCI77983 source
The Results section reports that myelin lipids triggered TREM2-dependent signaling in a reporter assay, and that several purified myelin glycolipids and phospholipids also stimulated signaling. The paper concludes that TREM2 may detect these lipids during myelin damage, supporting the cited paraphrase. (LLM, conf=0.93)
- Not checked — no full text of the sourcecites [52] Wei SH, Parker I, Miller MJ, Cahalan MD (2003) A stochastic view of lymphocyte motility and trafficking within the lymph node. Immunol Rev 195:136–159 source
boosteddirect- Asserted: passes — The authors put it forward as true.
- Checkable: passes — It can be checked against evidence.
- Load-bearing: passes — The paper’s conclusions depend on it.
- Based: passes — The paper gives a reason why it holds.
- Supported
Every source the paper cites for this claim was checked and supports it.
In the paper
“Microglia play a key role in myelin debris removal after CNS demyelination [33].”
§ TREM2 activation on microglia promotes myelin debris clearance and remyelination in a model of multiple sclerosis > Results > AL002a antibody promotes myelin uptake and degradation in vivo and in vitro
What the sources say
- Supportedcites [33] Neumann H, Kotter MR, Franklin RJ (2009) Debris clearance by microglia: an essential link between degeneration and regeneration. Brain 132:288–295. https://doi.org/10.1093/brain/awn109 source
The ‘Microglial phagocytosis in acute CNS injury’ section (page not available in our copy) says myelin debris generated during demyelination must be removed and that microglia are the first CNS cells engaged in phagocytosis. It also notes that blood-borne macrophages assist, which does not undermine the claim that microglia play a key role. (LLM, conf=0.91)
plaindirect- Asserted: passes — The authors put it forward as true.
- Checkable: passes — It can be checked against evidence.
- Load-bearing: passes — The paper’s conclusions depend on it.
- Based: passes — The paper gives a reason why it holds.
- Supported
Every source the paper cites for this claim was checked and supports it.
In the paper
“TREM2 has been described to be intimately linked to microglia lipid metabolism [8, 42].”
§ TREM2 activation on microglia promotes myelin debris clearance and remyelination in a model of multiple sclerosis > Discussion
What the sources say
- Supportedcites [8] Cantoni C, Bollman B, Licastro D, Xie M, Mikesell R, Schmidt R et al (2015) TREM2 regulates microglial cell activation in response to demyelination in vivo. Acta Neuropathol 129:429–447. https://doi.org/10.1007/s00401-015-1388-1 source
The Results section identifies lipid metabolism as the top altered gene-expression network in TREM2-deficient mice after demyelination. The Discussion states that loss of TREM2 is associated with a defect in microglial lipid metabolism. Our copy does not provide page numbers for these passages. (LLM, conf=0.91)
- Supportedcites [42] Poliani PL, Wang Y, Fontana E, Robinette ML, Yamanishi Y, Gilfillan S et al (2015) TREM2 sustains microglial expansion during aging and response to demyelination. J Clin Investig 125:2161–2170. https://doi.org/10.1172/JCI77983 source
The Introduction reports that TREM2-deficient microglia failed to activate programs for lipid capture, transport, and metabolism after demyelination. The Results also show that myelin lipids trigger TREM2 signaling, supporting the broad link claimed. (LLM, conf=0.93)
plaincorrelational- Asserted: passes — The authors put it forward as true.
- Checkable: passes — It can be checked against evidence.
- Load-bearing: passes — The paper’s conclusions depend on it.
- Based: passes — The paper gives a reason why it holds.
- Supported
Every source the paper cites for this claim was checked and supports it.
In the paper
“Chronic demyelination in vivo (12 weeks on CPZ) caused a robust accumulation of cholesteryl ester (CE) and oxidized CE in the Trem2−/– brain, suggesting that TREM2 might be a crucial transcriptional regulator of cholesterol transport and lipid metabolism in microglia [35].”
§ TREM2 activation on microglia promotes myelin debris clearance and remyelination in a model of multiple sclerosis > Discussion
What the sources say
- Supportedcites [35] Nugent AA, Lin K, van Lengerich B, Lianoglou S, Przybyla L, Davis SS et al (2019) TREM2 regulates microglial cholesterol metabolism upon chronic phagocytic challenge. Neuron. https://doi.org/10.1016/j.neuron.2019.12.007 source
The Summary identifies TREM2 as a key transcriptional regulator of cholesterol transport and metabolism under chronic myelin phagocytic activity. The Introduction and Results also report CE and oxidized CE accumulation in Trem2−/− brains after 12 weeks of CPZ treatment, matching the citing sentence’s context. (LLM, conf=0.95)
hedgedconditional- Asserted: passes — The authors put it forward as true.
- Checkable: passes — It can be checked against evidence.
- Load-bearing: unclear — It is unclear whether the paper’s conclusions depend on it.
- Based: passes — The paper gives a reason why it holds.
- Supported
A result the paper reports from its own data — it cites no other source for it, so there is none to check. The quote shows it is in the paper.
In the paper
“Most importantly, antibody-dependent TREM2 activation on microglia increased density of oligodendrocyte precursors in areas of demyelination, as well as the formation of mature oligodendrocytes thus enhancing remyelination and axonal integrity.”
- Also stated in: § Introduction · plain
“Most importantly, these events resulted in increased OPC recruitment and differentiation into mature OLs eventually accelerating remyelination in vivo and preserving axonal health.”
§ TREM2 activation on microglia promotes myelin debris clearance and remyelination in a model of multiple sclerosis > Abstract
plaindirect- Asserted: passes — The authors put it forward as true.
- Checkable: passes — It can be checked against evidence.
- Load-bearing: passes — The paper’s conclusions depend on it.
- Based: passes — The paper gives a reason why it holds.
- Also stated in: § Introduction · plain
- Probably not a substantial claim. 13
- It may state two separate claims as one. 41
The cited sources support only part of this claim — read each source’s verdict below.
In the paper
“TREM2 is a phospholipid sensing receptor known to sustain microglial cell activation and expansion in response to demyelination or amyloid plaques in Alzheimer’s disease (AD) [8, 42, 50].”
§ TREM2 activation on microglia promotes myelin debris clearance and remyelination in a model of multiple sclerosis > Introduction
What the sources say
- Partly supportedcites [8] Cantoni C, Bollman B, Licastro D, Xie M, Mikesell R, Schmidt R et al (2015) TREM2 regulates microglial cell activation in response to demyelination in vivo. Acta Neuropathol 129:429–447. https://doi.org/10.1007/s00401-015-1388-1 sourceExperimental — accuracy not yet measured
The Abstract and the Results section on microglial proliferation report that TREM2 supports microglial activation and proliferation during cuprizone-induced demyelination. The Discussion also reports fewer plaque-associated microglia in an AD mouse model with one copy of TREM2, but does not establish that TREM2 sustains both activation and expansion at amyloid plaques. The Introduction says TREM2 ligands are poorly characterized; it does not identify TREM2 as a phospholipid-sensing receptor. Page numbers were not available in our copy. (LLM, conf=0.88)
- Partly supportedcites [42] Poliani PL, Wang Y, Fontana E, Robinette ML, Yamanishi Y, Gilfillan S et al (2015) TREM2 sustains microglial expansion during aging and response to demyelination. J Clin Investig 125:2161–2170. https://doi.org/10.1172/JCI77983 sourceExperimental — accuracy not yet measured
The Introduction and Results report that TREM2 detects phospholipids and supports microglial activation in response to demyelination; the Abstract reports microglial expansion during aging. The Discussion only proposes that TREM2 may support a microglial response to β-amyloid plaques in Alzheimer’s disease, rather than establishing activation or expansion in response to those plaques. (LLM, conf=0.88)
- Partly supportedcites [50] Wang Y, Cella M, Mallinson K, Ulrich JD, Young KL, Robinette ML et al (2015) TREM2 lipid sensing sustains the microglial response in an Alzheimer’s disease model. Cell 160:1061–1071. https://doi.org/10.1016/j.cell.2015.01.049 sourceExperimental — accuracy not yet measured
The Discussion states that TREM2 supports microglial expansion and activation around Aβ plaques in the 5XFAD Alzheimer’s disease model, and the Results identify it as a sensor for several lipids. The Discussion only suggests that TREM2 may trigger a microglial response to damaged myelin; it does not establish that TREM2 sustains microglial activation and expansion during demyelination. (LLM, conf=0.86)
boosteddirect- Asserted: passes — The authors put it forward as true.
- Checkable: passes — It can be checked against evidence.
- Load-bearing: passes — The paper’s conclusions depend on it.
- Based: passes — The paper gives a reason why it holds.
Probably not a substantial claim.
- Partly supported
The cited sources support only part of this claim — read each source’s verdict below.
In the paper
“Current MS immunomodulatory treatments target CNS inflammation, while therapies capable of regenerating myelin and halting disease progression are lacking [28].”
§ TREM2 activation on microglia promotes myelin debris clearance and remyelination in a model of multiple sclerosis > Introduction
What the sources say
- Partly supportedcites [28] Lassmann H, Bruck W, Lucchinetti CF (2007) The immunopathology of multiple sclerosis: an overview. Brain Pathol 17:210–218. https://doi.org/10.1111/j.1750-3639.2007.00064.x sourceExperimental — accuracy not yet measured
The Introduction says current anti-inflammatory and immunomodulatory treatments are partly effective early in MS but offer limited benefit in the progressive phase. Its remyelination discussion calls therapies that promote myelin repair an attractive option, but does not explicitly establish that such therapies are lacking; nor does it say that no therapy can halt disease progression. (LLM, conf=0.84)
plain- Asserted: passes — The authors put it forward as true.
- Checkable: passes — It can be checked against evidence.
- Load-bearing: passes — The paper’s conclusions depend on it.
- Based: passes — The paper gives a reason why it holds.
It may state two separate claims as one.
- Partly supported
Every source the paper cites for this claim was checked and supports it.
In the paper
“Here, we explored the effect of antibody-mediated TREM2 activation on microglia in a well-established toxin-induced model of demyelination in the CNS resulting from exposure to the copper chelator cuprizone (CPZ) in the diet [31].”
§ TREM2 activation on microglia promotes myelin debris clearance and remyelination in a model of multiple sclerosis > Introduction
What the sources say
- Supportedcites [31] Matsushima GK, Morell P (2001) The neurotoxicant, cuprizone, as a model to study demyelination and remyelination in the central nervous system. Brain Pathol 11:107–116 source
The paper describes dietary exposure to cuprizone, a copper chelator, as an experimental model that reproducibly induces extensive demyelination in mouse brain. It also reviews work on the model from several laboratories over three decades, supporting the description 'well-established.' The indexed passage has no section or page label. (LLM, conf=0.94)
boosted- Asserted: passes — The authors put it forward as true.
- Checkable: passes — It can be checked against evidence.
- Load-bearing: passes — The paper’s conclusions depend on it.
- Based: passes — The paper gives a reason why it holds.
Probably not a substantial claim.
- Supported
Every source the paper cites for this claim was checked and supports it.
In the paper
“These events lead to OPC recruitment, differentiation into mature OLs, and then remyelination which is almost complete within few weeks from toxin withdrawal [31].”
§ TREM2 activation on microglia promotes myelin debris clearance and remyelination in a model of multiple sclerosis > Introduction
What the sources say
- Supportedcites [31] Matsushima GK, Morell P (2001) The neurotoxicant, cuprizone, as a model to study demyelination and remyelination in the central nervous system. Brain Pathol 11:107–116 source
The paper’s opening summary describes oligodendrocyte progenitor cells proliferating and invading demyelinated areas in cuprizone-treated mice, followed by almost complete remyelination within weeks of stopping cuprizone. Its reference list also identifies progenitor differentiation as part of demyelination and remyelination, supporting the sequence in the claim. (LLM, conf=0.88)
plaindirect- Asserted: passes — The authors put it forward as true.
- Checkable: passes — It can be checked against evidence.
- Load-bearing: passes — The paper’s conclusions depend on it.
- Based: passes — The paper gives a reason why it holds.
It may state two separate claims as one.
- Supported
The cited sources that could be checked couldn’t confirm or dispute this claim.
In the paper
“Microglia activation and myelin debris clearance are critical steps for successful remyelination [29].”
§ TREM2 activation on microglia promotes myelin debris clearance and remyelination in a model of multiple sclerosis > Results > AL002a treatment leads to increased OPC density, OL maturation, and remyelination
What the sources say
- Could not verifycites [29] Lloyd AF, Miron VE (2019) The pro-remyelination properties of microglia in the central nervous system. Nat Rev Neurol 15:447–458. https://doi.org/10.1038/s41582-019-0184-2 sourceExperimental — accuracy not yet measured
The available copy identifies the review as concerning the pro-remyelination properties of microglia, but the retrieved passages are bibliographic information rather than discussion of the proposed steps. Searches for microglial activation and myelin debris clearance found no passage establishing that either is critical for successful remyelination. (LLM, conf=0.72)
plaindirect- Asserted: passes — The authors put it forward as true.
- Checkable: passes — It can be checked against evidence.
- Load-bearing: passes — The paper’s conclusions depend on it.
- Based: passes — The paper gives a reason why it holds.
It may state two separate claims as one.
- Could not verify
The cited sources support only part of this claim — read each source’s verdict below.
In the paper
“TREM2 clustering promotes calcium flux stimulating NFAT-activity that induces luciferase expression [50].”
§ TREM2 activation on microglia promotes myelin debris clearance and remyelination in a model of multiple sclerosis > Results > Effects of a newly generated TREM2-specific antibody on TREM2 signaling
What the sources say
- Partly supportedcites [50] Wang Y, Cella M, Mallinson K, Ulrich JD, Young KL, Robinette ML et al (2015) TREM2 lipid sensing sustains the microglial response in an Alzheimer’s disease model. Cell 160:1061–1071. https://doi.org/10.1016/j.cell.2015.01.049 sourceExperimental — accuracy not yet measured
The Results section (‘TREM2 is a sensor for anionic and zwitterionic lipids’) says that TREM2 engagement leads to calcium mobilization and NFAT-controlled reporter expression. But it identifies the reporter as GFP, not luciferase, and describes lipid engagement rather than TREM2 clustering. The Experimental Procedures (‘Reporter assay’) also measure GFP-positive cells. (LLM, conf=0.88)
plaindirect- Asserted: passes — The authors put it forward as true.
- Checkable: passes — It can be checked against evidence.
- Load-bearing: fails — The paper’s conclusions may not depend on it.
- Based: passes — The paper gives a reason why it holds.
Probably not a substantial claim. The paper’s conclusions may not depend on it. It may state two separate claims as one.
- Partly supported
Every source the paper cites for this claim was checked and supports it.
In the paper
“We previously showed that Trem2−/− mice have a striking defect in microglia activation and myelin debris clearance in the CPZ model [8].”
§ TREM2 activation on microglia promotes myelin debris clearance and remyelination in a model of multiple sclerosis > Discussion
What the sources say
- Supportedcites [8] Cantoni C, Bollman B, Licastro D, Xie M, Mikesell R, Schmidt R et al (2015) TREM2 regulates microglial cell activation in response to demyelination in vivo. Acta Neuropathol 129:429–447. https://doi.org/10.1007/s00401-015-1388-1 source
The Discussion explicitly reports defective microglial activation and clearance of myelin debris in TREM2-deficient mice in the CPZ model. The Results section on myelin-debris clearance also reports greater accumulation of degraded myelin in TREM2−/− mice than in wild-type mice. No page numbers are supplied in the passages. (LLM, conf=0.94)
boosteddirect- Asserted: passes — The authors put it forward as true.
- Checkable: passes — It can be checked against evidence.
- Load-bearing: passes — The paper’s conclusions depend on it.
- Based: passes — The paper gives a reason why it holds.
It may state two separate claims as one.
- Supported
Every source the paper cites for this claim was checked and supports it.
In the paper
“A role of TREM2 in phagocytic pathways in the human brain was previously suggested [13].”
§ TREM2 activation on microglia promotes myelin debris clearance and remyelination in a model of multiple sclerosis > Results > Macrophages derived from Nasu–Hakola subjects display a defect in phagocytic pathways
What the sources say
- Supportedcites [13] Forabosco P, Ramasamy A, Trabzuni D, Walker R, Smith C, Bras J et al (2013) Insights into TREM2 biology by network analysis of human brain gene expression data. Neurobiol Aging 34:2699–2714. https://doi.org/10.1016/j.neurobiolaging.2013.05.001 source
The Results section, “Insights into TREM2-related signaling pathways,” identifies enrichment of an Fc gamma R-mediated phagocytosis pathway among TREM2-related genes in human brain. It proposes that TREM2 on microglia might initiate phagocytosis, matching the citing sentence’s qualified wording, “was previously suggested.” (LLM, conf=0.94)
hedgedcorrelational- Asserted: passes — The authors put it forward as true.
- Checkable: passes — It can be checked against evidence.
- Load-bearing: fails — The paper’s conclusions may not depend on it.
- Based: passes — The paper gives a reason why it holds.
Probably not a substantial claim. The paper’s conclusions may not depend on it.
- Supported
The sources with a verdict support this claim; the rest weren’t checked yet, have no full text we could read, or their verdicts aren’t rated yet.
In the paper
“TREM2 has often been referred to as a phagocytic receptor as it was demonstrated to be involved in microglia phagocytosis of apoptotic neurons [46], myelin [8] and β-amyloid [24].”
§ TREM2 activation on microglia promotes myelin debris clearance and remyelination in a model of multiple sclerosis > Discussion
What the sources say
- Supportedcites [46] Takahashi K, Rochford CD, Neumann H (2005) Clearance of apoptotic neurons without inflammation by microglial triggering receptor expressed on myeloid cells-2. J Exp Med 201:647–657 source
The citation to this paper is attached specifically to apoptotic neurons; myelin and β-amyloid have separate citations. In the Results section, TREM2 knockdown reduced microglial phagocytosis of apoptotic neuronal material, while overexpression increased it. Page numbers are not provided in our copy. (LLM, conf=0.94)
- Supportedcites [8] Cantoni C, Bollman B, Licastro D, Xie M, Mikesell R, Schmidt R et al (2015) TREM2 regulates microglial cell activation in response to demyelination in vivo. Acta Neuropathol 129:429–447. https://doi.org/10.1007/s00401-015-1388-1 source
The citation to Cantoni et al. [8] is attached to myelin, not to apoptotic neurons or β-amyloid. The paper reports defective myelin-debris clearance and impaired myelin degradation in TREM2-deficient microglia during cuprizone-induced demyelination (Abstract; page not provided). (LLM, conf=0.94)
- Not checked — no full text of the sourcecites [24] Kleinberger G, Yamanishi Y, Suarez-Calvet M, Czirr E, Lohmann E, Cuyvers E et al (2014) TREM2 mutations implicated in neurodegeneration impair cell surface transport and phagocytosis. Sci Transl Med 6:243ra286. https://doi.org/10.1126/scitranslmed.3009093 source
boostedcorrelational- Asserted: passes — The authors put it forward as true.
- Checkable: passes — It can be checked against evidence.
- Load-bearing: fails — The paper’s conclusions may not depend on it.
- Based: passes — The paper gives a reason why it holds.
Probably not a substantial claim. The paper’s conclusions may not depend on it. It may state two separate claims as one.
- Supported
The cited sources support only part of this claim — read each source’s verdict below.
In the paper
“However, our current and previous findings indicate a more complex TREM2 function not only in myelin uptake, but also in promoting myelin debris degradation through the phagolysosomal pathway [8].”
§ TREM2 activation on microglia promotes myelin debris clearance and remyelination in a model of multiple sclerosis > Discussion
What the sources say
- Partly supportedcites [8] Cantoni C, Bollman B, Licastro D, Xie M, Mikesell R, Schmidt R et al (2015) TREM2 regulates microglial cell activation in response to demyelination in vivo. Acta Neuropathol 129:429–447. https://doi.org/10.1007/s00401-015-1388-1 sourceExperimental — accuracy not yet measured
The Results section ('Defective myelin degradation by microglia in TREM2−/− mice'; page unavailable) finds impaired myelin breakdown and persistent myelin-filled phagosomes in TREM2-deficient mice, supporting a role for TREM2 in degradation. But it reports no difference in myelin uptake and says the findings do not support an uptake defect. It implicates phagosome processing without establishing the specific phagolysosomal pathway claimed. (LLM, conf=0.88)
hedgeddirect- Asserted: passes — The authors put it forward as true.
- Checkable: passes — It can be checked against evidence.
- Load-bearing: passes — The paper’s conclusions depend on it.
- Based: passes — The paper gives a reason why it holds.
It may state two separate claims as one.
- Partly supported
The cited sources support only part of this claim — read each source’s verdict below.
In the paper
“Here we show that TREM2 was highly expressed within active MS lesions by lipid-laden microglia/macrophages known to display an alternatively activated M2 profile and to promote the resolution of inflammation and clearance of myelin debris [5].”
§ TREM2 activation on microglia promotes myelin debris clearance and remyelination in a model of multiple sclerosis > Discussion
What the sources say
- Partly supportedcites [5] Boven LA, Van Meurs M, Van Zwam M, Wierenga-Wolf A, Hintzen RQ, Boot RG et al (2006) Myelin-laden macrophages are anti-inflammatory, consistent with foam cells in multiple sclerosis. Brain 129:517–526 sourceExperimental — accuracy not yet measured
The Introduction describes foamy macrophages in MS lesions as myelin-scavenging cells derived from microglia or monocytes, and the results say they resemble anti-inflammatory M2 macrophages. The Discussion says they are *likely* to contribute to resolution of inflammation; it does not establish that they promote resolution as a demonstrated function. The TREM2-expression finding is introduced as the citing authors’ own result, not one attributed to this source. (LLM, conf=0.87)
boosteddirect- Asserted: passes — The authors put it forward as true.
- Checkable: passes — It can be checked against evidence.
- Load-bearing: passes — The paper’s conclusions depend on it.
- Based: passes — The paper gives a reason why it holds.
It may state two separate claims as one.
- Partly supported
Every source the paper cites for this claim was checked and supports it.
In the paper
“In our previous work, we provided initial evidence to support this hypothesis by showing that TREM2 is not a limiting factor in myelin engulfment, but it was clearly essential for microglia capacity to degrade myelin during chronic demyelination [8].”
§ TREM2 activation on microglia promotes myelin debris clearance and remyelination in a model of multiple sclerosis > Discussion
What the sources say
- Supportedcites [8] Cantoni C, Bollman B, Licastro D, Xie M, Mikesell R, Schmidt R et al (2015) TREM2 regulates microglial cell activation in response to demyelination in vivo. Acta Neuropathol 129:429–447. https://doi.org/10.1007/s00401-015-1388-1 source
In Results (‘Defective myelin degradation by microglia in TREM2−/− mice’), the authors report no difference in measured myelin uptake and say their in vivo findings do not support an uptake defect. The same section reports persistent myelin-containing phagosomes after 12 weeks of cuprizone treatment and suggests a defect in myelin breakdown; the Discussion likewise identifies impaired capacity to degrade myelin. (LLM, conf=0.93)
boosteddirect- Asserted: passes — The authors put it forward as true.
- Checkable: passes — It can be checked against evidence.
- Load-bearing: passes — The paper’s conclusions depend on it.
- Based: passes — The paper gives a reason why it holds.
It may state two separate claims as one.
- Supported
A result the paper reports from its own data — it cites no other source for it, so there is none to check. The quote shows it is in the paper.
In the paper
“The antibody’s specificity was verified by binding to wild-type (Trem2+/+), but not Trem2−/− thioglycollate-induced macrophages (THG-Mac) (Supplementary Fig. 1a).”
§ TREM2 activation on microglia promotes myelin debris clearance and remyelination in a model of multiple sclerosis > Results > Effects of a newly generated TREM2-specific antibody on TREM2 signaling
plain- Asserted: passes — The authors put it forward as true.
- Checkable: passes — It can be checked against evidence.
- Load-bearing: passes — The paper’s conclusions depend on it.
- Based: passes — The paper gives a reason why it holds.
It may state two separate claims as one.
A result the paper reports from its own data — it cites no other source for it, so there is none to check. The quote shows it is in the paper.
In the paper
“By confocal analysis we showed TREM2 specific expression in ionized calcium-binding adapter molecule 1(Iba1)+ cells in active MS lesion, which were identified as oil-red O+ lipid laden macrophages-microglia by histology (Fig. 1a, b).”
§ TREM2 activation on microglia promotes myelin debris clearance and remyelination in a model of multiple sclerosis > Results > TREM2 is highly expressed in active MS lesions
boostedcorrelational- Asserted: passes — The authors put it forward as true.
- Checkable: passes — It can be checked against evidence.
- Load-bearing: passes — The paper’s conclusions depend on it.
- Based: passes — The paper gives a reason why it holds.
It may state two separate claims as one.
A result the paper reports from its own data — it cites no other source for it, so there is none to check. The quote shows it is in the paper.
In the paper
“Principal component analysis showed the ability of gene expression data to discriminate NHD from control subjects (Supplementary Fig. 4e).”
§ TREM2 activation on microglia promotes myelin debris clearance and remyelination in a model of multiple sclerosis > Results > Macrophages derived from Nasu–Hakola subjects display a defect in phagocytic pathways
plaincorrelationaln = 3- Asserted: passes — The authors put it forward as true.
- Checkable: passes — It can be checked against evidence.
- Load-bearing: fails — The paper’s conclusions may not depend on it.
- Based: passes — The paper gives a reason why it holds.
Probably not a substantial claim. The paper’s conclusions may not depend on it.
A result the paper reports from its own data — it cites no other source for it, so there is none to check. The quote shows it is in the paper.
In the paper
“Significantly more MA were counted in the CC after AL002a treatment compared to control at WK 4 + 3D (MA: 32% ± 0.0192 in AL002a-treated group vs. MA: 23% ± 0.0122 in control group) and this was even more pronounced at WK 4 + 7D (MA: 53% ± 0.0124 in AL002a-treated group vs. MA:42% ± 0.0179 in control group) (Fig. 7j).”
§ TREM2 activation on microglia promotes myelin debris clearance and remyelination in a model of multiple sclerosis > Results > AL002a treatment leads to increased OPC density, OL maturation, and remyelination
plaindirect- Asserted: passes — The authors put it forward as true.
- Checkable: passes — It can be checked against evidence.
- Load-bearing: passes — The paper’s conclusions depend on it.
- Based: passes — The paper gives a reason why it holds.
It may state two separate claims as one.
A result the paper reports from its own data — it cites no other source for it, so there is none to check. The quote shows it is in the paper.
In the paper
“A GO cellular component analysis confirmed that genes from the phagocytic pathway are both significantly co-expressed with TREM2 and altered in NHD patients (Supplementary Table 5).”
§ TREM2 activation on microglia promotes myelin debris clearance and remyelination in a model of multiple sclerosis > Results > Macrophages derived from Nasu–Hakola subjects display a defect in phagocytic pathways
plaincorrelational- Asserted: passes — The authors put it forward as true.
- Checkable: passes — It can be checked against evidence.
- Load-bearing: passes — The paper’s conclusions depend on it.
- Based: passes — The paper gives a reason why it holds.
It may state two separate claims as one.
A result the paper reports from its own data — it cites no other source for it, so there is none to check. The quote shows it is in the paper.
In the paper
“This was accompanied by increased microglia activation and by a higher expression of proteins involved in phagocytic and degradative pathways.”
§ TREM2 activation on microglia promotes myelin debris clearance and remyelination in a model of multiple sclerosis > Discussion
plaincorrelational- Asserted: passes — The authors put it forward as true.
- Checkable: passes — It can be checked against evidence.
- Load-bearing: passes — The paper’s conclusions depend on it.
- Based: passes — The paper gives a reason why it holds.
It may state two separate claims as one.
A result the paper reports from its own data — it cites no other source for it, so there is none to check. The quote shows it is in the paper.
In the paper
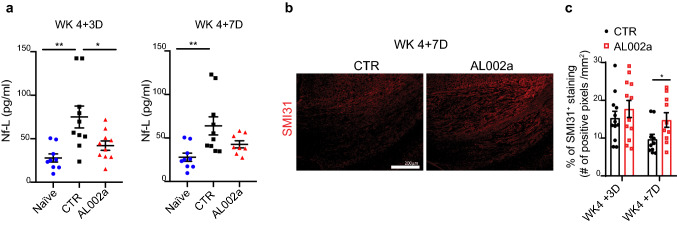
“Mice treated with AL002a showed significantly lower Nf-L levels in the plasma at WK 4 + 3D compared to the control, with a trend of reduced levels also observed at WK 4 + 7D (Fig. 8a).”
§ TREM2 activation on microglia promotes myelin debris clearance and remyelination in a model of multiple sclerosis > Results > AL002a treatment preserves axonal integrity
plaindirect- Asserted: passes — The authors put it forward as true.
- Checkable: passes — It can be checked against evidence.
- Load-bearing: passes — The paper’s conclusions depend on it.
- Based: passes — The paper gives a reason why it holds.
It may state two separate claims as one.
A result the paper reports from its own data — it cites no other source for it, so there is none to check. The quote shows it is in the paper.
In the paper
“Analysis of MBP internalization by immunofluorescence revealed a significant increase in MBP amount detected inside Iba1+ cells treated with AL002a after 1 h (Fig. 5d, e), while no differences between the two groups were detected at 30’ and 3 h.”
§ TREM2 activation on microglia promotes myelin debris clearance and remyelination in a model of multiple sclerosis > Results > AL002a antibody promotes myelin uptake and degradation in vivo and in vitro
plaindirect- Asserted: passes — The authors put it forward as true.
- Checkable: passes — It can be checked against evidence.
- Load-bearing: passes — The paper’s conclusions depend on it.
- Based: passes — The paper gives a reason why it holds.
It may state two separate claims as one.
A result the paper reports from its own data — it cites no other source for it, so there is none to check. The quote shows it is in the paper.
In the paper
“We then demonstrated that treatment with AL002a in vivo promotes efficient clearance of myelin debris, with increased myelin phagocytosis and intracellular degradation after CPZ-induce demyelination.”
§ TREM2 activation on microglia promotes myelin debris clearance and remyelination in a model of multiple sclerosis > Discussion
boosteddirect- Asserted: passes — The authors put it forward as true.
- Checkable: passes — It can be checked against evidence.
- Load-bearing: passes — The paper’s conclusions depend on it.
- Based: passes — The paper gives a reason why it holds.
It may state two separate claims as one.
A result the paper reports from its own data — it cites no other source for it, so there is none to check. The quote shows it is in the paper.
In the paper
“AL002a treatment increased OPC density and differentiation into mature OL”
§ TREM2 activation on microglia promotes myelin debris clearance and remyelination in a model of multiple sclerosis > Discussion
plaindirect- Asserted: passes — The authors put it forward as true.
- Checkable: passes — It can be checked against evidence.
- Load-bearing: passes — The paper’s conclusions depend on it.
- Based: passes — The paper gives a reason why it holds.
It may state two separate claims as one.
A result the paper reports from its own data — it cites no other source for it, so there is none to check. The quote shows it is in the paper.
In the paper
“AL002a was able to reach the brain and it was detected in the CC and in the cortex (Ctx) (Supplementary Fig. 1d).”
§ TREM2 activation on microglia promotes myelin debris clearance and remyelination in a model of multiple sclerosis > Results > Treatment of Trem2+/− mice with AL002a antibody accelerates myelin debris clearance
plain- Asserted: passes — The authors put it forward as true.
- Checkable: passes — It can be checked against evidence.
- Load-bearing: passes — The paper’s conclusions depend on it.
- Based: passes — The paper gives a reason why it holds.
It may state two separate claims as one.
A result the paper reports from its own data — it cites no other source for it, so there is none to check. The quote shows it is in the paper.
In the paper
“Gene ontology (GO) analysis revealed that genes involved in the phagosome pathway are among the top-pathways significantly altered in NHD subjects compared to controls along with changes in immune response pathways (Fig. 9b, and Supplementary Table 2 and 3).”
§ TREM2 activation on microglia promotes myelin debris clearance and remyelination in a model of multiple sclerosis > Results > Macrophages derived from Nasu–Hakola subjects display a defect in phagocytic pathways
plaincorrelational- Asserted: passes — The authors put it forward as true.
- Checkable: passes — It can be checked against evidence.
- Load-bearing: passes — The paper’s conclusions depend on it.
- Based: passes — The paper gives a reason why it holds.
It may state two separate claims as one.
A result the paper reports from its own data — it cites no other source for it, so there is none to check. The quote shows it is in the paper.
In the paper
“Our data demonstrate that AL002a is a potent TREM2 agonist antibody capable of activating TREM2 in vitro and in vivo and to potentiate myelin-induced activation of TREM2 signaling.”
§ TREM2 activation on microglia promotes myelin debris clearance and remyelination in a model of multiple sclerosis > Discussion
boosteddirect- Asserted: passes — The authors put it forward as true.
- Checkable: passes — It can be checked against evidence.
- Load-bearing: passes — The paper’s conclusions depend on it.
- Based: passes — The paper gives a reason why it holds.
It may state two separate claims as one.
A result the paper reports from its own data — it cites no other source for it, so there is none to check. The quote shows it is in the paper.
In the paper
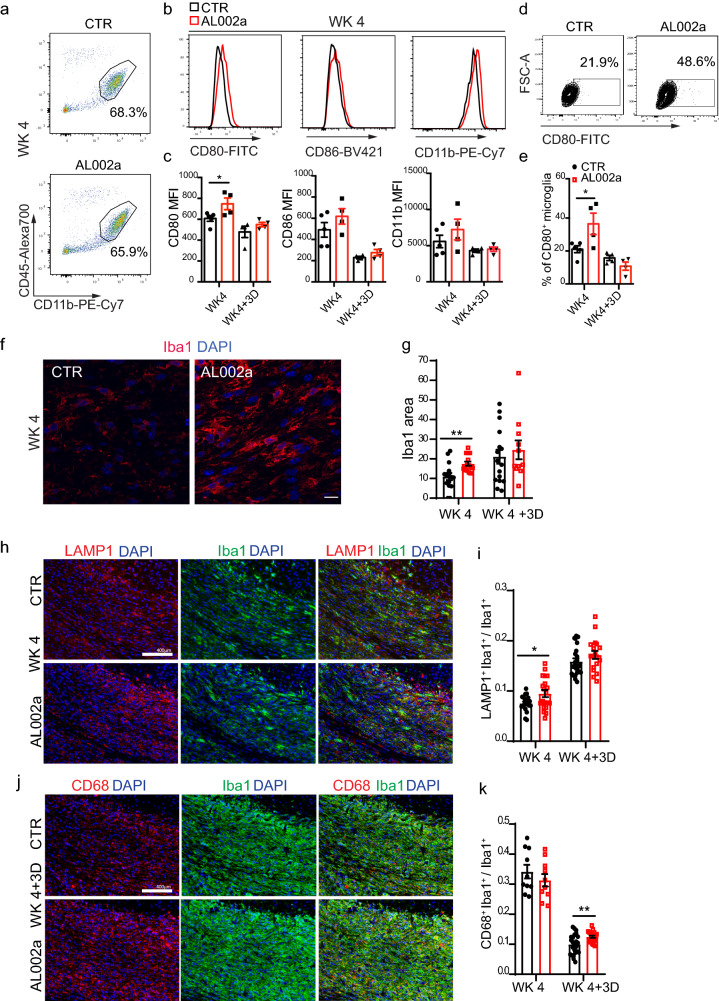
“This was accompanied by increased microglia expression of markers of activation (Iba1 and CD80) and phagolysosomal activity (CD68 and LAMP1).”
§ TREM2 activation on microglia promotes myelin debris clearance and remyelination in a model of multiple sclerosis > Discussion
plaincorrelational- Asserted: passes — The authors put it forward as true.
- Checkable: passes — It can be checked against evidence.
- Load-bearing: passes — The paper’s conclusions depend on it.
- Based: passes — The paper gives a reason why it holds.
It may state two separate claims as one.
A result the paper reports from its own data — it cites no other source for it, so there is none to check. The quote shows it is in the paper.
In the paper
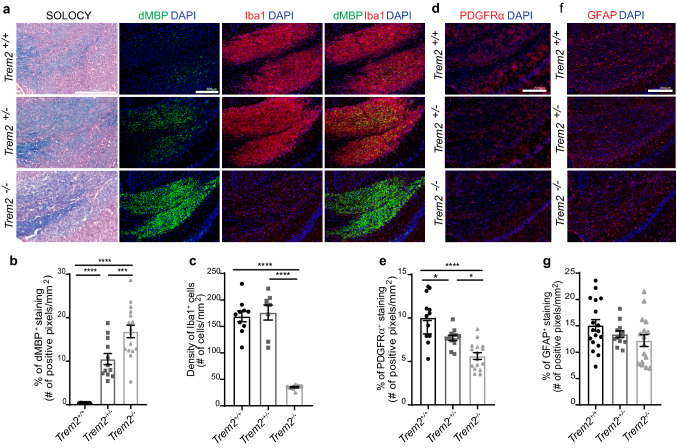
“Interestingly, in the current study at this time point no differences in the number of microglia were detected between Trem2+/− and Trem2+/+ mice, despite more myelin debris were accumulating in the CC of Trem2+/−.”
§ TREM2 activation on microglia promotes myelin debris clearance and remyelination in a model of multiple sclerosis > Discussion
plain- Asserted: passes — The authors put it forward as true.
- Checkable: passes — It can be checked against evidence.
- Load-bearing: passes — The paper’s conclusions depend on it.
- Based: passes — The paper gives a reason why it holds.
It may state two separate claims as one.
A result the paper reports from its own data — it cites no other source for it, so there is none to check. The quote shows it is in the paper.
In the paper
“First, we tested AL002a in Trem2+/+ mice, without detecting any difference in damaged myelin accumulation, number of microglia or OPC in the CC compared to the control group at 4 weeks on CPZ (data not shown).”
§ TREM2 activation on microglia promotes myelin debris clearance and remyelination in a model of multiple sclerosis > Discussion
plain- Asserted: passes — The authors put it forward as true.
- Checkable: passes — It can be checked against evidence.
- Load-bearing: passes — The paper’s conclusions depend on it.
- Based: passes — The paper gives a reason why it holds.
It may state two separate claims as one.
In the paper
“TREM2 engagement leads to DAP12 phosphorylation, followed by recruitment and activation of the spleen-associated tyrosine kinase (SYK), resulting in downstream signaling events leading to proliferation, survival, phagocytosis, and secretion of cytokines and chemokines [47].”
§ TREM2 activation on microglia promotes myelin debris clearance and remyelination in a model of multiple sclerosis > Introduction
What the sources say
- Not checked — no full text of the sourcecites [47] Ulland TK, Colonna M (2018) TREM2—a key player in microglial biology and Alzheimer disease. Nat Rev Neurol 14:667–675. https://doi.org/10.1038/s41582-018-0072-1 source
plaindirect- Asserted: passes — The authors put it forward as true.
- Checkable: passes — It can be checked against evidence.
- Load-bearing: passes — The paper’s conclusions depend on it.
- Based: passes — The paper gives a reason why it holds.
It may state two separate claims as one.
In the paper
“Microglial cells and infiltrating monocytes/macrophages can have a dual role in MS lesions. They could contribute to myelin damage and lesion expansion, or they may have a protective role by clearing myelin debris, reducing inflammation and secreting regenerative factors promoting remyelination [48].”
§ TREM2 activation on microglia promotes myelin debris clearance and remyelination in a model of multiple sclerosis > Introduction
What the sources say
- Not checked — no full text of the sourcecites [48] Voet S, Prinz M, van Loo G (2019) Microglia in central nervous system inflammation and multiple sclerosis pathology. Trends Mol Med 25:112–123. https://doi.org/10.1016/j.molmed.2018.11.005 source
hedgedconditional- Asserted: passes — The authors put it forward as true.
- Checkable: passes — It can be checked against evidence.
- Load-bearing: passes — The paper’s conclusions depend on it.
- Based: passes — The paper gives a reason why it holds.
Probably not a substantial claim. It may state two separate claims as one.
A conclusion the paper draws from its own results — it cites no other source for it, so there is none to check. The quote shows it is in the paper.
In the paper
“These results are relevant as they propose TREM2 on microglia as a potential new target to promote remyelination.”
- Also stated in: § Introduction · hedged
“This provides the proof of concept that antibody-mediated TREM2 activation could promote remyelination, suggesting this as a potential novel therapeutic avenue in MS and other demyelinating disorders.”
§ TREM2 activation on microglia promotes myelin debris clearance and remyelination in a model of multiple sclerosis > Abstract
hedgedconditional- Asserted: passes — The authors put it forward as true.
- Checkable: passes — It can be checked against evidence.
- Load-bearing: passes — The paper’s conclusions depend on it.
- Based: passes — The paper gives a reason why it holds.
It may state two separate claims as one.
- Rests on an assumption: The cuprizone-induced demyelination model is a valid model of multiple sclerosis for evaluating remyelination-promoting therapies.
- Rests on an assumption: Antibody-mediated TREM2 activation in the cuprizone model is predictive of therapeutic benefit in MS.
- Also stated in: § Introduction · hedged
In the paper
“In MS, impaired generation of OLs from OPCs leads to persistent demyelination, myelin debris accumulation, and axonal damage which clinically manifests as neurological disability [11].”
§ TREM2 activation on microglia promotes myelin debris clearance and remyelination in a model of multiple sclerosis > Introduction
What the sources say
- Not checked — no full text of the sourcecites [11] Dulamea AO (2017) Role of oligodendrocyte dysfunction in demyelination, remyelination and neurodegeneration in multiple sclerosis. Adv Exp Med Biol 958:91–127. https://doi.org/10.1007/978-3-319-47861-6_7 source
plaindirect- Asserted: passes — The authors put it forward as true.
- Checkable: passes — It can be checked against evidence.
- Load-bearing: passes — The paper’s conclusions depend on it.
- Based: passes — The paper gives a reason why it holds.
It may state two separate claims as one.
A claim is checked only against the cited paper’s full text, never its abstract, and none is available for its sources.
In the paper
“A critical modulator of microglia functions is the triggering receptor expressed on myeloid cells-2 (TREM2), an innate immune receptor expressed by several myeloid cells including brain microglia [23, 45].”
§ TREM2 activation on microglia promotes myelin debris clearance and remyelination in a model of multiple sclerosis > Introduction
What the sources say
- Not checked — no full text of the sourcecites [23] Kiialainen A, Hovanes K, Paloneva J, Kopra O, Peltonen L (2005) Dap12 and Trem2, molecules involved in innate immunity and neurodegeneration, are co-expressed in the CNS. Neurobiol Dis 18:314–322 source
- Not checked — no full text of the sourcecites [45] Schmid CD, Sautkulis LN, Danielson PE, Cooper J, Hasel KW, Hilbush BS et al (2002) Heterogeneous expression of the triggering receptor expressed on myeloid cells-2 on adult murine microglia. J Neurochem 83:1309–1320 source
plain- Asserted: passes — The authors put it forward as true.
- Checkable: passes — It can be checked against evidence.
- Load-bearing: passes — The paper’s conclusions depend on it.
- Based: passes — The paper gives a reason why it holds.
Probably not a substantial claim.
A claim is checked only against the cited paper’s full text, never its abstract, and none is available for its sources.
In the paper
“Homozygous loss-of-function mutations in TREM2 or DAP12 genes cause Nasu–Hakola disease (NHD), a rare genetic disorder characterized by fatal presenile dementia and bone cysts [38, 39].”
§ TREM2 activation on microglia promotes myelin debris clearance and remyelination in a model of multiple sclerosis > Introduction
What the sources say
- Not checked — no full text of the sourcecites [38] Paloneva J, Kestila M, Wu J, Salminen A, Bohling T, Ruotsalainen V et al (2000) Loss-of-function mutations in TYROBP (DAP12) result in a presenile dementia with bone cysts. Nat Genet 25:357–361. https://doi.org/10.1038/77153 source
- Not checked — no full text of the sourcecites [39] Paloneva J, Manninen T, Christman G, Hovanes K, Mandelin J, Adolfsson R et al (2002) Mutations in two genes encoding different subunits of a receptor signaling complex result in an identical disease phenotype. Am J Hum Genet 71:656–662 source
plaindirect- Asserted: passes — The authors put it forward as true.
- Checkable: passes — It can be checked against evidence.
- Load-bearing: fails — The paper’s conclusions may not depend on it.
- Based: passes — The paper gives a reason why it holds.
Probably not a substantial claim. The paper’s conclusions may not depend on it.
In the paper
“TREM2 binds on the membrane to the DNAX-activation protein 12 (DAP12) which is an adaptor protein required for TREM2 surface expression and intracellular signaling [47].”
§ TREM2 activation on microglia promotes myelin debris clearance and remyelination in a model of multiple sclerosis > Introduction
What the sources say
- Not checked — no full text of the sourcecites [47] Ulland TK, Colonna M (2018) TREM2—a key player in microglial biology and Alzheimer disease. Nat Rev Neurol 14:667–675. https://doi.org/10.1038/s41582-018-0072-1 source
plaindirect- Asserted: passes — The authors put it forward as true.
- Checkable: passes — It can be checked against evidence.
- Load-bearing: fails — The paper’s conclusions may not depend on it.
- Based: passes — The paper gives a reason why it holds.
Probably not a substantial claim. The paper’s conclusions may not depend on it.
What the paper did — it cites no source for this, so there is none to check. The quote shows it is in the paper.
In the paper
“AL002a was screened for TREM2 specificity by selecting for binding to wild-type (Trem2+/+), but not Trem2−/− BMDM.”
§ TREM2 activation on microglia promotes myelin debris clearance and remyelination in a model of multiple sclerosis > Materials and methods > Antibody generation
plain- Asserted: passes — The authors put it forward as true.
- Checkable: passes — It can be checked against evidence.
- Load-bearing: passes — The paper’s conclusions depend on it.
- Based: passes — The paper gives a reason why it holds.
Probably not a substantial claim.
In the paper
“Neuropathological findings in NHD include loss of myelin and axons in the brain, with reactive astrocytosis and microglial activation [25].”
§ TREM2 activation on microglia promotes myelin debris clearance and remyelination in a model of multiple sclerosis > Introduction
What the sources say
- Not checked — no full text of the sourcecites [25] Klunemann HH, Ridha BH, Magy L, Wherrett JR, Hemelsoet DM, Keen RW et al (2005) The genetic causes of basal ganglia calcification, dementia, and bone cysts: DAP12 and TREM2. Neurology 64:1502–1507 source
plain- Asserted: passes — The authors put it forward as true.
- Checkable: passes — It can be checked against evidence.
- Load-bearing: fails — The paper’s conclusions may not depend on it.
- Based: passes — The paper gives a reason why it holds.
Probably not a substantial claim. The paper’s conclusions may not depend on it. It may state two separate claims as one.
A conclusion the paper draws from its own results — it cites no other source for it, so there is none to check. The quote shows it is in the paper.
In the paper
“In conclusion, AL002a treatment preserved axonal health during CPZ treatment, thus preventing neurodegeneration.”
- Also stated in: § Discussion · hedged
“Importantly, our study has also shown that AL002a treatment after CPZ is associated with reduced Nf-L plasma levels (a markers of axonal/neuronal damage), suggesting that increased remyelination also results in preserved axonal integrity, further proven by increased SMI31 staining in the CC of AL002a-treated mice.”
§ TREM2 activation on microglia promotes myelin debris clearance and remyelination in a model of multiple sclerosis > Results > AL002a treatment preserves axonal integrity
plaindirect- Asserted: passes — The authors put it forward as true.
- Checkable: passes — It can be checked against evidence.
- Load-bearing: passes — The paper’s conclusions depend on it.
- Based: passes — The paper gives a reason why it holds.
It may state two separate claims as one.
- Also stated in: § Discussion · hedged
A conclusion the paper draws from its own results — it cites no other source for it, so there is none to check. The quote shows it is in the paper.
In the paper
“These results demonstrate that AL002a is a potent inducer of TREM2 intracellular signaling in vitro (by both cross-linking and soluble stimulation) and in vivo (by soluble stimulation).”
§ TREM2 activation on microglia promotes myelin debris clearance and remyelination in a model of multiple sclerosis > Results > Effects of a newly generated TREM2-specific antibody on TREM2 signaling
boosteddirect- Asserted: passes — The authors put it forward as true.
- Checkable: passes — It can be checked against evidence.
- Load-bearing: passes — The paper’s conclusions depend on it.
- Based: passes — The paper gives a reason why it holds.
It may state two separate claims as one.
A conclusion the paper draws from its own results — it cites no other source for it, so there is none to check. The quote shows it is in the paper.
In the paper
“Overall, these data from NHD individuals, confirmed that TREM2 receptor plays a critical role in phagocytic pathways in human myeloid cells and that during NHD pathology genes involved in phagocytosis are specifically dysregulated.”
§ TREM2 activation on microglia promotes myelin debris clearance and remyelination in a model of multiple sclerosis > Results > Macrophages derived from Nasu–Hakola subjects display a defect in phagocytic pathways
boosteddirect- Asserted: passes — The authors put it forward as true.
- Checkable: passes — It can be checked against evidence.
- Load-bearing: passes — The paper’s conclusions depend on it.
- Based: passes — The paper gives a reason why it holds.
It may state two separate claims as one.
A conclusion the paper draws from its own results — it cites no other source for it, so there is none to check. The quote shows it is in the paper.
In the paper
“Trem2 haploinsufficiency leads to inefficient myelin debris clearance, reduced OPC recruitment, even if it does not impact on the number of microglia accumulating in the CC.”
§ TREM2 activation on microglia promotes myelin debris clearance and remyelination in a model of multiple sclerosis > Results > Trem2 haploinsufficiency results in defective myelin debris clearance in the CPZ model of CNS demyelination
plaindirect- Asserted: passes — The authors put it forward as true.
- Checkable: passes — It can be checked against evidence.
- Load-bearing: passes — The paper’s conclusions depend on it.
- Based: passes — The paper gives a reason why it holds.
It may state two separate claims as one.
A conclusion the paper draws from its own results — it cites no other source for it, so there is none to check. The quote shows it is in the paper.
In the paper
“Therefore, AL002a leads to a significant increase in myelin phagocytosis by Trem2+/− BMDM after 1 h, and also it accelerates their degradative capacity at later time points.”
§ TREM2 activation on microglia promotes myelin debris clearance and remyelination in a model of multiple sclerosis > Results > AL002a antibody promotes myelin uptake and degradation in vivo and in vitro
plaindirect- Asserted: passes — The authors put it forward as true.
- Checkable: passes — It can be checked against evidence.
- Load-bearing: passes — The paper’s conclusions depend on it.
- Based: passes — The paper gives a reason why it holds.
It may state two separate claims as one.
A conclusion the paper draws from its own results — it cites no other source for it, so there is none to check. The quote shows it is in the paper.
In the paper
“In conclusion, our data demonstrate that AL002a acts as a potent TREM2 agonist both in vitro and in vivo, and its agonistic activity is boosted by the presence of myelin.”
§ TREM2 activation on microglia promotes myelin debris clearance and remyelination in a model of multiple sclerosis > Results > Effects of a newly generated TREM2-specific antibody on TREM2 signaling
boosteddirect- Asserted: passes — The authors put it forward as true.
- Checkable: passes — It can be checked against evidence.
- Load-bearing: passes — The paper’s conclusions depend on it.
- Based: passes — The paper gives a reason why it holds.
It may state two separate claims as one.
A conclusion the paper draws from its own results — it cites no other source for it, so there is none to check. The quote shows it is in the paper.
In the paper
“These findings suggest that AL002a antibody treatment enhanced myelin debris internalization by microglia at WK 4, as demonstrated by a higher dMBP amount detected inside CD68+ structures in microglia (Fig. 5a, c), accompanied by decreased dMBP total volume per field (Fig. 4b, c) at WK 4 + 3D.”
§ TREM2 activation on microglia promotes myelin debris clearance and remyelination in a model of multiple sclerosis > Results > AL002a antibody promotes myelin uptake and degradation in vivo and in vitro
hedgeddirect- Asserted: passes — The authors put it forward as true.
- Checkable: passes — It can be checked against evidence.
- Load-bearing: passes — The paper’s conclusions depend on it.
- Based: passes — The paper gives a reason why it holds.
It may state two separate claims as one.
A conclusion the paper draws from its own results — it cites no other source for it, so there is none to check. The quote shows it is in the paper.
In the paper
“These results demonstrate that AL002a is a strong inducer of DAP12 phosphorylation (after cross-linking and as soluble), and it acts as an agonist of TREM2 signaling.”
§ TREM2 activation on microglia promotes myelin debris clearance and remyelination in a model of multiple sclerosis > Results > Effects of a newly generated TREM2-specific antibody on TREM2 signaling
boosteddirect- Asserted: passes — The authors put it forward as true.
- Checkable: passes — It can be checked against evidence.
- Load-bearing: passes — The paper’s conclusions depend on it.
- Based: passes — The paper gives a reason why it holds.
It may state two separate claims as one.
A conclusion the paper draws from its own results — it cites no other source for it, so there is none to check. The quote shows it is in the paper.
In the paper
“These results suggest that the presence of a fully functional TREM2 receptor on microglia is critical for efficient myelin debris removal and quick OPC recruitment observed in Trem2+/+ mice.”
§ TREM2 activation on microglia promotes myelin debris clearance and remyelination in a model of multiple sclerosis > Results > Trem2 haploinsufficiency results in defective myelin debris clearance in the CPZ model of CNS demyelination
hedgeddirect- Asserted: passes — The authors put it forward as true.
- Checkable: passes — It can be checked against evidence.
- Load-bearing: passes — The paper’s conclusions depend on it.
- Based: passes — The paper gives a reason why it holds.
It may state two separate claims as one.
A conclusion the paper draws from its own results — it cites no other source for it, so there is none to check. The quote shows it is in the paper.
In the paper
“Altogether our study indicates that strategies aimed at targeting TREM2 on microglia in the CNS are feasible and might be a promising intervention in MS to promote microglia functions in clearing myelin debris, favoring the recruitment of OPCs, and their subsequent differentiation into mature myelin-generating oligodendrocytes, eventually leading to remyelination and axonal protection.”
§ TREM2 activation on microglia promotes myelin debris clearance and remyelination in a model of multiple sclerosis > Discussion
hedgedconditional- Asserted: passes — The authors put it forward as true.
- Checkable: passes — It can be checked against evidence.
- Load-bearing: passes — The paper’s conclusions depend on it.
- Based: passes — The paper gives a reason why it holds.
It may state two separate claims as one.
- Rests on an assumption: Currently, no therapies are available to regenerate myelin and to halt MS disease progression.
In the paper
“NHD is characterized by loss of myelin and microglia activation in the CNS [25].”
§ TREM2 activation on microglia promotes myelin debris clearance and remyelination in a model of multiple sclerosis > Results > Macrophages derived from Nasu–Hakola subjects display a defect in phagocytic pathways
What the sources say
- Not checked — no full text of the sourcecites [25] Klunemann HH, Ridha BH, Magy L, Wherrett JR, Hemelsoet DM, Keen RW et al (2005) The genetic causes of basal ganglia calcification, dementia, and bone cysts: DAP12 and TREM2. Neurology 64:1502–1507 source
plaincorrelational- Asserted: passes — The authors put it forward as true.
- Checkable: passes — It can be checked against evidence.
- Load-bearing: passes — The paper’s conclusions depend on it.
- Based: passes — The paper gives a reason why it holds.
It may state two separate claims as one.
In the paper
“Remyelination is known to protect axons from ongoing degeneration [18].”
§ TREM2 activation on microglia promotes myelin debris clearance and remyelination in a model of multiple sclerosis > Results > AL002a treatment preserves axonal integrity
What the sources say
- Not checked — no full text of the sourcecites [18] Irvine KA, Blakemore WF (2008) Remyelination protects axons from demyelination-associated axon degeneration. Brain 131:1464–1477. https://doi.org/10.1093/brain/awn080 source
boosteddirect- Asserted: passes — The authors put it forward as true.
- Checkable: passes — It can be checked against evidence.
- Load-bearing: passes — The paper’s conclusions depend on it.
- Based: passes — The paper gives a reason why it holds.
Probably not a substantial claim.
A conclusion the paper draws from its own results — it cites no other source for it, so there is none to check. The quote shows it is in the paper.
In the paper
“This could suggest that one copy of TREM2 is sufficient to sustain microglia expansion after CPZ-induced damage, but cannot support a fully functional response by microglia to clear the conspicuous amount of myelin debris derived from massive oligodendrocyte death.”
§ TREM2 activation on microglia promotes myelin debris clearance and remyelination in a model of multiple sclerosis > Discussion
hedgeddirect- Asserted: passes — The authors put it forward as true.
- Checkable: passes — It can be checked against evidence.
- Load-bearing: passes — The paper’s conclusions depend on it.
- Based: passes — The paper gives a reason why it holds.
It may state two separate claims as one.
The paper relies on this without support.
The cuprizone-induced demyelination model is a valid model of multiple sclerosis for evaluating remyelination-promoting therapies.
“TREM2 activation on microglia promotes myelin debris clearance and remyelination in a model of multiple sclerosis”
“Here, we explored the effect of antibody-mediated TREM2 activation on microglia in a well-established toxin-induced model of demyelination in the CNS resulting from exposure to the copper chelator cuprizone (CPZ) in the diet [31].”
The paper relies on this without support.
Antibody-mediated TREM2 activation in the cuprizone model is predictive of therapeutic benefit in MS.
“This provides the proof of concept that antibody-mediated TREM2 activation could promote remyelination, suggesting this as a potential novel therapeutic avenue in MS and other demyelinating disorders.”
The paper relies on this without support.
A systematic characterization of TREM2 expression on microglia-macrophages in different types of MS lesions has not been done.
“Yet, a systematic characterization of TREM2 expression on microglia-macrophages in different types of MS lesions has not been done.”
The paper relies on this without support.
Whether heterozygous (Trem2+/−) mice would present the same or a milder phenotype than Trem2−/− mice has not been evaluated before in the CPZ model.
“Whether heterozygous (Trem2+/−) mice would present the same or a milder phenotype than Trem2−/− mice has not been evaluated before in the CPZ model.”
The paper relies on this without support.
Microglia internalize and phagocytose myelin, which is then degraded intracellularly by lysosomal structures.
“Microglia internalize and phagocytose myelin which is then degraded intracellularly by lysosomal structures.”
The paper relies on this without support.
Currently, no therapies are available to regenerate myelin and to halt MS disease progression.
“Currently, no therapies are available to regenerate myelin and to halt MS disease progression.”
The paper relies on this without support.
Trem2+/+ mouse microglia are very efficient in supporting complete remyelination in the acute CPZ model.
“On the other end, it is well known that Trem2+/+ mouse microglia are very efficient in supporting complete remyelination in the acute CPZ model.”
The paper relies on this without support.
In MS, a defect in TREM2 pathways has not been demonstrated, but remyelination fails in most cases.
“This is different from what observed in MS, where a defect in TREM2 pathways has not been demonstrated, but still remyelination fails in most cases.”
Claims other papers make about this one
Each is checked against this paper’s own text: does it say what the citing paper says it does?
The source backs part of the claim, not all of it — or backs it for a different population, condition or comparison.
In the citing paper
“In particular, the clearance of myelin debris by microglia is believed to be critically required to limit neuronal damage in EAE (Cignarella et al., 2020; Takahashi et al., 2007; Weinger et al., 2011).”
From SYK coordinates neuroprotective microglial responses in neurodegenerative disease (2022) · cites this paper as Cignarella et al., 2020
Experimental — accuracy not yet measuredThe source backs part of the claim, not all of it — or backs it for a different population, condition or comparison.
In the citing paper
“Consistent with previous studies, we found that feeding Sykcon mice a cuprizone diet leads to increased staining of the phagocytic marker CD68 in Iba1+ cells (Figures S6G and S6H) (Cignarella et al., 2020).”
From SYK coordinates neuroprotective microglial responses in neurodegenerative disease (2022) · cites this paper as Cignarella et al., 2020
Experimental — accuracy not yet measuredThe source backs part of the claim, not all of it — or backs it for a different population, condition or comparison.
In the citing paper
“Mice lacking TREM2 also experience greater axonal damage after cuprizone treatment.”
From Oligodendrocyte death and myelin loss in the cuprizone model: an updated overview of the intrinsic and extrinsic causes of cuprizone demyelination (2022) · cites this paper as [202]
Experimental — accuracy not yet measuredThe source backs part of the claim, not all of it — or backs it for a different population, condition or comparison.
In the citing paper
“In mice lacking TREM2, fewer microglia accumulate in the corpus callosum during demyelination due to reduced proliferation which in turn reduces myelin debris clearance [200–202].”
From Oligodendrocyte death and myelin loss in the cuprizone model: an updated overview of the intrinsic and extrinsic causes of cuprizone demyelination (2022) · cites this paper as [202]
Experimental — accuracy not yet measuredThe cited source says what the claim attributes to it.
In the citing paper
“Conversely, TREM2 agonists accelerate myelin clearance in the cuprizone model to facilitate remyelination [202] (Fig. 4J).”
From Oligodendrocyte death and myelin loss in the cuprizone model: an updated overview of the intrinsic and extrinsic causes of cuprizone demyelination (2022) · cites this paper as [202]
The cited source says what the claim attributes to it.
In the citing paper
“In mice, activation of TREM2 through intraperitoneal administration of TREM2 agonistic monoclonal antibodies (mAb) increased clearance of myelin debris from demyelinating lesions caused by CPZ (22) or by intracranial injection of lysolecithin (23).”
From Acute TREM2 inhibition depletes MAFB-high microglia and hinders remyelination (2025) · cites this paper as [22]
The cited source says what the claim attributes to it.
In the citing paper
“This activation promoted new myelin formation and preserved axonal integrity.”
From Acute TREM2 inhibition depletes MAFB-high microglia and hinders remyelination (2025) · cites this paper as [22]
Self-check
Percentages, sums and reported differences re-computed from the paper’s own numbers.
Each contradiction between two passages listed here was confirmed by an independent check.
Rated minor: it would not touch a result — a value no result rests on, a p-value that stays on the same side of the significance level, or a conflict that is clerical, resolved elsewhere in the paper, or outside its own findings.
In the paper
§ TREM2 activation on microglia promotes myelin debris clearance and remyelination in a model of multiple sclerosis > Results > AL002a treatment leads to increased OPC density, OL maturation, and remyelination
“In parallel, we observed a significant increase in the mRNA of myelin genes such as myelin basic protein (Mbp), myelin-associated protein (Mag), and proteolipid protein 1 (Plp1) in both regions (Fig. 7f–h).”
§ TREM2 activation on microglia promotes myelin debris clearance and remyelination in a model of multiple sclerosis > Results > AL002a treatment leads to increased OPC density, OL maturation, and remyelination
“RT-qPCR quantification of mRNA levels of myelin basic protein (Mbp) (f), myelin oligodendrocyte glycoprotein (Mog) (g) and proteolipid protein 1 (Plp1) (h)”
Rated minor: it would not touch a result — a value no result rests on, a p-value that stays on the same side of the significance level, or a conflict that is clerical, resolved elsewhere in the paper, or outside its own findings.
In the paper
§ TREM2 activation on microglia promotes myelin debris clearance and remyelination in a model of multiple sclerosis > Results > Trem2 haploinsufficiency results in defective myelin debris clearance in the CPZ model of CNS demyelination
“No differences were noted in the number of Iba1+ nor GFAP+ cells in the CC in Trem2+/− compared to Trem2+/+ mice (Fig. 3a, c, f, g)”
§ TREM2 activation on microglia promotes myelin debris clearance and remyelination in a model of multiple sclerosis > Materials and methods > Mouse tissue processing and histological analyses
“CNPase, dMBP, and GFAP were analyzed as the percentage area of positive staining (number of positive pixels/mm2) within the region of interest.”
Citations
Cites
A Unique Microglia Type Associated with Restricting Development of Alzheimer’s Disease
Keren-Shaul, H., Spinrad, A., Weiner, A., Matcovitch-Natan, O., Dvir-Szternfeld, R., Ulland, T. K., David, E., Baruch, K., Lara-Astaiso, D., Toth, B., et al. (2017) · Cell · doi:10.1016/j.cell.2017.05.018 · Cited by 5,493
TREM2 Variants in Alzheimer's Disease
Guerreiro, R., Wojtas, A., Bras, J., Carrasquillo, M., Rogaeva, E., Majounie, E., Cruchaga, C., Sassi, C., Kauwe, J. S. K., Younkin, S., et al. (2013) · New England Journal of Medicine · doi:10.1056/nejmoa1211851 · Cited by 3,020
Self-citationVariant of TREM2 Associated with the Risk of Alzheimer's Disease
Jonsson, T., Stefansson, H., Steinberg, S., Jonsdottir, I., Jonsson, P. V., Snaedal, J., Bjornsson, S., Huttenlocher, J., Levey, A. I., Lah, J. J., et al. (2013) · New England Journal of Medicine · doi:10.1056/nejmoa1211103 · Cited by 2,558
Identification of a unique TGF-β–dependent molecular and functional signature in microglia
Butovsky, O., Jedrychowski, M. P., Moore, C. S., Cialic, R., Lanser, A. J., Gabriely, G., Koeglsperger, T., Dake, B., Wu, P. M., Doykan, C. E., et al. (2014) · Nature Neuroscience · doi:10.1038/nn.3599 · Cited by 2,543
New tools for studying microglia in the mouse and human CNS
Bennett, M. L., Bennett, F. C., Liddelow, S. A., Ajami, B., Zamanian, J. L., Fernhoff, N. B., Mulinyawe, S. B., Bohlen, C. J., Adil, A., Tucker, A., et al. (2016) · Proceedings of the National Academy of Sciences · doi:10.1073/pnas.1525528113 · Cited by 1,804
M2 microglia and macrophages drive oligodendrocyte differentiation during CNS remyelination
Miron, V. E., Boyd, A., Zhao, J.-W., Yuen, T. J., Ruckh, J. M., Shadrach, J. L., van Wijngaarden, P., Wagers, A. J., Williams, A., Franklin, R. J. M., et al. (2013) · Nature Neuroscience · doi:10.1038/nn.3469 · Cited by 1,777 · cited 1×
“Microglia regenerative expression profile involves genes related to phagocytosis, breakdown of myelin debris, as well as secretion of regenerative factors and tissue remodeling [36, 49] that can drive OPC differentiation [29, 32].”
TREM2 Lipid Sensing Sustains the Microglial Response in an Alzheimer’s Disease Model
Wang, Y., Cella, M., Mallinson, K., Ulrich, J. D., Young, K. L., Robinette, M. L., Gilfillan, S., Krishnan, G. M., Sudhakar, S., Zinselmeyer, B. H., et al. (2015) · Cell · doi:10.1016/j.cell.2015.01.049 · Cited by 1,736
Self-citationLipid-associated macrophages control metabolic homeostasis in a Trem2-dependent manner
Jaitin, D. A., Adlung, L., Thaiss, C. A., Weiner, A., Li, B., Descamps, H., Lundgren, P., Bleriot, C., Liu, Z., Deczkowska, A., et al. (2019) · Cell · doi:10.1016/j.cell.2019.05.054 · Cited by 1,377
The Immunopathology of Multiple Sclerosis: An Overview
Lassmann, H., Brück, W., & Lucchinetti, C. F. (2007) · Brain Pathology · doi:10.1111/j.1750-3639.2007.00064.x · Cited by 1,182
Takahashi, K., Rochford, C. D. P., & Neumann, H. (2005) · The Journal of Experimental Medicine · doi:10.1084/jem.20041611 · Cited by 1,124
Debris clearance by microglia: an essential link between degeneration and regeneration
Neumann, H., Kotter, M. R., & Franklin, R. J. M. (2008) · Brain · doi:10.1093/brain/awn109 · Cited by 1,111
Matsushima, G. K., & Morell, P. (2001) · Brain Pathology · doi:10.1111/j.1750-3639.2001.tb00385.x · Cited by 984
TREM2-mediated early microglial response limits diffusion and toxicity of amyloid plaques
Wang, Y., Ulland, T. K., Ulrich, J. D., Song, W., Tzaferis, J. A., Hole, J. T., Yuan, P., Mahan, T. E., Shi, Y., Gilfillan, S., et al. (2016) · Journal of Experimental Medicine · doi:10.1084/jem.20151948 · Cited by 840
Self-citationYuan, P., Condello, C., Keene, C. D., Wang, Y., Bird, T. D., Paul, S. M., Luo, W., Colonna, M., Baddeley, D., & Grutzendler, J. (2016) · Neuron · doi:10.1016/j.neuron.2016.05.003 · Cited by 817 · cited 1×
“Similarly, lack of TREM2 in AD experimental models led to reduced microglia number, clustering and activation around CNS amyloid plaques accompanied by decreased plaque compaction and increased neuritic damage [50, 51, 53].”
BackgroundTREM2 mutations implicated in neurodegeneration impair cell surface transport and phagocytosis
Kleinberger, G., Yamanishi, Y., Suárez-Calvet, M., Czirr, E., Lohmann, E., Cuyvers, E., Struyfs, H., Pettkus, N., Wenninger-Weinzierl, A., Mazaheri, F., et al. (2014) · Science Translational Medicine · doi:10.1126/scitranslmed.3009093 · Cited by 798
Myelin Impairs CNS Remyelination by Inhibiting Oligodendrocyte Precursor Cell Differentiation
Kotter, M. R., Li, W.-W., Zhao, C., & Franklin, R. J. M. (2006) · The Journal of Neuroscience · doi:10.1523/jneurosci.2615-05.2006 · Cited by 768
TREM2 regulates microglial cholesterol metabolism upon chronic phagocytic challenge
Nugent, A. A., Lin, K., van Lengerich, B., Lianoglou, S., Przybyla, L., Davis, S. S., Llapashtica, C., Wang, J., Kim, D. J., Xia, D., et al. (2020) · Neuron · doi:10.1016/j.neuron.2019.12.007 · Cited by 745
TREM2 — a key player in microglial biology and Alzheimer disease
Ulland, T. K., & Colonna, M. (2018) · Nature Reviews Neurology · doi:10.1038/s41582-018-0072-1 · Cited by 735
Paloneva, J., Manninen, T., Christman, G., Hovanes, K., Mandelin, J., Adolfsson, R., Bianchin, M., Bird, T., Miranda, R., Salmaggi, A., et al. (2002) · The American Journal of Human Genetics · doi:10.1086/342259 · Cited by 683
At the acidic edge: emerging functions for lysosomal membrane proteins
Eskelinen, E., Tanaka, Y., & Säftig, P. (2003) · Trends in Cell Biology · doi:10.1016/s0962-8924(03)00005-9 · Cited by 669
Regenerating CNS myelin — from mechanisms to experimental medicines
Franklin, R. J. M., & ffrench-Constant, C. (2017) · Nature Reviews Neuroscience · doi:10.1038/nrn.2017.136 · Cited by 647
Inefficient clearance of myelin debris by microglia impairs remyelinating processes
Lampron, A., Larochelle, A., Laflamme, N., Préfontaine, P., Plante, M.-M., Sánchez, M. G., Yong, V. W., Stys, P. K., Tremblay, M.-È., & Rivest, S. (2015) · Journal of Experimental Medicine · doi:10.1084/jem.20141656 · Cited by 595
Apolipoprotein E Is a Ligand for Triggering Receptor Expressed on Myeloid Cells 2 (TREM2)
Atagi, Y., Liu, C.-C., Painter, M. M., Chen, X.-F., Verbeeck, C., Zheng, H., Li, X., Rademakers, R., Kang, S. S., Xu, H., et al. (2015) · Journal of Biological Chemistry · doi:10.1074/jbc.m115.679043 · Cited by 587
TREM2 sustains microglial expansion during aging and response to demyelination
Poliani, P. L., Wang, Y., Fontana, E., Robinette, M. L., Yamanishi, Y., Gilfillan, S., & Colonna, M. (2015) · Journal of Clinical Investigation · doi:10.1172/jci77983 · Cited by 525
Microglia in Central Nervous System Inflammation and Multiple Sclerosis Pathology
Voet, S., Prinz, M., & van Loo, G. (2019) · Trends in Molecular Medicine · doi:10.1016/j.molmed.2018.11.005 · Cited by 503
Loss-of-function mutations in TYROBP (DAP12) result in a presenile dementia with bone cysts
Paloneva, J., Kestilä, M., Wu, J., Salminen, A., Böhling, T., Ruotsalainen, V., Hakola, P., Bakker, A. B. H., Phillips, J. H., Pekkarinen, P., et al. (2000) · Nature Genetics · doi:10.1038/77153 · Cited by 460
False discovery rate, sensitivity and sample size for microarray studies
Pawitan, Y., Michiels, S., Koscielny, S., Gusnanto, A., & Ploner, A. (2005) · Bioinformatics · doi:10.1093/bioinformatics/bti448 · Cited by 455
Remyelination protects axons from demyelination-associated axon degeneration
Irvine, K. A., & Blakemore, W. F. (2008) · Brain · doi:10.1093/brain/awn080 · Cited by 420
Microglial/macrophage accumulation during cuprizone-induced demyelination in C57BL/6 mice
Hiremath, M. M., Saito, Y., Knapp, G. W., Ting, J. P.-Y., Suzuki, K., & Matsushima, G. K. (1998) · Journal of Neuroimmunology · doi:10.1016/s0165-5728(98)00168-4 · Cited by 412
Rayaprolu, S., Mullen, B., Baker, M., Lynch, T., Finger, E., Seeley, W. W., Hatanpaa, K. J., Lomen-Hoerth, C., Kertesz, A., Bigio, E. H., et al. (2013) · Molecular Neurodegeneration · doi:10.1186/1750-1326-8-19 · Cited by 404
The pro-remyelination properties of microglia in the central nervous system
Lloyd, A. F., & Miron, V. E. (2019) · Nature Reviews Neurology · doi:10.1038/s41582-019-0184-2 · Cited by 381
Glial response during cuprizone-induced de- and remyelination in the CNS: lessons learned
Gudi, V., Gingele, S., Skripuletz, T., & Stangel, M. (2014) · Frontiers in Cellular Neuroscience · doi:10.3389/fncel.2014.00073 · Cited by 375
Identification of a microglia phenotype supportive of remyelination
Olah, M., Amor, S., Brouwer, N., Vinet, J., Eggen, B., Biber, K., & Boddeke, H. W. G. M. (2012) · Glia · doi:10.1002/glia.21266 · Cited by 358
Myelin-laden macrophages are anti-inflammatory, consistent with foam cells in multiple sclerosis
Boven, L. A., Van Meurs, M., Van Zwam, M., Wierenga-Wolf, A., Hintzen, R. Q., Boot, R. G., Aerts, J. M., Amor, S., Nieuwenhuis, E. E., & Laman, J. D. (2006) · Brain · doi:10.1093/brain/awh707 · Cited by 353
Schmid, C. D., Sautkulis, L. N., Danielson, P. E., Cooper, J., Hasel, K. W., Hilbush, B. S., Sutcliffe, J. G., & Carson, M. J. (2002) · Journal of Neurochemistry · doi:10.1046/j.1471-4159.2002.01243.x · Cited by 351
Piccio, L. M., Buonsanti, C., Cella, M., Tassi, I., Schmidt, R. E., Fenoglio, C., Rinker, J. R., Naismith, R. T., Panina‐Bordignon, P., Passini, N., et al. (2008) · Brain · doi:10.1093/brain/awn217 · Cited by 311
Self-citationThe Triggering Receptor Expressed on Myeloid Cells 2 Binds Apolipoprotein E
Bailey, C. C., DeVaux, L. B., & Farzan, M. (2015) · Journal of Biological Chemistry · doi:10.1074/jbc.m115.677286 · Cited by 303
TREM2 regulates microglial cell activation in response to demyelination in vivo
Cantoni, C., Bollman, B., Licastro, D., Xie, M., Mikesell, R., Schmidt, R., Yuede, C. M., Galimberti, D., Olivecrona, G., Klein, R. S., et al. (2015) · Acta Neuropathologica · doi:10.1007/s00401-015-1388-1 · Cited by 296
Pattern Recognition by TREM-2: Binding of Anionic Ligands
Daws, M. R., Sullam, P. M., Niemi, E. C., Chen, T. T., Tchao, N. K., & Seaman, W. E. (2003) · The Journal of Immunology · doi:10.4049/jimmunol.171.2.594 · Cited by 291
TREM2 Variant p.R47H as a Risk Factor for Sporadic Amyotrophic Lateral Sclerosis
Cady, J., Koval, E. D., Benitez, B. A., Zaidman, C., Jockel-Balsarotti, J., Allred, P., Baloh, R. H., Ravits, J., Simpson, E., Appel, S. H., et al. (2014) · JAMA Neurology · doi:10.1001/jamaneurol.2013.6237 · Cited by 262
Self-citationImpaired Differentiation of Osteoclasts in TREM-2–deficient Individuals
Cella, M., Buonsanti, C., Strader, C., Kondo, T., Salmaggi, A., & Colonna, M. (2003) · Journal of Experimental Medicine · doi:10.1084/jem.20022220 · Cited by 256
The genetic causes of basal ganglia calcification, dementia, and bone cysts: DAP12 and TREM2
Klünemann, H. H., Ridha, B. H., Magy, L., Wherrett, J. R., Hemelsoet, D. M., Keen, R. W., De Bleecker, J. L., Rossor, M. N., Marienhagen, J., Klein, H. E., et al. (2005) · Neurology · doi:10.1212/01.wnl.0000160304.00003.ca · Cited by 254
Yuan, P., Condello, C., Keene, C. D., Wang, Y., Bird, T. D., Paul, S. M., Luo, W., Colonna, M., Baddeley, D., & Grutzendler, J. (2016) · Neuron · doi:10.1016/j.neuron.2016.09.016 · Cited by 219
CNS manifestations of Nasu–Hakola disease
Bm, J., Autti, T., Raininko, R., Partanen, J., Salonen, O., Puranen, M., Hakola, P., & Haltia, M. (2001) · Neurology · doi:10.1212/wnl.56.11.1552 · Cited by 205
Voß, E. V., Škuljec, J., Gudi, V., Skripuletz, T., Pul, R., Trebst, C., & Stangel, M. (2012) · Neurobiology of Disease · doi:10.1016/j.nbd.2011.09.008 · Cited by 202
Insights into TREM2 biology by network analysis of human brain gene expression data
Forabosco, P., Ramasamy, A., Trabzuni, D., Walker, R., Smith, C., Bras, J., Levine, A. P., Hardy, J., Pocock, J. M., Guerreiro, R., et al. (2013) · Neurobiology of Aging · doi:10.1016/j.neurobiolaging.2013.05.001 · Cited by 180
Dulamea, A. O. (2017) · Advances in Experimental Medicine and Biology · doi:10.1007/978-3-319-47861-6_7 · Cited by 128
A stochastic view of lymphocyte motility and trafficking within the lymph node
Wei, S. H., Parker, I., Miller, M. J., & Cahalan, M. D. (2003) · Immunological Reviews · doi:10.1034/j.1600-065x.2003.00076.x · Cited by 117
Kiialainen, A., Hovanes, K., Paloneva, J., Kopra, O., & Peltonen, L. (2005) · Neurobiology of Disease · doi:10.1016/j.nbd.2004.09.007 · Cited by 114
[46] Isolation of myelin from nerve tissue
Norton, W. T. (1974) · Methods in enzymology on CD-ROM/Methods in enzymology · doi:10.1016/0076-6879(74)31049-x · Cited by 109
An Engulfment Assay: A Protocol to Assess Interactions Between CNS Phagocytes and Neurons
Schafer, D. P., Lehrman, E. K., Heller, C. T., & Stevens, B. (2014) · Journal of Visualized Experiments · doi:10.3791/51482 · Cited by 108
Matsuo, A., Lee, G. C., Terai, K., Takami, K., Hickey, W. F., McGeer, E. G., & McGeer, P. L. (1997) · Europe PMC (PubMed Central) · Cited by 71
Chromoxane cyanine R. II. Staining of animal tissues by the dye and its iron complexes
Kiernan, J. A. (1984) · Journal of Microscopy · doi:10.1111/j.1365-2818.1984.tb00501.x · Cited by 32
Bock, V., Botturi, A., Gaviani, P., Lamperti, E., Maccagnano, C., Piccio, L. M., Silvani, A., & Salmaggi, A. (2013) · Journal of the Neurological Sciences · doi:10.1016/j.jns.2013.01.021 · Cited by 21
Self-citation
Cited by
Sorted by citations
Colonna, M. (2023) · Nature Reviews Immunology · doi:10.1038/s41577-023-00837-1 · Cited by 394
SYK coordinates neuroprotective microglial responses in neurodegenerative disease
Ennerfelt, H., Frost, E. L., Shapiro, D. A., Holliday, C., Zengeler, K. E., Voithofer, G., Bolte, A. C., Lammert, C. R., Kulas, J. A., Ulland, T. K., et al. (2022) · Cell · doi:10.1016/j.cell.2022.09.030 · Cited by 297
“Experimental autoimmune encephalomyelitis (EAE) induction and scoring—”
InfluentialDopamine, Immunity, and Disease
Channer, B., Matt, S. M., Nickoloff-Bybel, E. A., Pappa, V., Agarwal, Y., Wickman, J. R., & Gaskill, P. J. (2022) · Pharmacological Reviews · doi:10.1124/pharmrev.122.000618 · Cited by 328
Macrophage phenotypes and functions: resolving inflammation and restoring homeostasis
Rodríguez-Morales, P., & Franklin, R. A. (2023) · Trends in Immunology · doi:10.1016/j.it.2023.10.004 · Cited by 341
Trem2 restrains the enhancement of tau accumulation and neurodegeneration by β-amyloid pathology
Lee, S.-H., Meilandt, W. J., Xie, L., Gandham, V. D., Ngu, H., Barck, K. H., Rezzonico, M. G., Imperio, J., Lalehzadeh, G., Huntley, M. A., et al. (2021) · Neuron · doi:10.1016/j.neuron.2021.02.010 · Cited by 300
Metadata
- Authors
- Cignarella, F., Filipello, F., Bollman, B., Cantoni, C., Locca, A., Mikesell, R., Manis, M., Ibrahim, A., Deng, L., Benitez, B. A., Cruchaga, C., Licastro, D., Mihindukulasuriya, K., Harari, O., Buckland, M., Holtzman, D. M., Rosenthal, A., Schwabe, T., Tassi, I., & Piccio, L.
- Affiliations
- Washington University in St. Louis (US)
- Humanitas University (IT)
- Alector (United States) (US)
- AREA Science Park (IT)
- The University of Sydney (AU)
- Corresponding author
- Tassi, Ilaria
- Piccio, Laura
- ORCID
- Venue
- Acta Neuropathologica
- Published
- 2020-08-09
- Volume
- 140
- Issue
- 4
- Pages
- 513-534
- ISSN
- 0001-6322 (ISSN-L)
- 1432-0533
- PMC
- PMC7498497
- OpenAlex
- W3048044439
- Cited by
- 392
- References
- 54
- Citations by year
- 2026: 63 · 2025: 67 · 2024: 74 · 2023: 76 · 2022: 64 · 2021: 41 · 2020: 6
- FWCI
- 26.16
- Type
- journal article
- Language
- en
- Open access
- hybrid
- doi.org
- Locations
- Acta Neuropathologica (publishedVersion, cc-by)
- PubMed (publishedVersion)
- PubMed Central (submittedVersion, cc-by)
- Digital Commons@Becker (Washington University School of Medicine) (submittedVersion, cc-by)
- Funders
- NIA (RF1AG058501)
- Alector
- Topics
- Health Sciences › Medicine › Clinical Neurology › Multiple Sclerosis Research Studies
- Life Sciences › Neuroscience › Neurology › Neuroinflammation and Neurodegeneration Mechanisms
- Life Sciences › Immunology and Microbiology › Immunology › Phagocytosis and Immune Regulation
- Keywords
- TREM2, microglia, multiple sclerosis, remyelination, myelin debris clearance, phagocytosis, cuprizone model, demyelination, oligodendrocyte precursor cells, oligodendrocyte differentiation, axonal integrity, macrophages
- MeSH terms
- Remyelination, Adult, Aged, Animals, Disease Models, Animal, Female, Humans, Male, Membrane Glycoproteins, Mice, Inbred C57BL, Middle Aged, Multiple Sclerosis, Myelin Sheath, Phagocytosis, Receptors, Immunologic, Microglia, Mice, Knockout, Mice
About these checks
Registry, retraction, Cites and statistics results are computed, not judged, with one exception: a printed reference that no index lists is read once by a model before it counts as a citation error. Claims are extracted by a model and kept only when their quote appears verbatim in the text; each cited source is then checked, with a model’s help, for whether it says what the claim relies on. Those verdicts can be wrong — read the claim’s quote and the cited source before relying on one.
A language model drew the claims from the paper on 2026-10-13, under version 3 of the claim definition (model deepseek-v4.1-flash, prompt extract-v3).
A second model labelled each claim on 2026-10-13 (model jev-1.13-20260917, definition revision gold-guideline-v0.2).
Cited sources are checked with a language model’s help (gpt-6-sol).
Statistics and arithmetic are recomputed, not judged.
Confidence bands are shown only for fields calibrated on our annotated test set. None is calibrated yet, so no band is shown.
What counts as a claim ›How we measure confidence ›How we check this ›
Are you an author, or do you see a problem with this page? Request a review
