

The DOI matches its Crossref record; 1 of the 1 references it cites were found in a registry or an index.
Model-Guided Design and Optimization of CPA Perfusion Protocols for Whole Organ Cryopreservation
Abstract
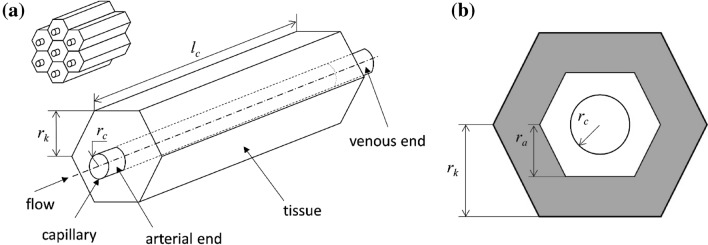
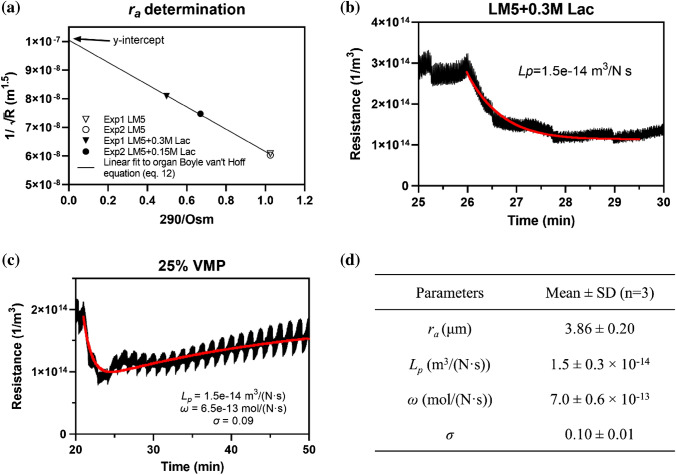
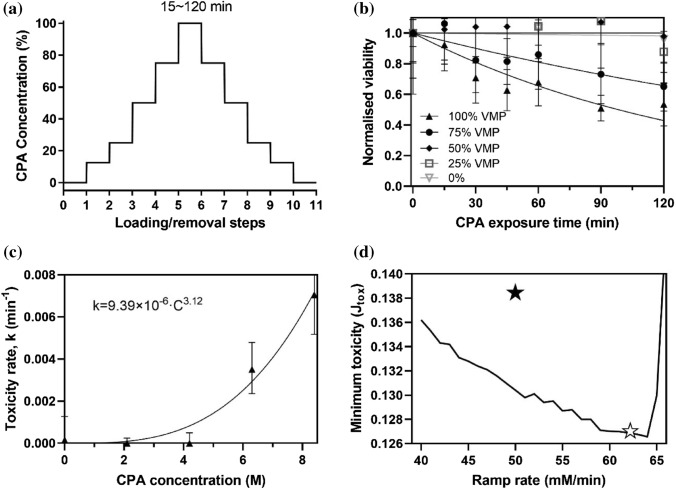
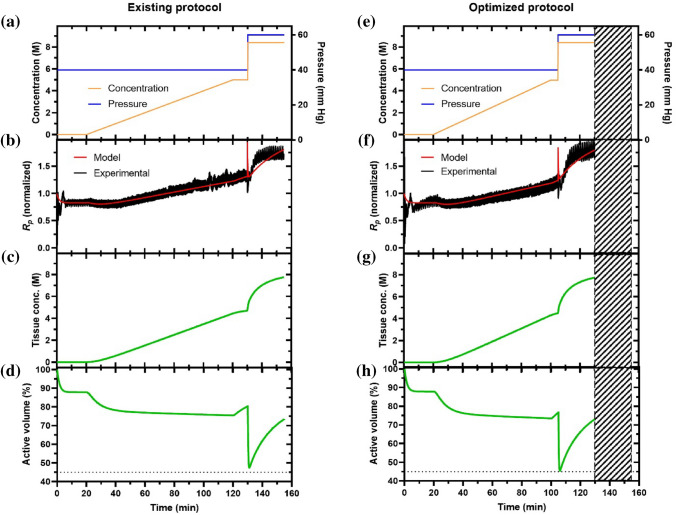
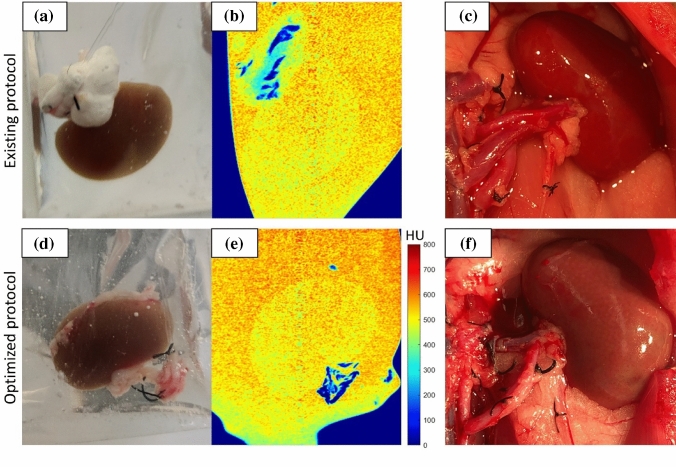
Vitrification could enable long-term organ preservation, but only after loading high-concentration, potentially toxic cryoprotective agents (CPAs) by perfusion. In this paper, we combine a two-compartment Krogh cylinder model with a toxicity cost function to theoretically optimize the loading of CPA (VMP) in rat kidneys as a model system. First, based on kidney perfusion experiments, we systematically derived the parameters for a CPA transport loading model, including the following: V b = 86.0% ( r a = 3.86 μm), L p = 1.5 × 10 –14 m 3 /(N·s), ω = 7.0 × 10 –13 mol/(N·s), σ = 0.10. Next, we measured the toxicity cost function model parameters as α = 3.12 and β = 9.39 × 10 –6 . Combining these models, we developed an improved kidney-loading protocol predicted to achieve vitrification while minimizing toxicity. The optimized protocol resulted in shorter exposure (25 min or 18.5% less) than the gold standard kidney-loading protocol for VMP, which had been developed based on decades of empirical practice. After testing both protocols on rat kidneys, we found comparable physical and biological outcomes. While we did not dramatically reduce toxicity, we did reduce the time. As our approach is now validated, it can be used on other organs lacking defined toxicity data to reduce CPA exposure time and provide a rapid path toward developing CPA perfusion protocols for other organs and CPAs.
Overview
The claims and statistics of this paper haven’t been checked yet.
Run the check — free, no account needed. It reads the open-access text and checks the sources it cites.
Integrity signals
Registry
Cites
Statistics
Figures
Verification
Claims the paper makes
The claims and statistics of this paper haven’t been checked yet.
Run the check — free, no account needed. It reads the open-access text and checks the sources it cites.
Claims other papers make about this one
Each is checked against this paper’s own text: does it say what the citing paper says it does?
In the citing paper
“but increase biological toxicity relative to the CPAs chosen here35.”
From Physical vitrification and nanowarming at liter-scale CPA volumes: toward organ cryopreservation (2025) · cites this paper as [35]
In the citing paper
“Higher concentrations of CPAs such as VS83 (83% w/w CPA) have even lower CCR and can be more easily vitrified”
From Physical vitrification and nanowarming at liter-scale CPA volumes: toward organ cryopreservation (2025) · cites this paper as [35]
Self-check
Percentages, sums and reported differences re-computed from the paper’s own numbers.
The self-check needs the paper’s full text.
Citations
Cites
Han, Z., Rao, J. S., Gangwar, L., Namsrai, B.-E., Pasek-Allen, J. L., Etheridge, M. L., Wolf, S. M., Pruett, T. L., Bischof, J. C., & Finger, E. B. (2023) · Nature Communications · doi:10.1038/s41467-023-38824-8 · Cited by 173
Self-citation
Research works printed but not linked: 41
- Aye, M., C. Di Giorgio, M. De Mo, A. Botta, J. Perrin, and B. Courbiere. Assessment of the genotoxicity of three cryoprotectants used for human oocyte vitrification: dimethyl sulfoxide, ethylene glycol and propylene glycol. Food Chem. Toxicol. 48:1905–1912, 2010. · DOI
- Benson, J. D., A. Z. Higgins, K. Desai, and A. Eroglu. A toxicity cost function approach to optimal CPA equilibration in tissues. Cryobiology. 80:144–155, 2018. · DOI
- Benson, J. D., A. J. Kearsley, and A. Z. Higgins. Mathematical optimization of procedures for cryoprotectant equilibration using a toxicity cost function. Cryobiology. 64:144–151, 2012. · DOI
- Davidson, A. F., C. Glasscock, D. R. McClanahan, J. D. Benson, and A. Z. Higgins. Toxicity minimized cryoprotectant addition and removal procedures for adherent endothelial cells. PLoS ONE.10:e0142828, 2015. · DOI
- Fahy, G. Analysis of" solution effects" injury: equations for calculating phase diagram information for the ternary systems NaCl-dimethylsulfoxide-water and NaCl-glycerol-water. Biophys. J. 32:837–850, 1980. · DOI
- Fahy, G. M., and S. E. Ali. Cryopreservation of the mammalian kidney. Cryobiology. 35:114–131, 1997. · DOI
- Fahy, G. M., D. MacFarlane, C. A. Angell, and H. Meryman. Vitrification as an approach to cryopreservation. Cryobiology. 21:407–426, 1984. · DOI · Paper page
- Fahy, G. M., B. Wowk, R. Pagotan, A. Chang, J. Phan, B. Thomson, and L. Phan. Physical and biological aspects of renal vitrification. Organogenesis. 5:167–175, 2009. · DOI · Paper page
- Fahy, G. M., B. Wowk, J. Wu, and S. Paynter. Improved vitrification solutions based on the predictability of vitrification solution toxicity. Cryobiology. 48:22–35, 2004. · DOI · Paper page
- Fahy, G. M., B. Wowk, J. Wu, J. Phan, C. Rasch, A. Chang, and E. Zendejas. Cryopreservation of organs by vitrification: perspectives and recent advances. Cryobiology. 48:157–178, 2004. · DOI · Paper page
- Finger, E. B., and J. C. Bischof. Cryopreservation by vitrification: a promising approach for transplant organ banking. Curr. Opin. Organ Transplant. 23:353–360, 2018. · DOI
- Gao, Z., B. Namsrai, Z. Han, P. Joshi, J. S. Rao, V. Ravikumar, A. Sharma, H. L. Ring, D. Idiyatullin, and E. C. Magnuson. Vitrification and rewarming of magnetic nanoparticle-loaded rat hearts. Adv. Mater. Technol. 7:2100873, 2022. · DOI · Paper page
- Han, Z., A. Sharma, Z. Gao, T. W. Carlson, M. G. O’Sullivan, E. B. Finger, and J. C. Bischof. Diffusion limited cryopreservation of tissue with radiofrequency heated metal forms. Adv. Healthcare Mater. 9:2000796, 2020. · DOI
- Hawkins, H. E., P. Clark, E. C. Lippert, and A. M. Karow Jr. Functional preservation of the mammalian kidney VI. viability assessment of rabbit kidneys perfused at 25° C with dimethyl sulfoxide in RPS-2. J. Surgical Res. 38:281–288, 1985. · DOI
- Hipkiss, A. R. Proteotoxicity and the contrasting effects of oxaloacetate and glycerol on Caenorhabditis elegans life span: a role for methylglyoxal? Rejuvenation Res. 13:547–551, 2010. · DOI
- Jacob, S. W., and C. Jack. Pharmacology of dimethyl sulfoxide in cardiac and CNS damage. Pharmacol. Rep. 61:225–235, 2009. · DOI
- Jammalamadaka, D., and S. Raissi. Ethylene glycol, methanol and isopropyl alcohol intoxication. Am. J. Med. Sci. 339:276–281, 2010. · DOI
- Jensen, P. K., and K. Steven. Angiotensin II induced reduction of peritubular capillary diameter in the rat kidney. Pflügers Archiv. 371:245–250, 1977. · DOI
- Jomha, N. M., G. K. Law, A. Abazari, K. Rekieh, J. A. Elliott, and L. E. McGann. Permeation of several cryoprotectant agents into porcine articular cartilage. Cryobiology. 58:110–114, 2009. · DOI
- Jomha, N. M., A. D. Weiss, J. F. Forbes, G. K. Law, J. A. Elliott, and L. E. McGann. Cryoprotectant agent toxicity in porcine articular chondrocytes. Cryobiology. 61:297–302, 2010. · DOI
- Kedem, O., and A. Katchalsky. Thermodynamic analysis of the permeability of biological membranes to non-electrolytes. Biochim. Biophys. Acta. 27:229–246, 1958. · DOI
- Koiri, R. K., and S. K. Trigun. Dimethyl sulfoxide activates tumor necrosis factorα-p53 mediated apoptosis and down regulates D-fructose-6-phosphate-2-kinase and lactate dehydrogenase-5 in Dalton’s lymphoma in vivo. Leukemia Res. 35:950–956, 2011. · DOI
- Krogh, A. The number and distribution of capillaries in muscles with calculations of the oxygen pressure head necessary for supplying the tissue. J. Physiol. 52:409–415, 1919. · DOI
- Lachenbruch, C., and K. Diller. A network thermodynamic model of kidney perfusion with a cryoprotective agent. ASME J. Biomech. Eng. 121:574–583, 1999. · DOI
- Lachenbruch, C. A., and K. R. Diller. A network thermodynamic model of kidney perfusion. IFAC Proc. Vol. 27:289–290, 1994. · DOI
- Lee, C.-J., B. S. Gardiner, J. P. Ngo, S. Kar, R. G. Evans, and D. W. Smith. Accounting for oxygen in the renal cortex: a computational study of factors that predispose the cortex to hypoxia. Am. J. Physiol.-Renal Physiol. 313:F218–F236, 2017. · DOI
- Lee, C. Y., and B. Rubinsky. A multi-dimensional model of momentum and mass transfer in the liver. Int. J. Heat Mass Transf. 32:2421–2434, 1989. · DOI
- Lee, L. K., T. W. Meyer, A. S. Pollock, and D. H. Lovett. Endothelial cell injury initiates glomerular sclerosis in the rat remnant kidney. J. Clin. Invest. 96:953–964, 1995. · DOI
- Lovelock, J. The haemolysis of human red blood-cells by freezing and thawing. Biochim. Biophys. Acta. 10:414–426, 1953. · DOI
- Mazur, P., S. Leibo, and E. Chu. A two-factor hypothesis of freezing injury: evidence from Chinese hamster tissue-culture cells. Exp. Cell Res. 71:345–355, 1972. · DOI
- McGann, L., M. Stevenson, K. Muldrew, and N. Schachar. Kinetics of osmotic water movement in chondrocytes isolated from articular cartilage and applications to cryopreservation. J. Orthop. Res. 6:109–115, 1988. · DOI
- Nyengaard, J., and R. Rasch. The impact of experimental diabetes mellitus in rats on glomerular capillary number and sizes. Diabetologia. 36:189–194, 1993. · DOI
- Nyengaard, J. R. Number and dimensions of rat glomerular capillaries in normal development and after nephrectomy. Kidney Int. 43:1049–1057, 1993. · DOI
- Pegg, D., B. Rubinsky, M. Diaper, and C. Lee. Analysis of the introduction and removal of glycerol in rabbit kidneys using a Krogh cylinder model. Cryobiology. 23:150–160, 1986. · DOI
- Prickett, R. C., J. A. Elliott, S. Hakda, and L. E. McGann. A non-ideal replacement for the Boyle van’t Hoff equation. Cryobiology. 57:130–136, 2008. · DOI
- Rubinsky, B., and E. G. Cravalho. Transient mass transfer processes during the perfusion of a biological organ with a cryophylactic agent solution. Cryobiology. 19:70–82, 1982. · DOI
- Sharma, A., C. Y. Lee, B.-E. Namsrai, Z. Han, D. Tobolt, J. S. Rao, Z. Gao, M. L. Etheridge, M. Garwood, and M. G. Clemens. Cryopreservation of whole rat livers by vitrification and nanowarming. Ann. Biomed. Eng. 15:1–12, 2022.
- Sharma, A., J. S. Rao, Z. Han, L. Gangwar, B. Namsrai, Z. Gao, H. L. Ring, E. Magnuson, M. Etheridge, and B. Wowk. Vitrification and nanowarming of kidneys. Ad. Sci. 8:2101691, 2021. · DOI · Paper page
- Sharma, S., E. Raymond, H. Soda, E. Izbicka, K. Davidson, R. Lawrence, and D. D. Von Hoff. Dimethyl sulfoxide (DMSO) causes a reversible inhibition of telomerase activity in a Burkitt lymphoma cell line. Leuk. Res. 22:663–670, 1998. · DOI
- Vondráček, J., K. Souček, M. A. Sheard, K. Chramostová, Z. Andrysík, J. Hofmanová, and A. Kozubík. Dimethyl sulfoxide potentiates death receptor-mediated apoptosis in the human myeloid leukemia U937 cell line through enhancement of mitochondrial membrane depolarization. Leuk. Res. 30:81–89, 2006. · DOI
- Zhan, L., J. S. Rao, N. Sethia, M. Q. Slama, Z. Han, D. Tobolt, M. Etheridge, Q. P. Peterson, C. S. Dutcher, and J. C. Bischof. Pancreatic islet cryopreservation by vitrification achieves high viability, function, recovery and clinical scalability for transplantation. Nat. Med. 28:798–808, 2022. · DOI · Paper page
Cited by
Sorted by citations
Physical vitrification and nanowarming at liter-scale CPA volumes: toward organ cryopreservation
Gangwar, L., Han, Z., Scheithauer, C., Namsrai, B.-E., Kantesaria, S., Goldstein, R., Etheridge, M. L., Finger, E. B., & Bischof, J. C. (2025) · Nature Communications · doi:10.1038/s41467-025-63483-2 · Cited by 26
Self-citation
Metadata
- Authors
- Han, Z., Rao, J. S., Ramesh, S., Hergesell, J., Namsrai, B.-E., Etheridge, M. L., Finger, E. B., & Bischof, J. C.
- ORCID
- Bischof, John C.
- Venue
- Annals of Biomedical Engineering
- Published
- 2023-06-23
- Volume
- 51
- Issue
- 10
- Pages
- 2216-2228
- ISSN
- 0090-6964
- 1573-9686
- PMC
- PMC10518287
- Cited by
- 21
- References
- 1
- Language
- en
- Funders
- National Institutes of Health (NIH R01DK117425, NIH R01DK132211, NIH R01HL135046)
- National Science Foundation (NSF EEC 1941543)
- Biostasis Research Institute
About these checks
Registry, retraction, Cites and statistics results are computed, not judged, with one exception: a printed reference that no index lists is read once by a model before it counts as a citation error. Claims are extracted by a model and kept only when their quote appears verbatim in the text; each cited source is then checked, with a model’s help, for whether it says what the claim relies on. Those verdicts can be wrong — read the claim’s quote and the cited source before relying on one.
Statistics and arithmetic are recomputed, not judged.
Confidence bands are shown only for fields calibrated on our annotated test set. None is calibrated yet, so no band is shown.
What counts as a claim ›How we measure confidence ›How we check this ›
Are you an author, or do you see a problem with this page? Request a review
