

The DOI matches its Crossref record; 48 of the 48 references it cites were found in a registry or an index.
Aging-elevated inflammation promotes DNMT3A R878H-driven clonal hematopoiesis
Abstract
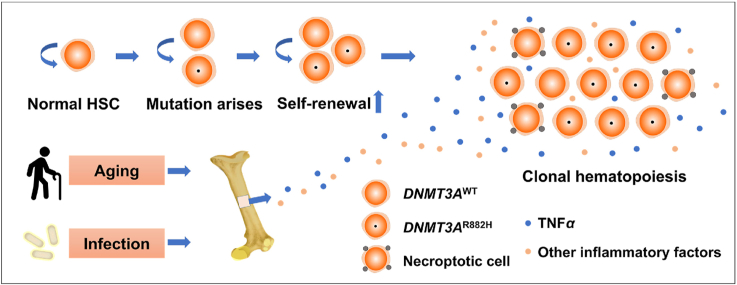
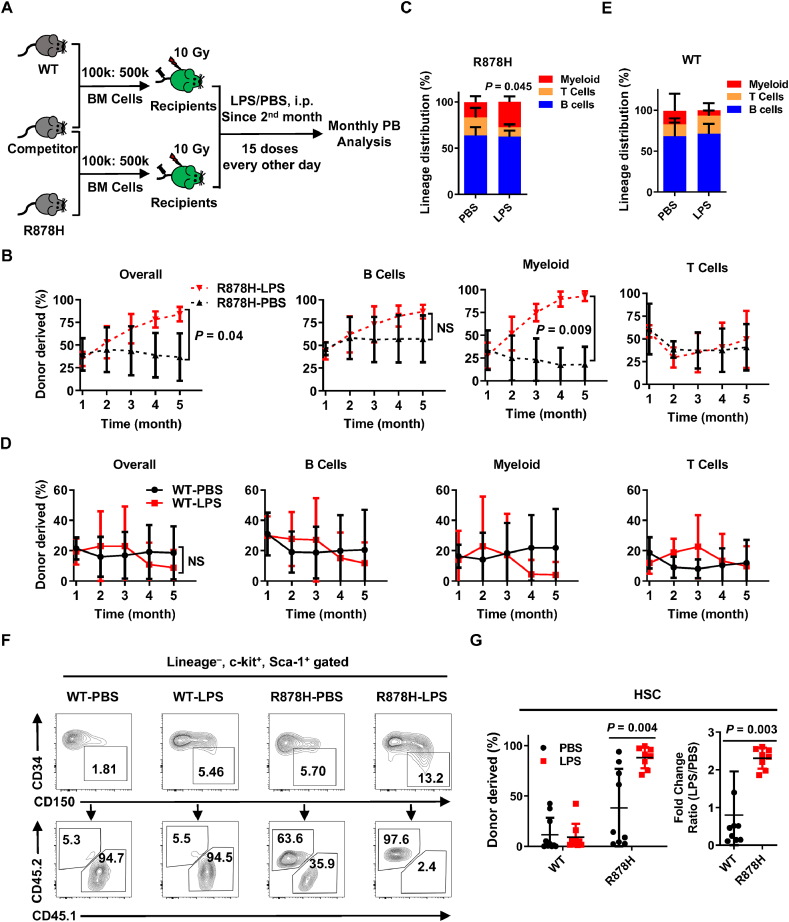
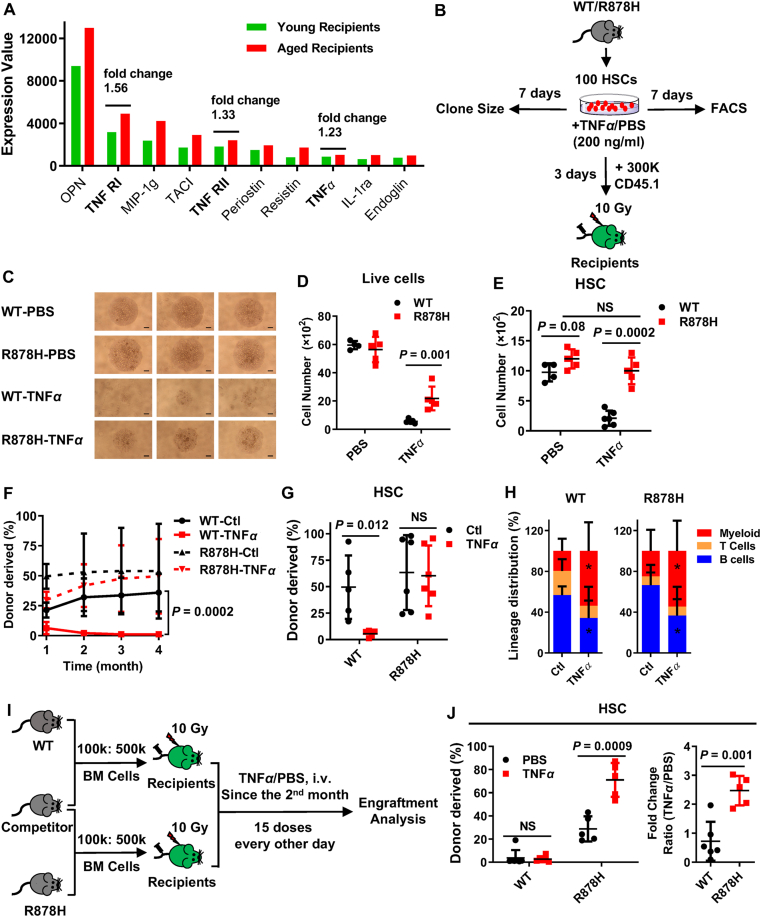
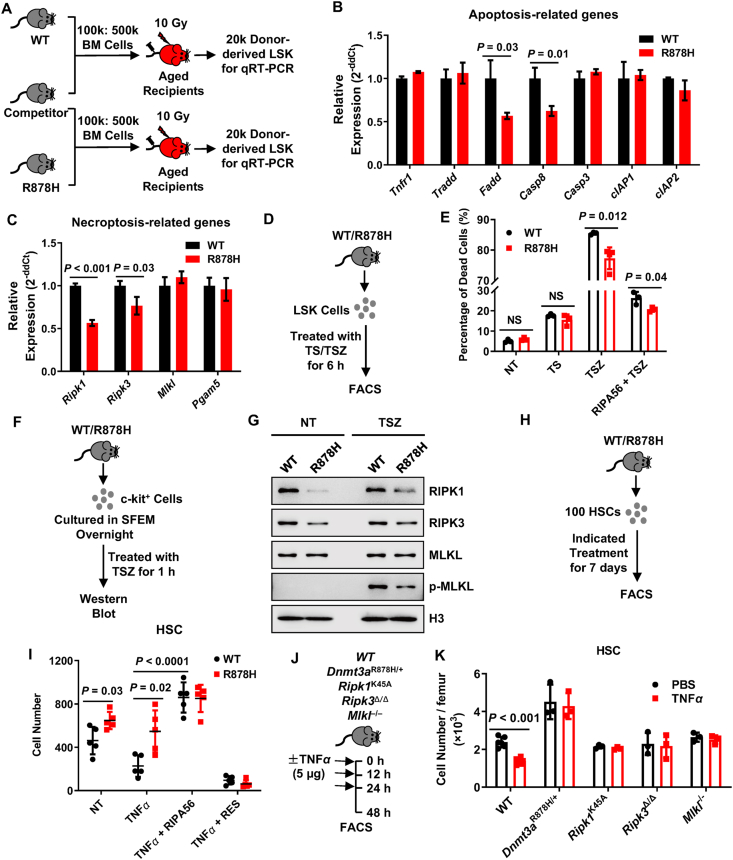
Aging-elevated DNMT3A R882H-driven clonal hematopoiesis (CH) is a risk factor for myeloid malignancies remission and overall survival. Although some studies were conducted to investigate this phenomenon, the exact mechanism is still under debate. In this study, we observed that DNMT3A R878H bone marrow cells (human allele: DNMT3A R882H) displayed enhanced reconstitution capacity in aged bone marrow milieu and upon inflammatory insult. DNMT3A R878H protects hematopoietic stem and progenitor cells from the damage induced by chronic inflammation, especially TNFα insults. Mechanistically, we identified that RIPK1–RIPK3–MLKL-mediated necroptosis signaling was compromised in R878H cells in response to proliferation stress and TNFα insults. Briefly, we elucidated the molecular mechanism driving DNMT3A R878H-based clonal hematopoiesis, which raises clinical value for treating DNMT3A R882H-driven clonal hematopoiesis and myeloid malignancies with aging.
Overview
The claims and statistics of this paper haven’t been checked yet.
Run the check — free, no account needed. It reads the open-access text and checks the sources it cites.
Integrity signals
Registry
Cites
Statistics
Figures
Verification
Claims the paper makes
The claims and statistics of this paper haven’t been checked yet.
Run the check — free, no account needed. It reads the open-access text and checks the sources it cites.
Claims other papers make about this one
Each is checked against this paper’s own text: does it say what the citing paper says it does?
In the citing paper
“Furthermore, in mice, expansion of Tet2+/− subclones exposed to IL-1 is associated with attenuated downregulation of HSC self-renewal genes compared with WT HSCs,49 whereas clonal advantage of Dnmt3aR878H HSPCs correlates with reduced activation of necroptosis in response to TNF-α challenge.97”
From Selective advantage of mutant stem cells in human clonal hematopoiesis is associated with attenuated response to inflammation and aging (2024) · cites this paper as [97]
Self-check
Percentages, sums and reported differences re-computed from the paper’s own numbers.
The self-check needs the paper’s full text.
Citations
Cites
Genomic and Epigenomic Landscapes of Adult De Novo Acute Myeloid Leukemia
The Cancer Genome Atlas Research Network (2013) · New England Journal of Medicine · doi:10.1056/nejmoa1301689 · Cited by 5,078
Age-related clonal hematopoiesis associated with adverse outcomes
Jaiswal, S., Fontanillas, P., Flannick, J., Manning, A., Grauman, P. V., Mar, B. G., Lindsley, R. C., Mermel, C. H., Burtt, N., Chavez, A., et al. (2014) · New England Journal of Medicine · doi:10.1056/nejmoa1408617 · Cited by 4,841
Chronic Inflammation (Inflammaging) and Its Potential Contribution to Age-Associated Diseases
Franceschi, C., & Campisi, J. (2014) · The Journals of Gerontology Series A: Biological Sciences and Medical Sciences · doi:10.1093/gerona/glu057 · Cited by 3,891
Clonal hematopoiesis and blood-cancer risk inferred from blood DNA sequence
Genovese, G., Kähler, A. K., Handsaker, R. E., Lindberg, J., Rose, S. A., Bakhoum, S. F., Chambert, K., Mick, E., Neale, B. M., Fromer, M., et al. (2014) · New England Journal of Medicine · doi:10.1056/nejmoa1409405 · Cited by 3,531
DNMT3A Mutations in Acute Myeloid Leukemia
Ley, T. J., Ding, L., Walter, M. J., McLellan, M. D., Lamprecht, T., Larson, D. E., Kandoth, C., Payton, J. E., Baty, J., Welch, J., et al. (2010) · New England Journal of Medicine · doi:10.1056/nejmoa1005143 · Cited by 1,983
Age-related mutations associated with clonal hematopoietic expansion and malignancies
Xie, M., Lu, C., Wang, J., McLellan, M. D., Johnson, K. J., Wendl, M. C., McMichael, J. F., Schmidt, H. K., Yellapantula, V., Miller, C. A., et al. (2014) · Nature Medicine · doi:10.1038/nm.3733 · Cited by 1,874
Self-citationIdentification of pre-leukaemic haematopoietic stem cells in acute leukaemia
Shlush, L. I., Zandi, S., Mitchell, A., Chen, W. C., Brandwein, J. M., Gupta, V., Kennedy, J. A., Schimmer, A. D., Schuh, A. C., Yee, K. W., et al. (2014) · Nature · doi:10.1038/nature13038 · Cited by 1,443
Self-citationDnmt3a is essential for hematopoietic stem cell differentiation
Challen, G. A., Sun, D., Jeong, M., Luo, M., Jelinek, J., Berg, J. S., Bock, C., Vasanthakumar, A., Gu, H., Xi, Y., et al. (2012) · Nature Genetics · doi:10.1038/ng.1009 · Cited by 1,122
Regulation of tumour necrosis factor signalling: live or let die
Brenner, D., Blaser, H., & Mak, T. W. (2015) · Nature Reviews Immunology · doi:10.1038/nri3834 · Cited by 998
A Small Molecule Smac Mimic Potentiates TRAIL- and TNFα-Mediated Cell Death
Li, L., Thomas, R. M., Suzuki, H., De Brabander, J. K., Wang, X., & Harran, P. G. (2004) · Science · doi:10.1126/science.1098231 · Cited by 656
Single-cell mutation analysis of clonal evolution in myeloid malignancies
Miles, L. A., Bowman, R. L., Merlinsky, T. R., Csete, I. S., Ooi, A. T., Durruthy-Durruthy, R., Bowman, M., Famulare, C., Patel, M. A., Mendez, P., et al. (2020) · Nature · doi:10.1038/s41586-020-2864-x · Cited by 512
DNMT3A in haematological malignancies
Yang, L., Rau, R., & Goodell, M. A. (2015) · Nature Reviews Cancer · doi:10.1038/nrc3895 · Cited by 509
Koo, G.-B., Morgan, M. J., Lee, D.-G., Kim, W.-J., Yoon, J.-H., Koo, J. S., Kim, S. I., Kim, S. J., Son, M. K., Hong, S. S., et al. (2015) · Cell Research · doi:10.1038/cr.2015.56 · Cited by 491
Russler-Germain, D. A., Spencer, D. H., Young, M. A., Lamprecht, T. L., Miller, C. A., Fulton, R., Meyer, M. R., Erdmann-Gilmore, P., Townsend, R. R., Wilson, R. K., et al. (2014) · Cancer Cell · doi:10.1016/j.ccr.2014.02.010 · Cited by 452
Cai, Z., Kotzin, J. J., Ramdas, B., Chen, S., Nelanuthala, S., Palam, L. R., Pandey, R., Mali, R. S., Liu, Y., Kelley, M. R., et al. (2018) · Cell Stem Cell · doi:10.1016/j.stem.2018.10.013 · Cited by 394
TNF-α Coordinates Hematopoietic Stem Cell Survival and Myeloid Regeneration
Yamashita, M., & Passegué, E. (2019) · Cell Stem Cell · doi:10.1016/j.stem.2019.05.019 · Cited by 387
Buscarlet, M., Provost, S., Zada, Y. F., Barhdadi, A., Bourgoin, V., Lépine, G., Mollica, L., Szuber, N., Dubé, M.-P., & Busque, L. (2017) · Blood · doi:10.1182/blood-2017-04-777029 · Cited by 383
Inflamm-aging of hematopoiesis, hematopoietic stem cells, and the bone marrow microenvironment
Kovtonyuk, L. V., Fritsch, K., Feng, X., Manz, M. G., & Takizawa, H. (2016) · Frontiers in Immunology · doi:10.3389/fimmu.2016.00502 · Cited by 371
Chronic infection drives Dnmt3a-loss-of-function clonal hematopoiesis via IFNγ signaling
Hormaechea-Agulla, D., Matatall, K. A., Le, D. T., Kain, B., Long, X., Kus, P., Jaksik, R., Challen, G. A., Kimmel, M., & King, K. Y. (2021) · Cell Stem Cell · doi:10.1016/j.stem.2021.03.002 · Cited by 329
Large conserved domains of low DNA methylation maintained by Dnmt3a
Jeong, M., Sun, D., Luo, M., Huang, Y., Challen, G. A., Rodriguez, B., Zhang, X., Chavez, L., Wang, H., Hannah, R., et al. (2014) · Nature Genetics · doi:10.1038/ng.2836 · Cited by 324
Self-citationChronic exposure to a TLR ligand injures hematopoietic stem cells
Esplin, B. L., Shimazu, T., Welner, R. S., Garrett, K. P., Nie, L., Zhang, Q., Humphrey, M. B., Yang, Q., Borghesi, L. A., & Kincade, P. W. (2011) · The Journal of Immunology · doi:10.4049/jimmunol.1003438 · Cited by 319
TNFα facilitates clonal expansion of JAK2V617F positive cells in myeloproliferative neoplasms
Fleischman, A. G., Aichberger, K. J., Luty, S. B., Bumm, T. G., Petersen, C. L., Doratotaj, S., Vasudevan, K. B., LaTocha, D. H., Yang, F., Press, R. D., et al. (2011) · Blood · doi:10.1182/blood-2011-04-348144 · Cited by 292
Ju, Z., Jiang, H., Jaworski, M., Rathinam, C., Gompf, A., Klein, C., Trumpp, A., & Rudolph, K. L. (2007) · Nature Medicine · doi:10.1038/nm1578 · Cited by 284
Self-citationChronic Infection Depletes Hematopoietic Stem Cells through Stress-Induced Terminal Differentiation
Matatall, K. A., Jeong, M., Chen, S., Sun, D., Chen, F., Mo, Q., Kimmel, M., & King, K. Y. (2016) · Cell Reports · doi:10.1016/j.celrep.2016.11.031 · Cited by 262
Guryanova, O. A., Shank, K., Spitzer, B., Luciani, L., Koche, R. P., Garrett-Bakelman, F. E., Ganzel, C., Durham, B. H., Mohanty, A., Hoermann, G., et al. (2016) · Nature Medicine · doi:10.1038/nm.4210 · Cited by 256
Loss of Dnmt3a Immortalizes Hematopoietic Stem Cells In Vivo
Jeong, M., Park, H. J., Celik, H., Ostrander, E. L., Reyes, J. M., Guzman, A., Rodriguez, B., Lei, Y., Lee, Y., Ding, L., et al. (2018) · Cell Reports · doi:10.1016/j.celrep.2018.03.025 · Cited by 243
Dnmt3a loss predisposes murine hematopoietic stem cells to malignant transformation
Mayle, A., Yang, L., Rodriguez, B., Zhou, T., Chang, E., Curry, C. V., Challen, G. A., Li, W., Wheeler, D., Rebel, V. I., et al. (2015) · Blood · doi:10.1182/blood-2014-08-594648 · Cited by 235
CpG island hypermethylation mediated by DNMT3A is a consequence of AML progression
Spencer, D. H., Russler-Germain, D. A., Ketkar, S., Helton, N. M., Lamprecht, T. L., Fulton, R. S., Fronick, C. C., O’Laughlin, M., Heath, S. E., Shinawi, M., et al. (2017) · Cell · doi:10.1016/j.cell.2017.01.021 · Cited by 219
Osteopontin attenuates aging‐associated phenotypes of hematopoietic stem cells
Guidi, N., Saçma, M., Ständker, L., Soller, K., Marka, G., Eiwen, K., Weiss, J. M., Kirchhoff, F., Weil, T., Cancelas, J. A., et al. (2017) · The EMBO Journal · doi:10.15252/embj.201694969 · Cited by 183
Li, D., Xu, T., Cao, Y., Wang, H., Li, L., Chen, S., Wang, X., & Shen, Z. (2015) · Proceedings of the National Academy of Sciences · doi:10.1073/pnas.1505244112 · Cited by 167
DNMT3A Loss Drives Enhancer Hypomethylation in FLT3-ITD-Associated Leukemias
Yang, L., Rodriguez, B. A. T., Mayle, A., Park, H. J., Lin, X., Luo, M., Jeong, M., Curry, C. V., Kim, S.-B., Ruau, D., et al. (2016) · Cancer Cell · doi:10.1016/j.ccell.2016.05.003 · Cited by 165
Loberg, M. A., Bell, R. K., Goodwin, L. O., Eudy, E., Miles, L. A., SanMiguel, J. M., Young, K. A., Bergstrom, D. E., Levine, R. L., Schneider, R. K., et al. (2019) · Leukemia · doi:10.1038/s41375-018-0368-6 · Cited by 137
Resibufogenin suppresses colorectal cancer growth and metastasis through RIP3-mediated necroptosis
Han, Q., Ma, Y., Wang, H., Dai, Y., Chen, C., Liu, Y., Jing, L., & Sun, X. (2018) · Journal of Translational Medicine · doi:10.1186/s12967-018-1580-x · Cited by 128
Ren, Y., Su, Y., Sun, L., He, S., Meng, L., Liao, D., Liu, X., Ma, Y., Liu, C., Li, S., et al. (2017) · Journal of Medicinal Chemistry · doi:10.1021/acs.jmedchem.6b01196 · Cited by 118
Xu, J., Wang, Y., Dai, Y., Zhang, W., Zhang, W.-N., Xiong, S.-M., Gu, Z., Wang, K., Zeng, R., Zhu, C. H., et al. (2014) · Proceedings of the National Academy of Sciences · doi:10.1073/pnas.1400150111 · Cited by 105
Chen, C., Liu, Y., Liu, Y., & Zheng, P. (2010) · Journal of Clinical Investigation · doi:10.1172/jci43873 · Cited by 105
Koya, J., Kataoka, K., Sato, T., Bando, M., Kato, Y., Tsuruta-Kishino, T., Kobayashi, H., Narukawa, K., Miyoshi, H., Shirahige, K., et al. (2016) · Nature Communications · doi:10.1038/ncomms10924 · Cited by 99
RIPK1-RIPK3-MLKL-dependent necrosis promotes the aging of mouse male reproductive system
Li, D., Meng, L., Xu, T., Su, Y., Liu, X., Zhang, Z., & Wang, X. (2017) · eLife · doi:10.7554/elife.27692 · Cited by 95
Aging-induced IL27Ra signaling impairs hematopoietic stem cells
He, H., Xu, P., Zhang, X., Liao, M., Dong, Q., Cong, T., Tang, B., Yang, X., Ye, M., Chang, Y., et al. (2020) · Blood · doi:10.1182/blood.2019003910 · Cited by 94
Self-citationChen, Z., Amro, E. M., Becker, F. R., Hölzer, M., Rasa, S. M. M., Njeru, S. N., Han, B., Sanzo, S. D., Chen, Y.-L., Tang, D., et al. (2018) · The Journal of Experimental Medicine · doi:10.1084/jem.20181505 · Cited by 89
2-HG Inhibits Necroptosis by Stimulating DNMT1-Dependent Hypermethylation of the RIP3 Promoter
Yang, Z., Jiang, B., Wang, Y., Ni, H., Zhang, J., Xia, J., Shi, M., Hung, L.-M., Ruan, J., Mak, T. W., et al. (2017) · Cell Reports · doi:10.1016/j.celrep.2017.05.012 · Cited by 78
Conditional knockin of Dnmt3a R878H initiates acute myeloid leukemia with mTOR pathway involvement
Dai, Y.-J., Wang, Y.-Y., Huang, J.-Y., Xia, L., Shi, X.-D., Xu, J., Lu, J., Su, X.-B., Yang, Y., Zhang, W.-N., et al. (2017) · Proceedings of the National Academy of Sciences · doi:10.1073/pnas.1703476114 · Cited by 78
Self-citationZhao, Q., Yu, X., Zhang, H., Liu, Y., Zhang, X., Wu, X., Xie, Q., Li, M., Ying, H., & Zhang, H. (2017) · Cell Reports · doi:10.1016/j.celrep.2017.04.011 · Cited by 49
Yuan, X., Chen, P., Du, Y., Zhu, K., Zhang, D.-Y., Yan, H., Han, L., Liu, Y., Cao, S., Zhou, G., et al. (2019) · Journal of Translational Medicine · doi:10.1186/s12967-019-1959-3 · Cited by 48
RIP1 kinase activity-dependent roles in embryonic development of Fadd-deficient mice
Liu, Y., Fan, C., Zhang, Y., Yu, X., Wu, X., Zhang, X., Zhao, Q., Zhang, H., Xie, Q., Li, M., et al. (2017) · Cell Death & Differentiation · doi:10.1038/cdd.2017.78 · Cited by 42
Lu, R., Wang, J., Ren, Z., Yin, J., Wang, Y., Cai, L., & Wang, G. G. (2019) · Cancer Research · doi:10.1158/0008-5472.can-18-3275 · Cited by 31
Self-citationZhang, X., Karatepe, K., Chiewchengchol, D., Zhu, H., Guo, R., Liu, P., Yu, H., Ren, Q., Luo, X. M., Cheng, T., et al. (2020) · Frontiers in Immunology · doi:10.3389/fimmu.2020.00626 · Cited by 6
Mechanisms of Hematopoietic Stem Cell Ageing and Targets for Hematopoietic Tumour Prevention
Liao, M., & Wang, J. (2018) · Advances in experimental medicine and biology · doi:10.1007/978-981-13-1117-8_8 · Cited by 2
Self-citation
Cited by
Jakobsen, N. A., Turkalj, S., Zeng, A. G. X., Stoilova, B., Metzner, M., Rahmig, S., Nagree, M. S., Shah, S., Moore, R., Usukhbayar, B., et al. (2024) · Cell Stem Cell · doi:10.1016/j.stem.2024.05.010 · Cited by 130
Metadata
- Authors
- Liao, M., Chen, R., Yang, Y., He, H., Xu, L., Jiang, Y., Guo, Z., He, W., Jiang, H., & Wang, J.
- Venue
- Acta Pharmaceutica Sinica B
- Publisher
- Elsevier BV
- Published
- 2022-02
- Volume
- 12
- Issue
- 2
- Pages
- 678-691
- ISSN
- 2211-3835
- PMC
- PMC8897035
- Cited by
- 67
- References
- 48
- Language
- en
- Licence
- www.elsevier.com/tdm/userlicense/1.0/ (tdm)
- www.elsevier.com/legal/tdmrep-license (tdm)
- creativecommons.org/licenses/by-nc-nd/4.0/ (vor)
About these checks
Registry, retraction, Cites and statistics results are computed, not judged, with one exception: a printed reference that no index lists is read once by a model before it counts as a citation error. Claims are extracted by a model and kept only when their quote appears verbatim in the text; each cited source is then checked, with a model’s help, for whether it says what the claim relies on. Those verdicts can be wrong — read the claim’s quote and the cited source before relying on one.
Statistics and arithmetic are recomputed, not judged.
Confidence bands are shown only for fields calibrated on our annotated test set. None is calibrated yet, so no band is shown.
What counts as a claim ›How we measure confidence ›How we check this ›
Are you an author, or do you see a problem with this page? Request a review
Data sources
Bibliographic data: Semantic Scholar, OpenAlex, Crossref.
Contains information from the Semantic Scholar Academic Graph Datasets, made available under the ODC Attribution License (ODC-BY 1.0).
Semantic Scholar’s data is described in: Kinney, R., et al. (2023). The Semantic Scholar Open Data Platform. arXiv:2301.10140.
