

The DOI matches its Crossref record; 111 of the 113 references it cites were found in a registry or an index; none of the 94 sources its claims cite is checked for support yet.
A Dynamic 6,000-Year Genetic History of Eurasia’s Eastern Steppe
Open accessPublished version of a preprint
Abstract
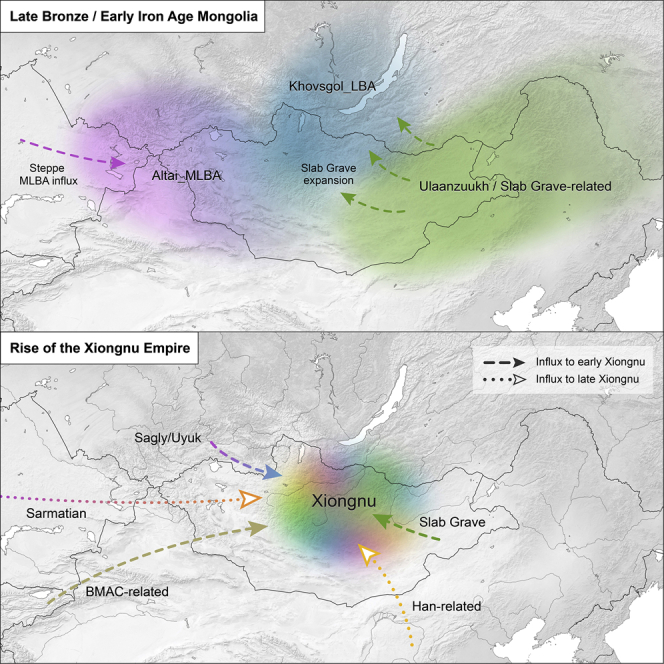
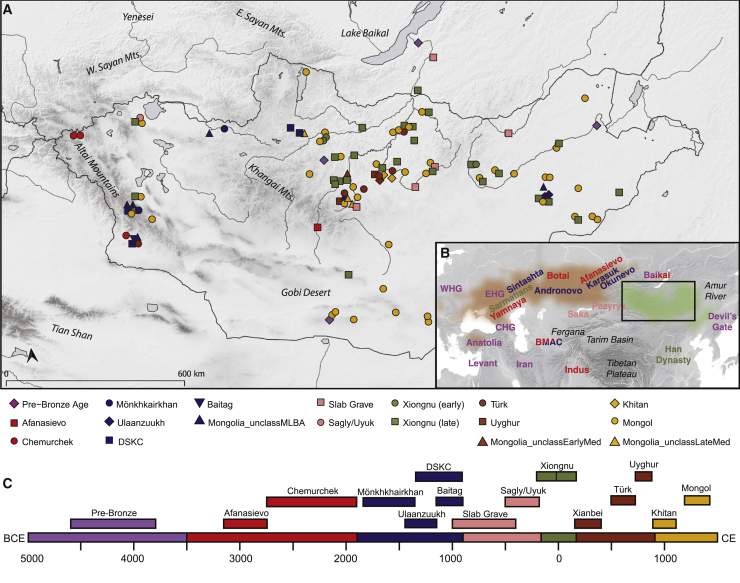
The Eastern Eurasian Steppe was home to historic empires of nomadic pastoralists, including the Xiongnu and the Mongols. However, little is known about the region's population history. Here, we reveal its dynamic genetic history by analyzing new genome-wide data for 214 ancient individuals spanning 6,000 years. We identify a pastoralist expansion into Mongolia ca. 3000 BCE, and by the Late Bronze Age, Mongolian populations were biogeographically structured into three distinct groups, all practicing dairy pastoralism regardless of ancestry. The Xiongnu emerged from the mixing of these populations and those from surrounding regions. By comparison, the Mongols exhibit much higher eastern Eurasian ancestry, resembling present-day Mongolic-speaking populations. Our results illuminate the complex interplay between genetic, sociopolitical, and cultural changes on the Eastern Steppe.
Overview
CoChat Summary
Written by AI from the paper’s full text.
TL;DR
This paper reports genome-wide data for 214 ancient individuals from Mongolia and neighboring Russia spanning ~6,000 years, revealing a dynamic population history of the Eastern Steppe. It documents a pastoralist expansion ca. 3000 BCE, a tripartite Bronze Age genetic structure, Xiongnu-era admixture, and a Mongol-period shift toward higher eastern Eurasian ancestry.
Key findings
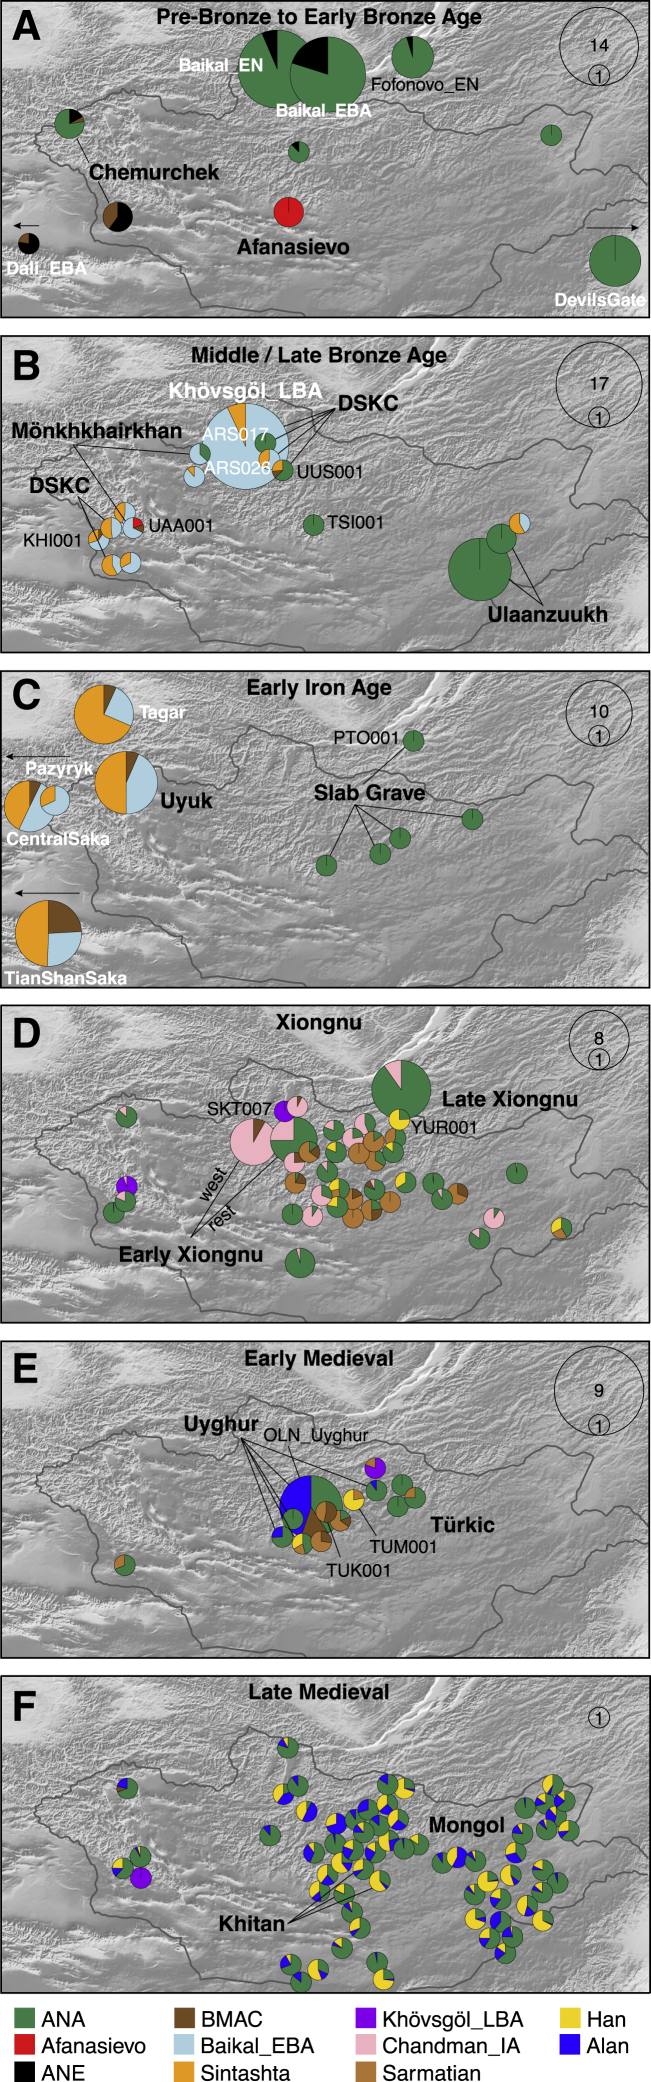
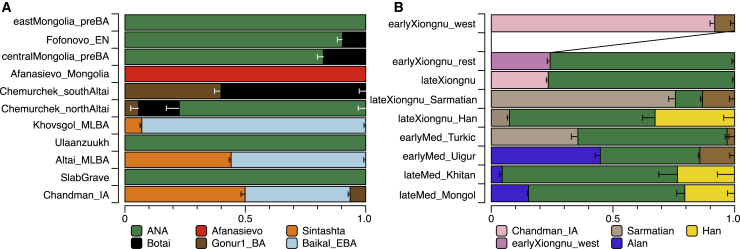
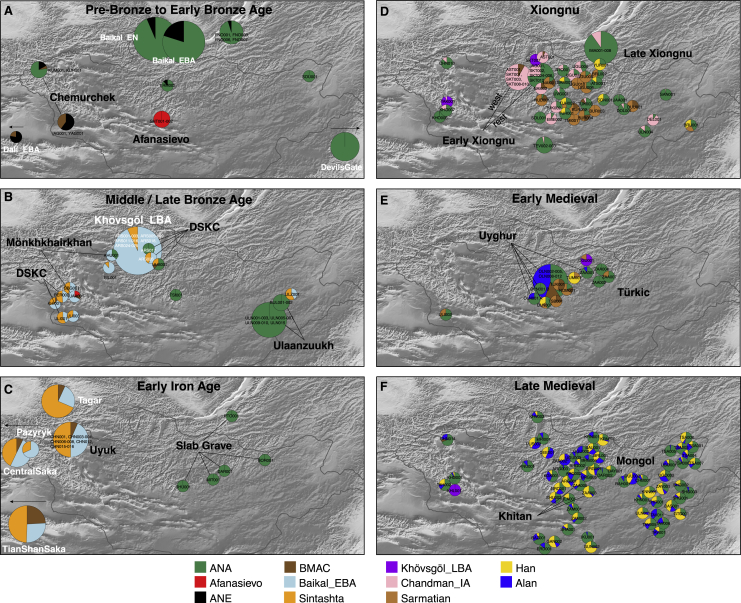
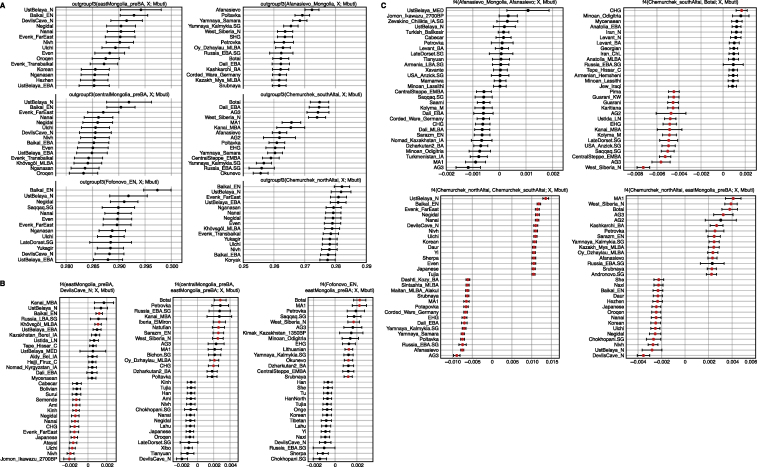
- Pre-Bronze Age hunter-gatherers carried Ancient Northeast Asian (ANA) ancestry; Afanasievo individuals in central Mongolia (3112–2917 cal. BCE) were genetically indistinguishable from Yenisei Afanasievo, confirming Western Steppe herder expansion ~1,500 km east, but Afanasievo and Chemurchek left little enduring genetic trace in later MLBA populations.
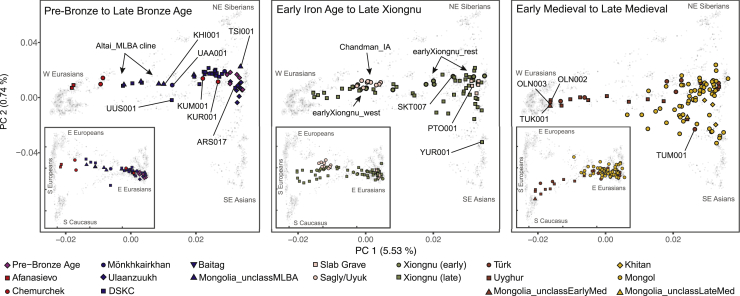
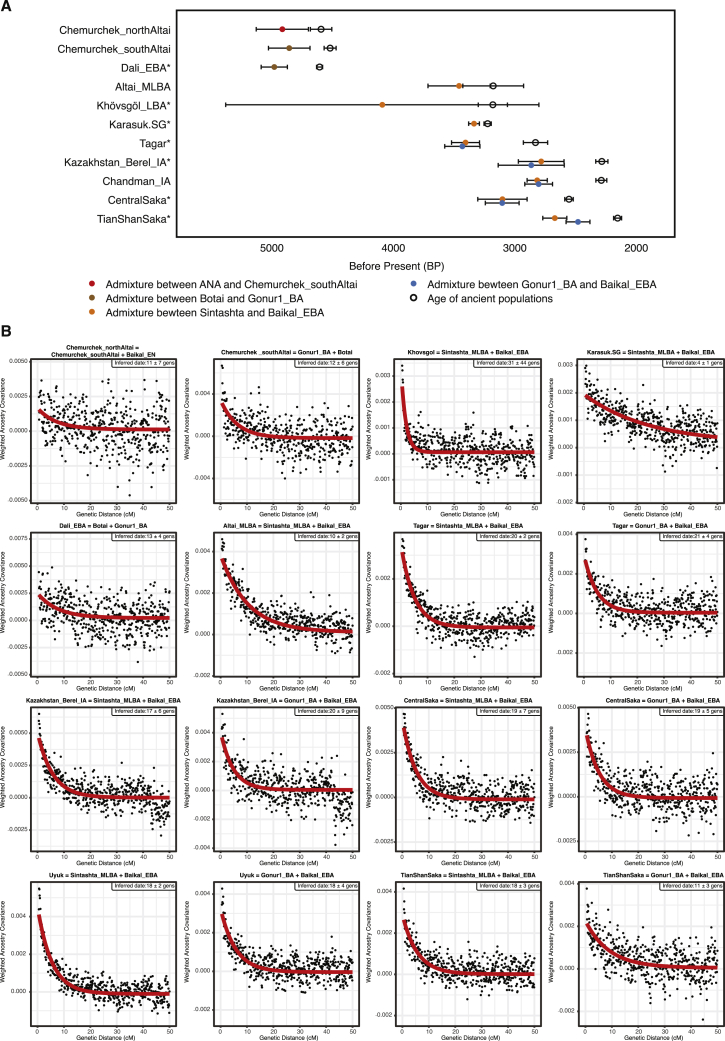
- By the Middle/Late Bronze Age (1900–900 BCE), Mongolia was biogeographically structured into three distinct gene pools: Khövsgöl_LBA, Altai_MLBA (admixed between Khövsgöl_LBA and Sintashta-related Western Steppe ancestry), and Ulaanzuukh_SlabGrave (ANA-related, lacking ANE and WSH admixture); all practiced dairy pastoralism regardless of ancestry.
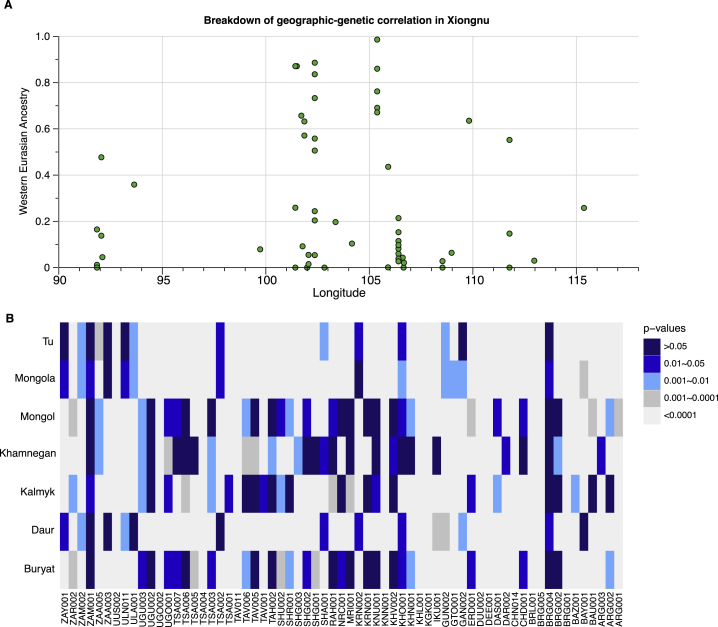
- The Xiongnu emerged from mixing these populations and surrounding regions: earlyXiongnu_west derived 92% ancestry from Chandman_IA with additional Iranian-related ancestry, while late Xiongnu showed added Sarmatian-related and Han-related gene flow and extreme genetic heterogeneity.
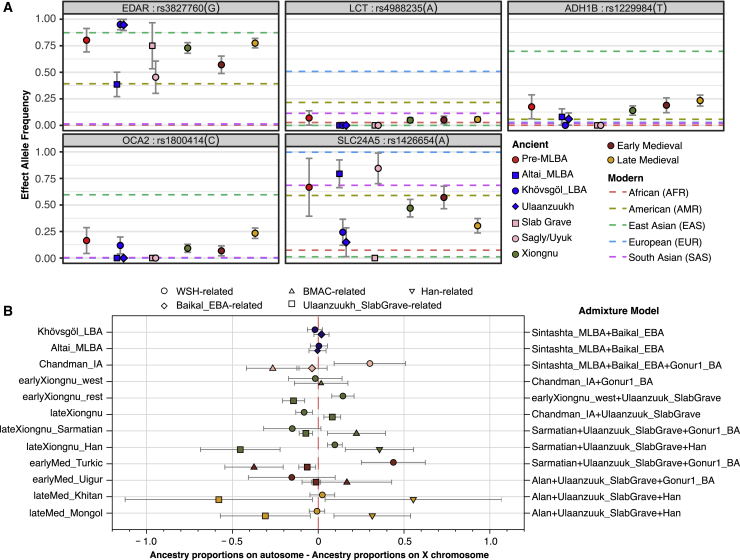
- Mongol-era individuals had much higher eastern Eurasian ancestry, modeled as 55%–64% Ulaanzuukh_SlabGrave, 21%–27% Han-related, and 15%–18% Western Steppe ancestry; 34 of 61 historic Mongols were genetically cladal with at least one modern Mongolic-speaking population, and lactase persistence remained at negligibly low frequency (~5%) despite widespread dairy consumption.
Methods
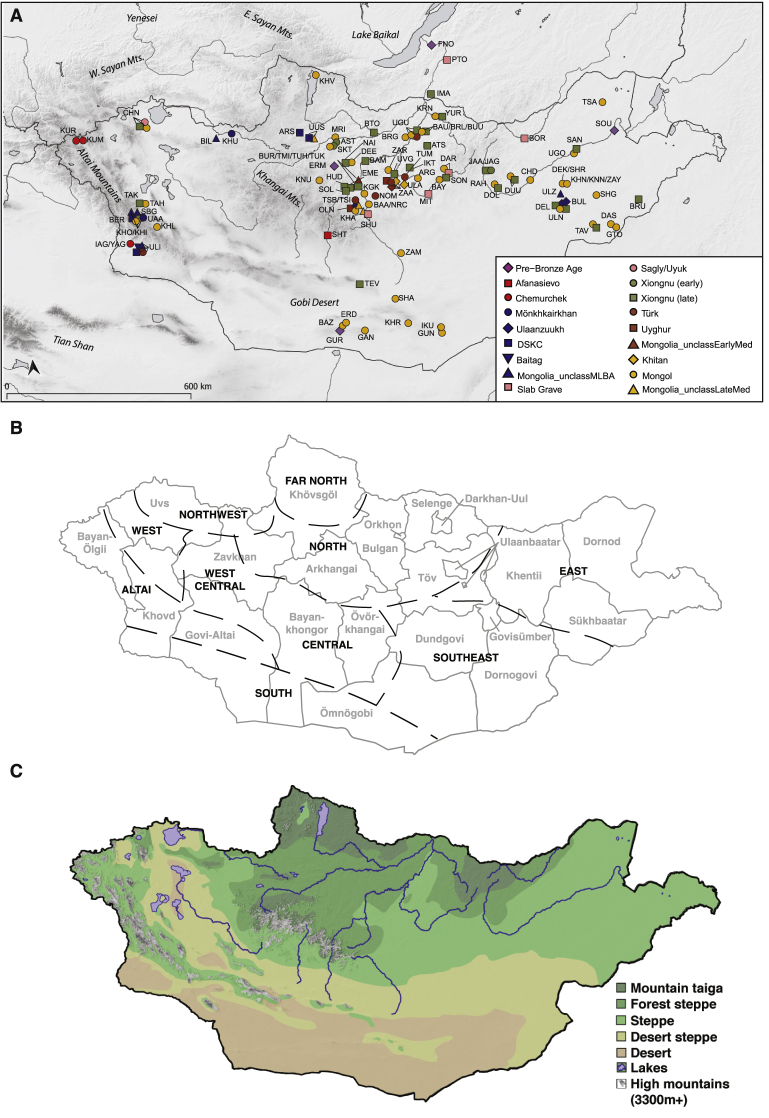
- New genome-wide data were generated for 214 ancient individuals from 85 Mongolian and 3 Russian sites, plus published data; 30 new AMS radiocarbon dates supplemented 74 previously published dates, totaling 98 directly dated individuals (104 dates).
- Sampling included 169 teeth and 75 petrosal bones from 225 individuals; 24 individuals were excluded for insufficient human DNA or <10,000 SNPs after capture, and 10 for >5% contamination or uncertain genetic sex; genetic sex was determined for 224 individuals (100 female, 124 male).
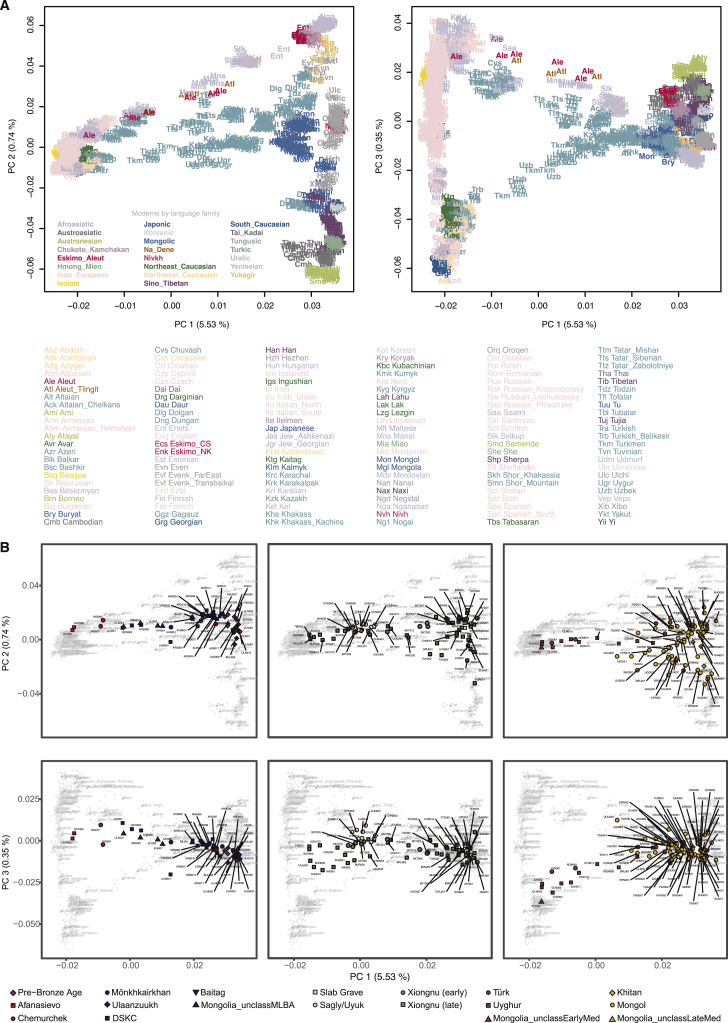
- Analyses included PCA projected onto 2,077 present-day Eurasians, outgroup f3 and f4 statistics, qpAdm/qpWave admixture modeling with eight outgroups, DATES admixture dating assuming 29 years per generation, uniparental haplogroup assignment, relatedness estimation, and allele-frequency estimation for five phenotypic SNPs.
Limitations
- The paper states that Early Medieval sampling is uneven (1 Xianbei/Rouran, 8 Türkic, 13 Uyghur individuals), Khitan representation is small (n = 3), and Mongol-era sampling excludes royal/regional elites and Karakorum; it also calls for further research in central and eastern Eurasia, northeastern China, the Tarim Basin, and the eastern Kazakh steppe.
- The paper states that some DATES admixture estimates should be interpreted with care because the method is designed for 2-way admixture but applied to 3-way models, and that Chemurchek source populations are distant in time or space; it also notes that ancient China, Korea, Japan, and Southeast Asia remain mostly unsampled.
- Evident from the text: nomadic camp sites are ephemeral and poorly preserved, knowledge of Mongolian prehistory is biased toward the past five millennia, radiocarbon dating reassigned many burials across periods, and sex-biased and kinship inferences are limited by sample size and context.
Model-written summary. Check it against the paper before relying on it.
Integrity signals
Registry
Cites
Statistics
Figures
Verification
Claims the paper makes
168 Own result · 56 Own interpretation · 27 Sources not found · 20 Not checked yet · 18 Check pending · 12 Own method · 4 No basis given · 3 No full text of the sources
A result the paper reports from its own data — it cites no other source for it, so there is none to check. The quote shows it is in the paper.
In the paper
“We identify a pastoralist expansion into Mongolia ca. 3000 BCE”
§ A Dynamic 6,000-Year Genetic History of Eurasia’s Eastern Steppe > Abstract
plainstates a causen = 214- Asserted: passes — The authors put it forward as true.
- Checkable: passes — It can be checked against evidence.
- Load-bearing: passes — The paper’s conclusions depend on it.
- Based: passes — The paper gives a reason why it holds.
A result the paper reports from its own data — it cites no other source for it, so there is none to check. The quote shows it is in the paper.
In the paper
“we found that they are most closely related to contemporaneous hunter-gatherers from the western Baikal region (“Baikal_EN,” 5200–4200 BCE) and the Russian Far East (“DevilsCave_N,” ca. 5700 BCE), filling in the geographic gap in the distribution of this genetic profile”
§ A Dynamic 6,000-Year Genetic History of Eurasia’s Eastern Steppe > Results > Pre-Bronze Age Population Structure and the Arrival of Pastoralism
plainstates an associationn = 6- Asserted: passes — The authors put it forward as true.
- Checkable: passes — It can be checked against evidence.
- Load-bearing: passes — The paper’s conclusions depend on it.
- Based: passes — The paper gives a reason why it holds.
A result the paper reports from its own data — it cites no other source for it, so there is none to check. The quote shows it is in the paper.
In the paper
“In Khovd province, individuals belonging to DSKC and unclassified MLBA groups (BER002 and SBG001, respectively) have a similar genetic profile that is best modeled as an equal mixture of Khövsgöl_LBA and Sintashta”
§ A Dynamic 6,000-Year Genetic History of Eurasia’s Eastern Steppe > Results > Bronze Age Emergence of a Tripartite Genetic Structure
plainstates an association- Asserted: passes — The authors put it forward as true.
- Checkable: passes — It can be checked against evidence.
- Load-bearing: passes — The paper’s conclusions depend on it.
- Based: passes — The paper gives a reason why it holds.
A result the paper reports from its own data — it cites no other source for it, so there is none to check. The quote shows it is in the paper.
In the paper
“The genetic profiles of both the Yagshiin Huduu and Dali_EBA individuals are well fitted by two-way admixture models with Botai (60%–78%) and groups with ancient Iranian-related ancestry, such as Gonur1_BA from Gonur Tepe, a key EBA site of the Bactria-Margiana Archaeological Complex (BMAC) (22%–40%; Figure 3A; Table S5B).”
§ A Dynamic 6,000-Year Genetic History of Eurasia’s Eastern Steppe > Results > Pre-Bronze Age Population Structure and the Arrival of Pastoralism
boostedstates an associationn = 2- Asserted: passes — The authors put it forward as true.
- Checkable: passes — It can be checked against evidence.
- Load-bearing: passes — The paper’s conclusions depend on it.
- Based: passes — The paper gives a reason why it holds.
- Rests on an assumption not shown here.
In the paper
“Analyzing two of these individuals (Afanasievo_Mongolia, 3112–2917 cal. BCE), we find that their genetic profiles are indistinguishable from that of published Afanasievo individuals from the Yenisei region”
§ A Dynamic 6,000-Year Genetic History of Eurasia’s Eastern Steppe > Results > Pre-Bronze Age Population Structure and the Arrival of Pastoralism
What the sources say
plainn = 2- Asserted: passes — The authors put it forward as true.
- Checkable: passes — It can be checked against evidence.
- Load-bearing: passes — The paper’s conclusions depend on it.
- Based: passes — The paper gives a reason why it holds.
- It may state two separate claims as one. 107
- The quote only partly states this claim. 2
- Probably not a substantial claim. 69
Create a free account to see these claims.
Create a free account to see these assumptions.
144 more claims
Create a free account to see all 308 claims and to verify the 40 references still open.
Claims other papers make about this one
Each is checked against this paper’s own text: does it say what the citing paper says it does?
In the citing paper
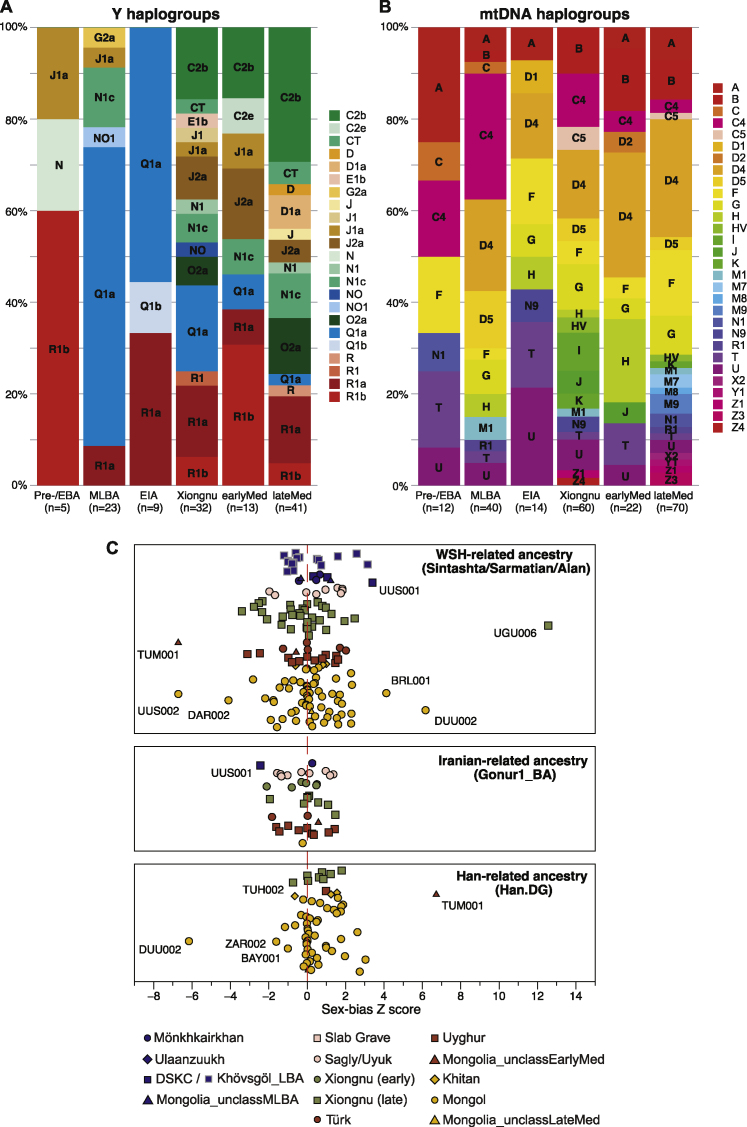
“The same dynamic characterizes the frequency of Q, which maintained dominance throughout the Early Bronze Age and Early Iron Age, but started to decline in the Late Iron Age (Hunnu period) and became minimal in the late medieval time periods.”
From Genomes of the Golden Horde elites and their implications for the rulers of the Mongol Empire (2026) · cites this paper as [19]
In the citing paper
“In contrast, the frequency of C2 increased during the same time scale and reached dominance in the late medieval period (19).”
From Genomes of the Golden Horde elites and their implications for the rulers of the Mongol Empire (2026) · cites this paper as [19]
In the citing paper
“Our analysis indicated ANE as the second genetic component of CKZ001, ZAA001, SHA001, and SHG003, although the latter three individuals were not inferred to have ANE ancestry when they were previously analyzed (19).”
From Genomes of the Golden Horde elites and their implications for the rulers of the Mongol Empire (2026) · cites this paper as [19]
In the citing paper
“This result indicated genetic continuity of some populations across various archaeological ages, despite the overall genetic heterogeneity observed in the Mongolian Plateau (19).”
From Genomes of the Golden Horde elites and their implications for the rulers of the Mongol Empire (2026) · cites this paper as [19]
In the citing paper
“In addition, CKZ002 also showed clade level genetic affinity with an individual from medieval Mongolia: MRI001 (19).”
From Genomes of the Golden Horde elites and their implications for the rulers of the Mongol Empire (2026) · cites this paper as [19]
11 more claims about this paper
Create a free account to see every claim other papers make about this one.
Self-check
Percentages, sums and reported differences re-computed from the paper’s own numbers.
Each contradiction between two passages listed here was confirmed by an independent check.
Rated minor: it would not touch a result — a value no result rests on, a p-value that stays on the same side of the significance level, or a conflict that is clerical, resolved elsewhere in the paper, or outside its own findings.
In the paper
§ A Dynamic 6,000-Year Genetic History of Eurasia’s Eastern Steppe > STAR★Methods > Method Details
“three burials originally assigned to the Middle/Late Bronze Age were determined to date to the Early Iron Age (DAR001), Xiongnu (ULN004), and Late Medieval (SHU001) periods”
§ A Dynamic 6,000-Year Genetic History of Eurasia’s Eastern Steppe > STAR★Methods > Quantification and Statistical Analysis
“four Slab Grave individuals (BOR001, DAR001, MIT001, SHU001) from eastern Mongolia”
Citations
Cites
Fast and accurate short read alignment with Burrows-Wheeler transform
Li, H., & Durbin, R. (2009) · Bioinformatics · doi:10.1093/bioinformatics/btp324 · Cited by 58,607
IntCal13 and Marine13 radiocarbon age calibration curves 0–50,000 years cal BP
Reimer, P. J., Bard, E., Bayliss, A., Beck, J. W., Blackwell, P. G., Ramsey, C. B., Buck, C. E., Cheng, H., Edwards, R. L., Friedrich, M., et al. (2013) · Radiocarbon · doi:10.2458/azu_js_rc.55.16947 · Cited by 14,591
Population Structure and Eigenanalysis
Patterson, N., Price, A. L., & Reich, D. (2006) · PLoS Genetics · doi:10.1371/journal.pgen.0020190 · Cited by 5,280
ANGSD: Analysis of Next Generation Sequencing Data
Korneliussen, T. S., Albrechtsen, A., & Nielsen, R. (2014) · BMC Bioinformatics · doi:10.1186/s12859-014-0356-4 · Cited by 2,982
Ancient Admixture in Human History
Patterson, N., Moorjani, P., Luo, Y., Mallick, S., Rohland, N., Zhan, Y., Genschoreck, T., Webster, T., & Reich, D. (2012) · Genetics · doi:10.1534/genetics.112.145037 · Cited by 2,848
Genome-wide detection and characterization of positive selection in human populations
The International HapMap Consortium, Sabeti, P. C., Varilly, P., Fry, B., Lohmueller, J., Hostetter, E., Cotsapas, C., Xie, X., Byrne, E. H., McCarroll, S. A., et al. (2007) · Nature · doi:10.1038/nature06250 · Cited by 2,131
AdapterRemoval v2: rapid adapter trimming, identification, and read merging
Schubert, M., Lindgreen, S., & Orlando, L. (2016) · BMC Research Notes · doi:10.1186/s13104-016-1900-2 · Cited by 2,091
Massive migration from the steppe was a source for Indo-European languages in Europe
Haak, W., Lazaridis, I., Patterson, N., Rohland, N., Mallick, S., Llamas, B., Brandt, G., Nordenfelt, S., Harney, E., Stewardson, K., et al. (2015) · Nature · doi:10.1038/nature14317 · Cited by 1,940
Self-citationmapDamage2.0: fast approximate Bayesian estimates of ancient DNA damage parameters
Jónsson, H., Ginolhac, A., Schubert, M., Johnson, P. L. F., & Orlando, L. (2013) · Bioinformatics · doi:10.1093/bioinformatics/btt193 · Cited by 1,669
The Simons Genome Diversity Project: 300 genomes from 142 diverse populations
Mallick, S., Li, H., Lipson, M., Mathieson, I., Gymrek, M., Racimo, F., Zhao, M., Chennagiri, N., Nordenfelt, S., Tandon, A., et al. (2016) · Nature · doi:10.1038/nature18964 · Cited by 1,584
Self-citation
Research works printed but not linked: 8
- Biran, 2012, Kitan migrations in Eurasia (10th–14th centuries), Journal of Central Eurasian Studies, 3, 85
- Dashtseveg, 2014, Bronze Age graves in the Delgerkhaan mountain area of eastern Mongolia and the Ulaanzuukh culture, Asian Archaeol, 2, 40
- Dorj, 1969, Dornod Mongoliin Neolitiin Ueiin Bulsh, Suutz, Erdem Shinjelgeenii Buteeliin Emkhegtel, 1, 59
- Erdenebat, 2012, Arkhangai aimagiin Khotont sum nutag Olon Dovd 2011 ond yavuulsan arkheologiin sudalgaa, Arkheologiin Sudlal, 32, 229
- Kovalev, 2009, Discovery of new cultures of the Bronze Age in Mongolia according to the data obtained by the International Central Asian Archaeological Expedition, Current Archaeological Research in Mongolia, 4, 149
- 2015, Mengguguo Bu’ergan sheng Daxinqileng sumu Zhanheshuo yizhi fajue jianbao [Brief report of excavations of remains at Zaan Khoshuu, Dashinchilin sum, Bulgan aimag, Mongolia], Caoyuan Wenwu, 2, 8
- Nelson, 2009, A Gobi mortuary site through time: bioarchaeology at Baga Mongol, Baga Gazaryn Chuluu, Current Archaeological Research in Mongolia, 4, 565
- Tsybiktarov, 2003, Central Asia in the Bronze and Early Iron Ages: Problems of ethnocultural history of Mongolia and the Southern Transbaikal region in the middle second to early first millennia BC, Archaeol. Ethnol. Anthropol. Eurasia, 13, 80
Cited by
Items 201–300 of 331
Lv, X., Yu, Y., Ban, L., Du, P., Xiong, J., Chang, X., Zhang, B., Wang, B., Xu, Y., Wang, C., et al. (2026) · Scientific Reports · doi:10.1038/s41598-026-42242-3 · Cited by 1
Moon, H., Kim, D., Hiss, A. N., Lee, D.-N., Lee, J., Skourtanioti, E., Gnecchi‐Ruscone, G. A., Krause, J., Woo, E. J., & Jeong, C. (2026) · Science Advances · doi:10.1126/sciadv.ady8614 · Cited by 1
Self-citationDairy-millet synergy underpinned subsistence adaptation to Inner Asian mountains from 2900 BCE
Qiu, M., Yang, S., Abudu, A., Du, L., Yan, Z., Cao, H., Liu, P., Zhang, Z., Niyazi, A., Liu, J., et al. (2026) · Communications Earth & Environment · doi:10.1038/s43247-026-03487-y · Cited by 1
Adamov, D., Ponomarev, G., Larissa, D., Pocheshkhova, E., & Balanovska, E. V. (2026) · Nature anthropology · doi:10.70322/natanthropol.2026.10010 · Cited by 1
Wang, M., Duan, S., Sun, Q., Tang, R., Luo, L., Zhong, J., Sabitov, Z., Wei, L., Liu, C., Zhabagin, M. K., et al. (2026) · Advanced Science · doi:10.1002/advs.76320 · Cited by 1
Ancient genomes from Ladakh reveal 2800-year-old admixture between Tibetans and South Asians
Patterson, N. J., Mushrif‐Tripathy, V., Devers, Q., Qiu, L., Dolma, S., Soos, G., Mallick, S., Rohland, N., & Reich, D. (2026) · Science Advances · doi:10.1126/sciadv.aeb3636 · Cited by 1
Ancient Ritual Objects of the Oka Plateau (Eastern Sayan)
Tashak, V. I., Kharinskii, A. A., & Portniagin, M. (2021) · Teoriya i praktika arkheologicheskikh issledovaniy · doi:10.14258/tpai(2021)33(4).-08 · Cited by 1
Oh, C. S., Kim, M. J., Kim, Y., Min, S., Oh, K. T., Lee, S. D., & Shin, D. H. (2022) · Anatomy & Cell Biology · doi:10.5115/acb.22.178 · Cited by 1
Якутская ветвь игрек-хромосомы в составе гаплогруппы N-M2016
Адамов, Д. (2022) · Siberian Research · doi:10.33384/26587270.2022.08.02.01r · Cited by 1
Multi-disciplinary analysis of an elite Xiongnu tomb from Belkhin Am cemetery, Ulaanbaatar
Varga, G. I. B., Maár, K., Gînguță, A., Váradi, O. A., Kovács, B., Tihanyi, B., Maróti, Z., Makoldi, M., Gelegdorj, E., Батболд, Н., et al. (2022) · Ephemeris Hungarologica · doi:10.53644/eh.2022.2.101 · Cited by 1
Results of the Xiongnu and Uyghur settlement and ruins located in the Orkhon-Tamir valley
Lochin, I., Batsuuri, A., Ganbaatar, G., 木山, 克., Nakamura, D., Usuki, I., & Shoki, T. (2024) · Studia Archaeologica · doi:10.5564/sa.v44i1.3523 · Cited by 1
Mészáros, B., Türk, A., Mende, B. G., Gyuris, B., Heltai, B., & Szécsényi‐Nagy, A. (2024) · Archaeologiai Értesítő · doi:10.1556/0208.2024.00077 · Cited by 1
Palaeosiberian archaeolinguistics
Potter, B. A., & Vajda, E. J. (2025) · Oxford University Press eBooks · doi:10.1093/oxfordhb/9780192868350.013.21 · Cited by 1
Archaeolinguistics and the languages of hunter-gatherers
Evans, N. (2025) · Oxford University Press eBooks · doi:10.1093/oxfordhb/9780192868350.013.13 · Cited by 1
Transeurasian archaeolinguistics
Robbeets, M., Hudson, M. J., & Ning, C. (2025) · Oxford University Press eBooks · doi:10.1093/oxfordhb/9780192868350.013.20 · Cited by 1
Dunn, M. G. (2025) · Oxford University Press eBooks · doi:10.1093/oxfordhb/9780192868350.013.7 · Cited by 1
Burke, D., Raychaudhuri, J., Chuong, E. B., Taylor, W., & Layer, R. M. (2026) · PLoS Computational Biology · doi:10.1371/journal.pcbi.1013122 · Cited by 1
Self-citationPopulation genomics on the origin of lactase persistence in Europe and South AsiaPreprint
Satta, Y., & Takahata, N. (2020) · bioRxiv (Cold Spring Harbor Laboratory) · doi:10.1101/2020.06.30.179432 · Cited by 1
Szeifert, B. (2024) · Eötvös Loránd Tudományegyetem · doi:10.15476/elte.2023.159 · Cited by 1
Robbeets, M., & Hudson, M. J. (2025) · Oxford University Press eBooks · doi:10.1093/oxfordhb/9780192868350.002.0009 · Cited by 1
He, G., Su, H., Sun, Q., Tang, R., Yang, Q., Luo, L., Zhong, J., Sabitov, Z. M., Cheng, J., Bu, F., et al. (2025) · medRxiv · doi:10.1101/2025.08.26.25334450 · Cited by 1
Мотив четырехлистника и его вероятные истоки в народном орнаментальном искусстве саха
Тихонова, Е., & Тихонов, Д. (2021) · Siberian Research · doi:10.33384/26587270.2021.05.01.05r
The quatrefoil motif and its probable origins in Sakha folk ornamental art
Тихонова, Е., & Тихонов, Д. (2021) · Siberian Research · doi:10.33384/26587270.2021.05.01.11e
INTERNATIONAL ZOOM WEBINAR “DYNAMICS OF PEOPLES AND EMPIRES IN THE HISTORY OF INNER ASIA”
Gombozhapov, A. D., Nolev, E. V., & Александрович, Б. Б. (2021) · Bulletin of the Buryat Scientific Center of the Siberian Branch of the Russian Academy of Sciences · doi:10.31554/2222-9175-2021-42-160-165
Zhao, C., Xu, H., Mei, S., Lan, Q., Liu, Y., Fang, Y., & Zhu, B. (2021) · Gene Reports · doi:10.1016/j.genrep.2021.101373
Esin, Y. N., Magail, J., Gantulga, J.-O., & Yeruul-Erdene, C. (2021) · Федеральное государственное бюджетное учреждение науки Институт истории материальной культуры Российской академии наук eBooks · doi:10.31600/978-5-907298-22-4.600-620
A Unique Burial of the Fourth Millennium B.C.E. and the Earliest Burial Traditions in Mongolia
Reichert, S., Erdene-Ochir, N.-O., & Bemmann, J. (2022) · Asian perspectives · doi:10.1353/asi.2022.0015
Self-citationThe influence of climate and population structure on East Asian skeletal morphological variation
Cho, E. O. (2022) · MOspace Institutional Repository (University of Missouri) · doi:10.32469/10355/91560
OBSESSED WITH SCIENCE (TOWARD THE 85TH JUBILEE OF PROKOPY BATYUROVICH KONOVALOV)
Gombozhapov, A. D. (2022) · Bulletin of the Buryat Scientific Center of the Siberian Branch of the Russian Academy of Sciences · doi:10.31554/2222-9175-2022-48-180-182
Palaeogenetic study of human migrations around the Caspian Sea during protohistory
Guarino‐Vignon, P. (2022) · Bulletins et Mémoires de la Société d anthropologie de Paris · doi:10.4000/bmsap.10318
A Kárpát-medence történeti népességeinek kapcsolatai az újabb archeogenetikai eredmények tükrében
Tőrők, T. (2022) · A Magyarságkutató Intézet kiadványai · doi:10.53644/mki.ksz.2022.335
Szécsényi‐Nagy, A., Szeifert, B., Csáky, V., & Mende, B. G. (2021) · Magyar Tudomány · doi:10.1556/2065.182.2021.s1.14
Az Árpád-ház genetikai kutatásának eddigi és a jövőben várható eredményei
Neparáczki, E. (2022) · A Magyarságkutató Intézet kiadványai · doi:10.53644/mki.ksz.2022.243
A X-XI. századi Kárpát-medencei köznép anyai vonalainak jellemzése archeogenetikai módszerekkel
Maár, K., Varga, G. I. B., Kovács, B., Schütz, O., Tihanyi, B., Nyerki, E., Raskó, I., Pálfi, G., Maróti, Z., Neparáczki, E., et al. (2022) · A Magyarságkutató Intézet kiadványai · doi:10.53644/mkie.2021.281
Current and expected results of genetic research on the Árpád dynasty
Neparáczki, E. (2022) · Publications of the Institute for Hungarian Research · doi:10.53644/mki.kas.2022.259
Asia, Steppe, East: Bronze and Iron Age
Ma, J., & Wang, Y. (2023) · Elsevier eBooks · doi:10.1016/b978-0-323-90799-6.00265-2
Borbély, N., Dudás, D., Tapasztó, A., Dudás-Boda, E., Csáky, V., Szeifert, B., Mende, B. G., Egyed, B., Szécsényi‐Nagy, A., & Pamjav, H. (2023) · Research Square · doi:10.21203/rs.3.rs-3604738/v1
Population-Genetic History of China in the Context of the East Asian Population History
Konkov, A. S. (2023) · Oriental Courier · doi:10.18254/s268684310026641-3
Солодовников, К. Н., Dashkovskiy, P. K., Erdene, M., Нечвалода, А. И., Tur, S. S., & Kravchenko, G. G. (2023) · Nations and religions of the Eurasia · doi:10.14258/nreur(2023)3-06
Self-citationBorbély, N., Dudás, D., Tapasztó, A., Dudás-Boda, E., Csáky, V., Szeifert, B., Mende, B. G., Egyed, B., Szécsényi‐Nagy, A., & Pamjav, H. (2024) · Research Square · doi:10.21203/rs.3.rs-3604738/v2
Gene pool preservation across time and space In Mongolian-speaking Oirats
Balinova, N., Hudjashov, G., Pankratov, V., Pennarun, E., Reidla, M., Metspalu, E., Batyrov, V., Khomyakova, I. A., Reisberg, T., Parik, J., et al. (2024) · European Journal of Human Genetics · doi:10.1038/s41431-024-01588-w
Institute for Medieval Research (Hrsg.) (2024) · Medieval Worlds · doi:10.1553/medievalworlds_no20_2024
Results of the Archaeological studies “Ulziit Denzh” (2021-2023)
Nasan-Ochir, E.-O., Yadmaa, T., Amgalantugs, T., Dalantai, S., Ganbold, T., Begz, D., Myanganbuu, N., & Laikhan, G. (2024) · Studia Archaeologica · doi:10.5564/sa.v44i1.3517
Wang, Y., Xie, L., Wang, K., Jiang, Z., Feng, Y., Yu, Y., Chang, X., Meng, H., Xu, Y., Wu, Y.-S., et al. (2024) · Frontiers in Ecology and Evolution · doi:10.3389/fevo.2024.1349231
Self-citationZhang, X., Yu, H.-X., Sun, J., Li, H., Liu, K.-J., & Wei, L. (2024) · Annals of Human Biology · doi:10.1080/03014460.2024.2398610
Игоревна, Д. Т., Trofimov, A. O., & Владимировна, С. Л. (2024) · Scientific Research of the SCO Countries: Synergy and Integration · doi:10.34660/inf.2022.84.79.011
THE SPECIFICS OF THE FORMATION OF VOCATIONAL TRAINING OF PRIMARY SCHOOL TEACHERS IN CHINA
Huang, Y. (2024) · Scientific Research of the SCO Countries: Synergy and Integration · doi:10.34660/inf.2022.76.87.004
ANALYTICAL REVIEW OF EMERGENCY PROTECTION PROCESS FOR DIESEL FUEL HYDRAULIC TREATMENT
Федоров, А. В., Ospanov, K. K., & Nehamkin, V. G. (2024) · Scientific Research of the SCO Countries: Synergy and Integration · doi:10.34660/inf.2022.62.18.020
Викторовна, Ж. А. (2024) · Scientific Research of the SCO Countries: Synergy and Integration · doi:10.34660/inf.2022.16.34.007
Maár, K. (2024) · SZTE Repository of Dissertations (University of Szeged) · doi:10.14232/phd.12139
Lu, C., Du, L., Tan, B., Zheng, L., Zhang, Y., Zhang, W., Jiang, L., Tang, L., & An, C. (2025) · Archaeological Research in Asia · doi:10.1016/j.ara.2025.100596
Definitive genetic evidence links the Xiongnu and Huns: reshaping the narrative of nomadic empires
An, C. (2025) · Chinese Science Bulletin (Chinese Version) · doi:10.1360/csb-2025-0581
Correlation of Y-DNA Haplogroups and Language Families
Fehér, T., & Endre, N. (2025) · Sylwan · doi:10.59879/4ra1m
Wild yaks, domesticated yaks, and the emergence of transhumant pastoralism in the Mongolian Altai
Jacobson-Tepfer, E. (2025) · Archaeological Research in Asia · doi:10.1016/j.ara.2025.100642
Archaeolinguistics: Combining archaeology, genes, and language
Robbeets, M. (2025) · Oxford University Press eBooks · doi:10.1093/oxfordhb/9780192868350.013.1
Guo, J., Fan, Z., Yang, W., & Wang, C. (2025) · Oxford University Press eBooks · doi:10.1093/oxfordhb/9780192868350.013.24
Iversen, R., & Riede, F. (2025) · Oxford University Press eBooks · doi:10.1093/oxfordhb/9780192868350.013.35
(2025) · Oxford University Press eBooks · doi:10.1093/oxfordhb/9780192868350.002.0006
(2025) · Oxford University Press eBooks · doi:10.1093/oxfordhb/9780192868350.002.0011
Prehistoric language change in social context
Bakker, P. (2025) · Oxford University Press eBooks · doi:10.1093/oxfordhb/9780192868350.013.8
Robbeets, M., & Hudson, M. J. (2025) · Oxford University Press eBooks · doi:10.1093/oxfordhb/9780192868350.013.37
The relationship between genetics, language, and culture
Mace, R. H. (2025) · Oxford University Press eBooks · doi:10.1093/oxfordhb/9780192868350.013.12
Cultural reconstruction: How to infer the cultural environment of ancestral speakers
Epps, P. L., & Khanina, O. (2025) · Oxford University Press eBooks · doi:10.1093/oxfordhb/9780192868350.013.5
Evans, B. (2025) · Oxford University Press eBooks · doi:10.1093/oxfordhb/9780192868350.013.4
Archaeology and language change in the Bronze Age
Hudson, M. J., Bjørn, R., & Spengler, R. N. (2025) · Oxford University Press eBooks · doi:10.1093/oxfordhb/9780192868350.013.15
(2025) · Oxford University Press eBooks · doi:10.1093/oxfordhb/9780192868350.002.0004
(2025) · Oxford University Press eBooks · doi:10.1093/oxfordhb/9780192868350.002.0007
Archaeology and language dynamics in the medieval and early modern eras
Hudson, M. J., Harland, J. M., & Crowther, A. (2025) · Oxford University Press eBooks · doi:10.1093/oxfordhb/9780192868350.013.17
Nilo-Saharan archaeolinguistics
Dimmendaal, G. J., & Babiker, H. M. A. (2025) · Oxford University Press eBooks · doi:10.1093/oxfordhb/9780192868350.013.29
Farming and language dispersals consequent upon the oldest developments of food production
Bellwood, P. S. (2025) · Oxford University Press eBooks · doi:10.1093/oxfordhb/9780192868350.013.14
Barbieri, C., & Widmer, P. (2025) · Oxford University Press eBooks · doi:10.1093/oxfordhb/9780192868350.013.36
Ancient states and the rise of writing
Haicheng, W. (2025) · Oxford University Press eBooks · doi:10.1093/oxfordhb/9780192868350.013.16
Archaeolinguistics of language families and contact areas of Amazonia
van Gijn, R., Arias, L., & de Souza, J. G. (2025) · Oxford University Press eBooks · doi:10.1093/oxfordhb/9780192868350.013.34
Melting Mongolian ice reveals fragile artifacts that provide clues about how past people lived
Taylor, W. T. T. (2021) · The Conversation · doi:10.64628/aai.9xtqcr53c
Self-citationYang, S., Xiao, J., Mu, L. B., Li, C., Dai, S., Li, S., Cui, Y., & Xu, Y. (2025) · Proceedings of the Royal Society B Biological Sciences · doi:10.1098/rspb.2025.1705
Li, J., Nie, W., Cai, D., Zhang, Y., Zhou, H., & Li, J. (2025) · Archaeological and Anthropological Sciences · doi:10.1007/s12520-025-02323-2
Стамов, С., & Chobanov, T. (2025) · Годишник на Софийския университет "Св. Климент Охридски". Исторически факултет. · doi:10.60053/gsu.if.1.108.17-46
He, G., Wang, P., Chen, J., Liu, Y., Sun, Y., Hu, R., Duan, S., Sun, Q., Tang, R., Yang, J., et al. (2024) · Figshare · doi:10.6084/m9.figshare.26672748
Sun, Q., Wang, M., Lu, T., Duan, S., Liu, Y., Chen, J., Wang, Z., Sun, Y., Li, X., Wang, S., et al. (2024) · Figshare · doi:10.6084/m9.figshare.25357808
Sun, Q., Wang, M., Lu, T., Duan, S., Liu, Y., Chen, J., Wang, Z., Sun, Y., Li, X., Wang, S., et al. (2024) · Figshare · doi:10.6084/m9.figshare.25357988
He, G., Wang, P., Chen, J., Liu, Y., Sun, Y., Hu, R., Duan, S., Sun, Q., Tang, R., Yang, J., et al. (2024) · Figshare · doi:10.6084/m9.figshare.26672751
Myagmar, E., Солодовников, К. Н., Эрдэнэ, М., & Солодовников, К. Н. (2024) · SibFU Digital Repository (Siberian Federal University)
Archeogenetikai betekintés a Báthory és az Aba család genetikai örökségébe
Bence, K. (2026) · SZTE Repository of Dissertations (University of Szeged)
Qu, Y., Zhao, Z., Ning, C., Zhang, J., Li, T., Cai, D., & Zhao, D. W. (2025) · Archaeological and Anthropological Sciences · doi:10.1007/s12520-025-02369-2
Li, C., Li, J., Anaer, Gao, S., Xu, Y. Y., Ye, M., Cai, L., & Cui, Y. (2026) · American Journal of Biological Anthropology · doi:10.1002/ajpa.70196
Zhao, X., Zhang, D., Sun, B., Yang, S., Qi, Y., An, W., Li, C., Niyazi, A., Wang, K., & Cui, Y. (2026) · Genome biology · doi:10.1186/s13059-026-03943-0
Self-citationThe Appropriation of Grasslands by Early Herders
Miller, A. V. (2026) · Oxford University Press eBooks · doi:10.1093/9780197785973.003.0003
Self-citationPutting the Cart Before the Horse
Miller, A. V. (2026) · Oxford University Press eBooks · doi:10.1093/9780197785973.003.0004
Self-citationLandscapes of Foraging and Fishing
Miller, A. V. (2026) · Oxford University Press eBooks · doi:10.1093/9780197785973.003.0002
Self-citationLuo, L., Liu, Y., Liu, Y., Liu, Y., Zhong, J., Li, B., Wang, Z., Feng, Y., Luo, L., Yang, T., et al. (2026) · BMC Biology · doi:10.1186/s12915-026-02527-5
Archeogenetikai adatok a hunokról
Tőrők, T. (2025) · A Magyarságkutató Intézet kiadványai · doi:10.53644/mki.xihu.2025.8
Bioarchaeological contributions to the reconstruction of past societies on the Mongolian Steppe
Wolin, D., Bukhchuluun, D., Cameron, A., Munkhtur, U., & Amartuvshin, C. (2026) · Archaeological Research in Asia · doi:10.1016/j.ara.2026.100701
Chen, L., Zhang, B., Zhang, D., Gao, S., Li, C., Huang, X., & Cui, Y. (2026) · Journal of Archaeological Science Reports · doi:10.1016/j.jasrep.2026.105718
Özdemir, Y. C., Gyuris, B., Jakab, K., Szeniczey, T., Heltai, B., Megyes, M., Mende, B. G., Major, I., Серегин, Н. Н., Gorbunov, V. V., et al. (2026) · bioRxiv (Cold Spring Harbor Laboratory) · doi:10.64898/2026.03.24.713889
Genetic diversity of ancient and modern horses of Altai and adjacent territories
Kusliy, M. A. (2023) · theses.fr (ABES) · doi:10.70675/968eb4a6z2e82z48fezbd50z8ce8e9b875e5
Etude paléogénétique des migrations humaines autour de la mer Caspienne pendant la protohistoire.
Guarino‐Vignon, P. (2021) · theses.fr (ABES) · doi:10.70675/cdc11bb2zce21z4b4cz8a10z4cba8e8f2a5d
On the Edge of Empire: Paleogenomic Insights into Roman DaciaPreprint
Angelis, F. D., Ileana, B., Kassadjikova, K., Bolog, A. C., Timofan, A., Pearce, J. M. S., Gligor, M., Fehren‐Schmitz, L., & Amorim, C. E. G. (2026) · bioRxiv (Cold Spring Harbor Laboratory) · doi:10.64898/2026.04.18.719386
Ancient genomic profile of the Shatuo Turkic leader Li Keyong
Yu, Y., Zhu, X., Chang, X., Huang, Z., Du, P., Ren, X., Zhang, B., Wang, K., Wu, Y., Han, S., et al. (2026) · Journal of genetics and genomics/Journal of Genetics and Genomics · doi:10.1016/j.jgg.2026.04.015
Self-citationWang, Y., Zhang, L., Jiang, Y., Zhu, S., Liu, Y., Sun, Q., Yuan, D., Guo, M., Liang, J., Ou, L., et al. (2026) · Human Genetics · doi:10.1007/s00439-026-02835-4
Sun, C., Yu, Y., Xu, Y., Liang, Y., Wang, Z., Du, P., Chang, X., Zhang, B., Xiong, J., Wang, B., et al. (2026) · Journal of Archaeological Science Reports · doi:10.1016/j.jasrep.2026.105815
Metadata
- Authors
- Jeong, C., Wang, K., Wilkin, S., Taylor, W. T. T., Miller, B. K., Bemmann, J. H., Stahl, R., Chiovelli, C., Knolle, F., Ulziibayar, S., Khatanbaatar, D., Erdenebaatar, D., Erdenebat, U., Ochir, A., Ankhsanaa, G., Vanchigdash, C., Ochir, B., Munkhbayar, C., Tumen, D., Kovalev, A., Kradin, N., Bazarov, B. A., Miyagashev, D. A., Konovalov, P. B., Zhambaltarova, E., Miller, A. V., Haak, W., Schiffels, S., Krause, J., Boivin, N., Erdene, M., Hendy, J., & Warinner, C.
- Affiliations
- Seoul National University (KR)
- Max Planck Institute of Geoanthropology (DE)
- University of Colorado Boulder (US)
- University of Michigan (US)
- University of Bonn (DE)
- Mongolian Academy of Sciences (MN)
- Mongolian University of Science and Technology (MN)
- National University of Mongolia (MN)
- Russian Academy of Sciences (RU)
- East Siberian Academy of Culture and Arts (RU)
- Harvard University (US)
- Corresponding author
- Jeong, Choongwon
- Warinner, Christina
- ORCID
- Jeong, Choongwon
- Wang, Ke
- Wilkin, Shevan
- Taylor, William Timothy Treal
- Miller, Bryan K.
- Bemmann, Jan H.
- Stahl, Raphaela
- Ulziibayar, Sodnom
- Khatanbaatar, Dorjpurev
- Erdenebat, Ulambayar
- Munkhbayar, Chuluunbat
- Kovalev, Alexey
- Kradin, Nikolay
- Bazarov, Bilikto A.
- Miyagashev, Denis A.
- Zhambaltarova, Elena
- Miller, Alicia Ventresca
- Haak, Wolfgang
- Schiffels, Stephan
- Krause, Johannes
- Boivin, Nicole
- Hendy, Jessica
- Warinner, Christina
- Venue
- Cell
- Publisher
- Elsevier BV
- Published
- 2020-11
- Volume
- 183
- Issue
- 4
- Pages
- 890-904.e29
- ISSN
- 0092-8674 (ISSN-L)
- PMC
- PMC7664836
- OpenAlex
- W3094811729
- Cited by
- 328
- References
- 113
- Citations by year
- 2026: 59 · 2025: 88 · 2024: 51 · 2023: 28 · 2022: 48 · 2021: 48 · 2020: 6
- FWCI
- 15.68
- Type
- journal article
- Language
- en
- Open access
- hybrid
- doi.org
- Licence
- Locations
- Cell (publishedVersion, cc-by)
- bioRxiv (Cold Spring Harbor Laboratory) (submittedVersion, cc-by-nc-nd)
- PubMed (publishedVersion)
- PubMed Central (publishedVersion, cc-by)
- White Rose Research Online (University of Leeds, The University of Sheffield, University of York) (acceptedVersion)
- MPG.PuRe (Max Planck Society) (submittedVersion, other-oa)
- Griffith Research Online (submittedVersion, cc-by)
- Seoul National University Open Repository (Seoul National University) (submittedVersion)
- Cell
- Funders
- Deutsche Forschungsgemeinschaft (257731206, SFB 1167)
- Russian Foundation for Basic Research (18-59-94020)
- Ministry of Science, ICT and Future Planning (2020R1C1C1003879)
- Ministry of Education and Science of the Russian Federation
- National University of Mongolia
- Horizon 2020
- National Research Foundation of Korea
- Max-Planck-Gesellschaft
- Horizon 2020 Framework Programme
- European Research Council (804884-DAIRYCULTURES, 771234-PALEORIDER)
- National Science Foundation (BCS-1523264)
- Topics
- Life Sciences › Biochemistry, Genetics and Molecular Biology › Genetics › Forensic and Genetic Research
- Life Sciences › Biochemistry, Genetics and Molecular Biology › Genetics › Genetic diversity and population structure
- Social Sciences › Arts and Humanities › History › Eurasian Exchange Networks
- Keywords
- ancient population genetics, Xiongnu, Mongols, nomadic pastoralism, Mongolian population, population mixing, Bronze Age, Mongolian steppe
- MeSH terms
- Archaeology, Europe, Female, Gene Frequency, Gene Pool, Genetics, Population, Geography, Haplotypes, Humans, Male, Mongolia, Time Factors, Genome, Human, Genetic Heterogeneity, Principal Component Analysis, History, Ancient, Grassland
About these checks
Registry, retraction, Cites and statistics results are computed, not judged, with one exception: a printed reference that no index lists is read once by a model before it counts as a citation error. Claims are extracted by a model and kept only when their quote appears verbatim in the text; each cited source is then checked, with a model’s help, for whether it says what the claim relies on. Those verdicts can be wrong — read the claim’s quote and the cited source before relying on one.
A language model drew the claims from the paper on 2026-11-12, under version 3 of the claim definition (model deepseek-v4.1-flash, prompt extract-v3).
A second model labelled each claim on 2026-11-12 (model jev-1.13-20260917, definition revision gold-guideline-v0.2).
Statistics and arithmetic are recomputed, not judged.
Confidence bands are shown only for fields calibrated on our annotated test set. None is calibrated yet, so no band is shown.
What counts as a claim ›How we measure confidence ›How we check this ›
Are you an author, or do you see a problem with this page? Request a review
