

The DOI matches its Crossref record; 51 of the 52 references it cites were found in a registry or an index; none of the 11 sources its claims cite is checked for support yet.
Alzheimer’s Patient Microglia Exhibit Enhanced Aging and Unique Transcriptional Activation
Open accessPublished version of a preprint
Abstract
Damage-associated microglia (DAM) profiles observed in Alzheimer's disease (AD)-related mouse models reflect an activation state that could modulate AD risk or progression. To learn whether human AD microglia (HAM) display a similar profile, we develop a method for purifying cell types from frozen cerebrocortical tissues for RNA-seq analysis, allowing better transcriptome coverage than typical single-nucleus RNA-seq approaches. The HAM profile we observe bears little resemblance to the DAM profile. Instead, HAM display an enhanced human aging profile, in addition to other disease-related changes such as APOE upregulation. Analyses of whole-tissue RNA-seq and single-cell/nucleus RNA-seq datasets corroborate our findings and suggest that the lack of DAM response in human microglia occurs specifically in AD tissues, not other neurodegenerative settings. These results, which can be browsed at http://research-pub.gene.com/BrainMyeloidLandscape, provide a genome-wide picture of microglial activation in human AD and highlight considerable differences between mouse models and human disease.
Overview
AI snapshot
Written from the paper’s full text.
TL;DR
Human Alzheimer’s disease microglia (HAM) purified from frozen cortex show a transcriptional profile that is largely distinct from the mouse damage-associated microglia (DAM) profile, with a prominent enhanced aging signature and APOE upregulation. The HAM signature is validated across cortical regions and whole-tissue datasets, while DAM-like induction is stronger in multiple sclerosis lesions and human microglia xenotransplanted into 5xFAD mice than in AD microglia.
Key findings
- In sorted CD11b+ microglia from superior frontal gyrus, genome-wide differential expression identified 45 genes increased and 21 decreased in AD versus control; only APOE upregulation survived genome-wide correction (fold change = 4.1, adjusted p = 0.0004).
- The HAM profile bore little resemblance to mouse DAM: the mouse neurodegeneration-related/DAM module was only slightly increased in AD microglia (p = 0.045), and among more than 100 module genes only APOE was significantly increased.
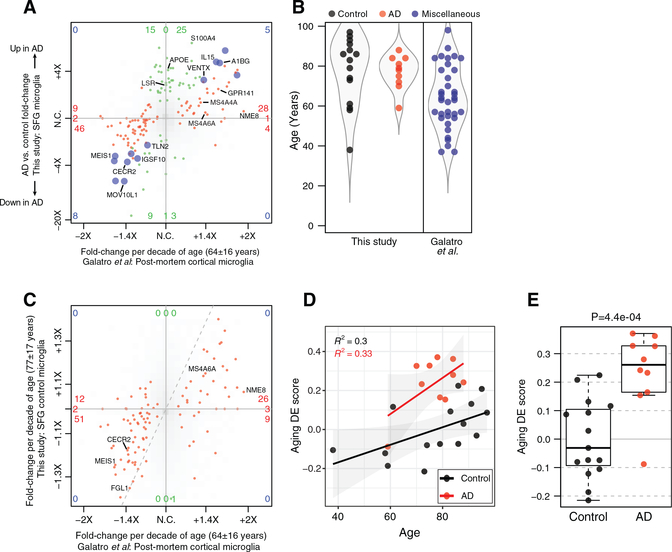
- AD microglia displayed an enhanced human aging phenotype: age-related DE scores were significantly higher in AD microglia than controls, with older-subject genes such as IL15, MS4A6A, MS4A4A, NME8, and GPR141 trending upward and CECR2 trending downward; this was not explained by age differences between groups.
- Validation in fusiform gyrus qRT-PCR replicated the direction of effect for nearly every DE gene tested (22 genes), and whole-tissue datasets (GSE95587, GSE125583, ROSMAP) showed significant elevation of the HAM-Up gene set, most apparent in later Braak stages. DAM induction was stronger in MS lesion microglia and human xenografted microglia in 5xFAD mouse brains than in AD microglia.
Methods
- The authors adapted a method for isolating cell types from frozen post-mortem human brain: brief Accutase treatment at 4°C, mechanical dissociation, ethanol fixation, immunolabeling, and FACS for NeuN+ neurons, GFAP+ astrocytes, CD31+ endothelial cells, and CD11b+ microglia/myeloid cells, followed by RNA-seq or qPCR.
- Frontal cortex (superior frontal gyrus) samples were processed from 22 AD and 21 control tissues; after QC, 113 cell-type-specific expression profiles were retained, including microglia profiles from 15 control and 10 AD subjects. Temporal cortex (fusiform gyrus) samples totaled 25 AD and 21 control tissues and were analyzed by qRT-PCR.
- Analyses included DESeq2 differential expression with Cook’s distance filtering, gene set scoring, myeloid balancing for whole-tissue datasets, and pseudobulk analysis of published single-cell/single-nucleus RNA-seq datasets from AD, MS, and xenotransplanted microglia.
Limitations
- The paper states that RNA quality after purification was poor, with Bioanalyzer RIN scores typically 1–3 due to freeze-thaw, fixation, and post-mortem tissue processing; alternative dissociation and fixation conditions were unsuccessful or counterproductive.
- The authors state that the sorted-cell approach does not afford single-cell resolution, and the SFG RNA-seq cohort was small (10 AD and 15 control microglia profiles). They also note that snRNA-seq datasets suffer from extensive gene dropout, making downregulated gene sets difficult to detect.
- The text makes evident additional limitations: APOE4 carrier status was imbalanced between AD and control groups (0 controls versus 9 AD subjects overall; 0 versus 6 among QC-passing myeloid profiles), and the new whole-tissue cohort had imperfect age matching, with AD cases on average about a half decade younger. The authors also present alternative interpretations for aging-related changes, including possible increased peripheral monocyte/macrophage infiltration versus microglial transcriptional modulation toward a monocyte-like state.
Model-written summary. Check it against the paper before relying on it.
Integrity signals
Registry
Cites
Statistics
Figures
Verification
Claims the paper makes
51 Own result · 28 Own method · 11 Own interpretation · 7 Not checked yet · 6 No basis given
A result the paper reports from its own data — it cites no other source for it, so there is none to check. The quote shows it is in the paper.
In the paper
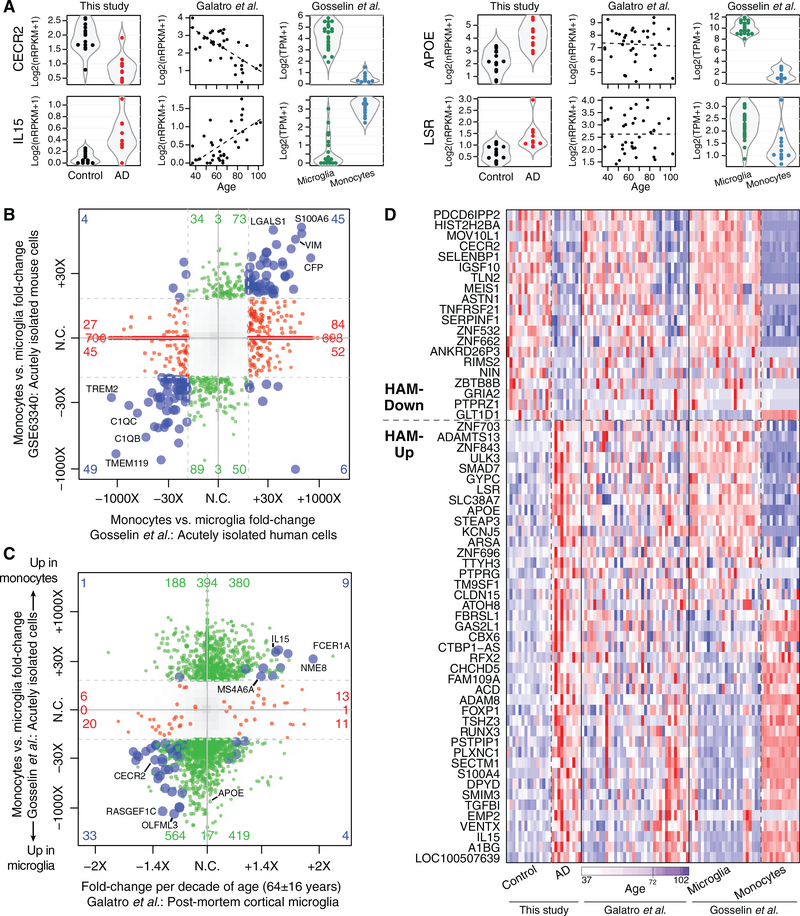
“we saw that most HAM genes exhibiting age-related DE in the Galatro et al. (2017) study showed corresponding expression changes in monocytes relative to microglia (Figure 6D).”
§ Alzheimer’s Patient Microglia Exhibit Enhanced Aging and Unique Transcriptional Activation > RESULTS > AD Microglia Display an Enhanced Human Aging Phenotype
plaincorrelational- Asserted: passes — The authors put it forward as true.
- Checkable: passes — It can be checked against evidence.
- Load-bearing: passes — The paper’s conclusions depend on it.
- Based: passes — The paper gives a reason why it holds.
A result the paper reports from its own data — it cites no other source for it, so there is none to check. The quote shows it is in the paper.
In the paper
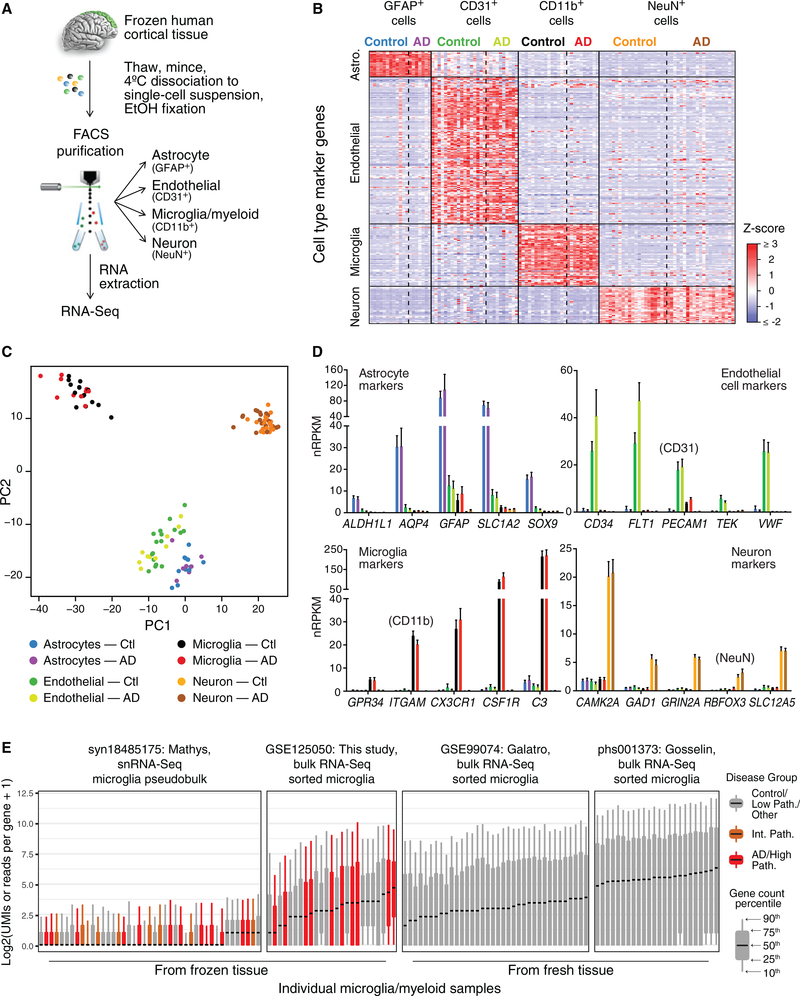
“we develop a method for purifying cell types from frozen cerebrocortical tissues for RNA-seq analysis, allowing better transcriptome coverage than typical single-nucleus RNA-seq approaches.”
- Also stated in: § Defining the HAM Gene Expression Profile Using Frozen Tissues · plain
“our bulk-sorted microglia profiles from frozen tissues displayed coverage of the transcriptome similar to that of bulk-sorted microglia from fresh post-mortem tissues (Galatro et al., 2017; Gosselin et al., 2017) and better coverage than snRNA-seq profiles”
§ Alzheimer’s Patient Microglia Exhibit Enhanced Aging and Unique Transcriptional Activation > Abstract
plaindirect- Asserted: passes — The authors put it forward as true.
- Checkable: passes — It can be checked against evidence.
- Load-bearing: passes — The paper’s conclusions depend on it.
- Based: passes — The paper gives a reason why it holds.
- Also stated in: § Defining the HAM Gene Expression Profile Using Frozen Tissues · plain
A result the paper reports from its own data — it cites no other source for it, so there is none to check. The quote shows it is in the paper.
In the paper
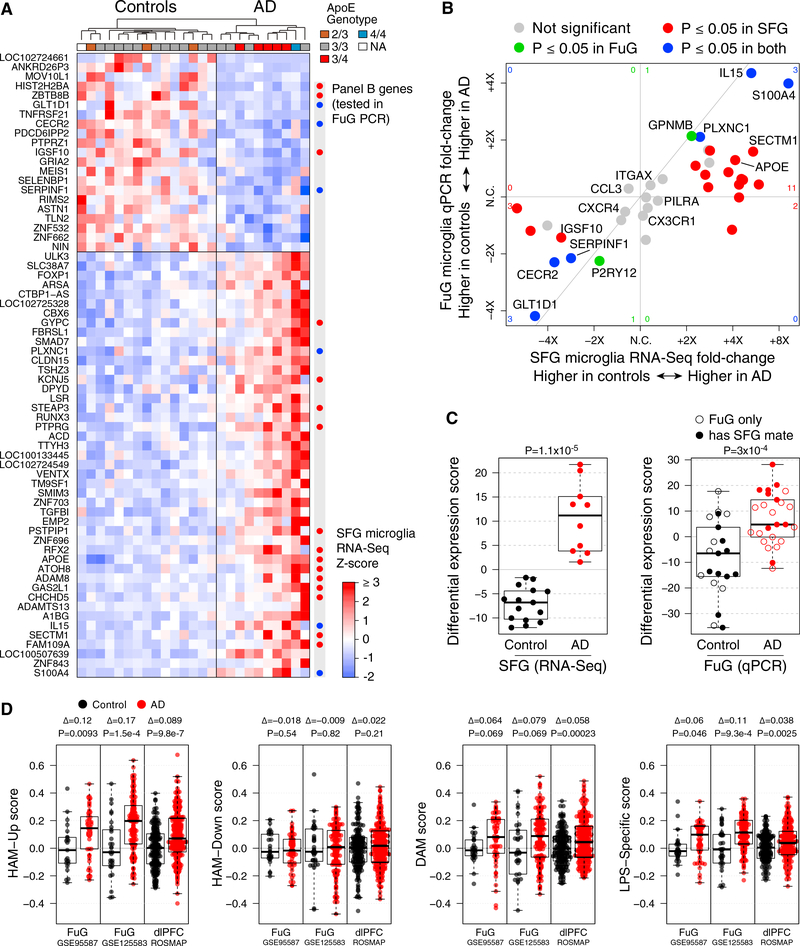
“We observed that the HAM-Up gene set was more robustly elevated in AD whole-tissue RNA than either of the mouse-derived gene sets (Figures 3D and S4C)”
§ Alzheimer’s Patient Microglia Exhibit Enhanced Aging and Unique Transcriptional Activation > RESULTS > Validation of the HAM Profile in Multiple Cortical Regions and Datasets
plaincorrelational- Asserted: passes — The authors put it forward as true.
- Checkable: passes — It can be checked against evidence.
- Load-bearing: passes — The paper’s conclusions depend on it.
- Based: passes — The paper gives a reason why it holds.
A result the paper reports from its own data — it cites no other source for it, so there is none to check. The quote shows it is in the paper.
In the paper
“we observed a clear tendency for genes whose expression changed with age in Galatro et al. (2017)’s dataset to show the same direction of age-related change among our control microglia samples (Figure 5C), validating our SFG RNA-seq profiles.”
§ Alzheimer’s Patient Microglia Exhibit Enhanced Aging and Unique Transcriptional Activation > RESULTS > AD Microglia Display an Enhanced Human Aging Phenotype
boostedcorrelationaln = 15- Asserted: passes — The authors put it forward as true.
- Checkable: passes — It can be checked against evidence.
- Load-bearing: passes — The paper’s conclusions depend on it.
- Based: passes — The paper gives a reason why it holds.
A result the paper reports from its own data — it cites no other source for it, so there is none to check. The quote shows it is in the paper.
In the paper
“For instance, GPNMB upregulation was robust in xMG and MS cells, but in AD microglia, it was meager or absent (Figure S7B).”
§ Alzheimer’s Patient Microglia Exhibit Enhanced Aging and Unique Transcriptional Activation > RESULTS > HAM, DAM, and Aging Comparisons in Human AD, Xenograft AD, and Human MS Tissues
plain- Asserted: passes — The authors put it forward as true.
- Checkable: passes — It can be checked against evidence.
- Load-bearing: passes — The paper’s conclusions depend on it.
- Based: passes — The paper gives a reason why it holds.
A result the paper reports from its own data — it cites no other source for it, so there is none to check. The quote shows it is in the paper.
In the paper
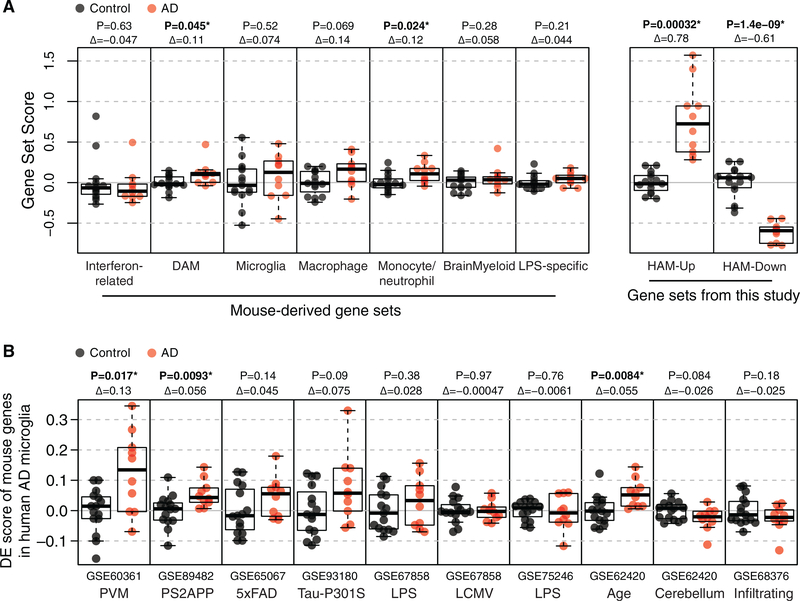
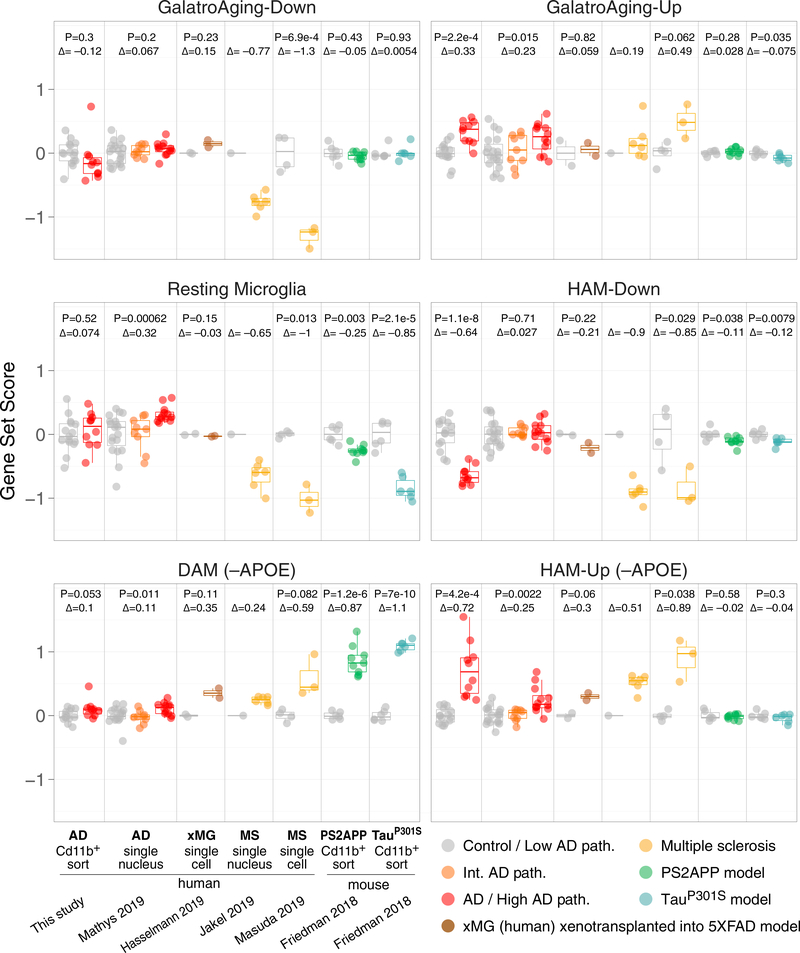
“The microglia and brain myeloid gene modules that define resting or homeostatic microglia and are downregulated in response to virtually any perturbation in mice (Friedman et al., 2018) showed no hint of downregulation in AD microglia (Figure 4A).”
§ Alzheimer’s Patient Microglia Exhibit Enhanced Aging and Unique Transcriptional Activation > RESULTS > The HAM Profile Is Unlike Known Mouse Microglial Activation States
plain- Asserted: passes — The authors put it forward as true.
- Checkable: passes — It can be checked against evidence.
- Load-bearing: passes — The paper’s conclusions depend on it.
- Based: passes — The paper gives a reason why it holds.
A result the paper reports from its own data — it cites no other source for it, so there is none to check. The quote shows it is in the paper.
In the paper
“Despite the different disease contexts of FuG and SFG tissues, the direction of effect for AD versus control across RNA samples from CD11b+ cells was replicated for nearly every DE gene tested (Figures 3B and S3B).”
§ Alzheimer’s Patient Microglia Exhibit Enhanced Aging and Unique Transcriptional Activation > RESULTS > Validation of the HAM Profile in Multiple Cortical Regions and Datasets
plaincorrelationaln = 21- Asserted: passes — The authors put it forward as true.
- Checkable: passes — It can be checked against evidence.
- Load-bearing: passes — The paper’s conclusions depend on it.
- Based: passes — The paper gives a reason why it holds.
A result the paper reports from its own data — it cites no other source for it, so there is none to check. The quote shows it is in the paper.
In the paper
“In our data, in addition to APOE, we found that the lipoprotein receptor LSR and the lysosomal enzyme ARSA—a gene in which homozygous mutations cause metachromatic leukodystrophy (Cesani et al., 2016)—were elevated in HAM.”
§ Alzheimer’s Patient Microglia Exhibit Enhanced Aging and Unique Transcriptional Activation > DISCUSSION
plain- Asserted: passes — The authors put it forward as true.
- Checkable: passes — It can be checked against evidence.
- Load-bearing: passes — The paper’s conclusions depend on it.
- Based: passes — The paper gives a reason why it holds.
A result the paper reports from its own data — it cites no other source for it, so there is none to check. The quote shows it is in the paper.
In the paper
“Second, the HAM signal was stronger than the DAM signal in snRNA-seq profiles from both AD tissues and MS lesions.”
§ Alzheimer’s Patient Microglia Exhibit Enhanced Aging and Unique Transcriptional Activation > DISCUSSION
plain- Asserted: passes — The authors put it forward as true.
- Checkable: passes — It can be checked against evidence.
- Load-bearing: passes — The paper’s conclusions depend on it.
- Based: passes — The paper gives a reason why it holds.
A result the paper reports from its own data — it cites no other source for it, so there is none to check. The quote shows it is in the paper.
In the paper
“induction of DAM genes was stronger in human xenotransplanted microglia (xMG) in 5xFAD mouse brains, and in microglia from MS lesions, than it was in AD microglia (Figure 7).”
§ Alzheimer’s Patient Microglia Exhibit Enhanced Aging and Unique Transcriptional Activation > RESULTS > HAM, DAM, and Aging Comparisons in Human AD, Xenograft AD, and Human MS Tissues
plain- Asserted: passes — The authors put it forward as true.
- Checkable: passes — It can be checked against evidence.
- Load-bearing: passes — The paper’s conclusions depend on it.
- Based: passes — The paper gives a reason why it holds.
- It may state two separate claims as one. 32
- Probably not a substantial claim. 30
A result the paper reports from its own data — it cites no other source for it, so there is none to check. The quote shows it is in the paper.
In the paper
“Surprisingly, expression of the resting microglia module defined in mouse microglia was not reduced in microglia from AD tissues (it increased in the snRNA-seq dataset) or even in human xMG from 5xFAD mouse brains.”
§ Alzheimer’s Patient Microglia Exhibit Enhanced Aging and Unique Transcriptional Activation > RESULTS > HAM, DAM, and Aging Comparisons in Human AD, Xenograft AD, and Human MS Tissues
plain- Asserted: passes — The authors put it forward as true.
- Checkable: passes — It can be checked against evidence.
- Load-bearing: passes — The paper’s conclusions depend on it.
- Based: passes — The paper gives a reason why it holds.
It may state two separate claims as one.
A result the paper reports from its own data — it cites no other source for it, so there is none to check. The quote shows it is in the paper.
In the paper
“RNA was extracted using QIAGEN miRNeasy mini columns, yielding samples with RNA integrity (RIN) scores averaging 6.5.”
§ Alzheimer’s Patient Microglia Exhibit Enhanced Aging and Unique Transcriptional Activation > STAR★METHODS > METHOD DETAILS
plainn = 289- Asserted: passes — The authors put it forward as true.
- Checkable: passes — It can be checked against evidence.
- Load-bearing: fails — The paper’s conclusions may not depend on it.
- Based: passes — The paper gives a reason why it holds.
Probably not a substantial claim. The paper’s conclusions may not depend on it.
A result the paper reports from its own data — it cites no other source for it, so there is none to check. The quote shows it is in the paper.
In the paper
“The mouse microglia aging profile, the PS2APP profile, and the PVM profile each showed statistically significant enrichment in AD versus control microglia (Figure 4B).”
§ Alzheimer’s Patient Microglia Exhibit Enhanced Aging and Unique Transcriptional Activation > RESULTS > The HAM Profile Is Unlike Known Mouse Microglial Activation States
plaincorrelational- Asserted: passes — The authors put it forward as true.
- Checkable: passes — It can be checked against evidence.
- Load-bearing: passes — The paper’s conclusions depend on it.
- Based: passes — The paper gives a reason why it holds.
It may state two separate claims as one.
The paper states this without a source or data behind it here, so there is nothing to check it against. The quote shows it is in the paper.
In the paper
“A notable caveat of our method is the low quality of the RNA after its purification from the collected cell types because of unavoidable aspects of preparing fixed cell suspensions from frozen and thawed post-mortem tissue samples.”
§ Alzheimer’s Patient Microglia Exhibit Enhanced Aging and Unique Transcriptional Activation > INTRODUCTION
plaindirect- Asserted: passes — The authors put it forward as true.
- Checkable: passes — It can be checked against evidence.
- Load-bearing: fails — The paper’s conclusions may not depend on it.
- Based: passes — The paper gives a reason why it holds.
Probably not a substantial claim. The paper’s conclusions may not depend on it.
The paper states this without a source or data behind it here, so there is nothing to check it against. The quote shows it is in the paper.
In the paper
“Only brief dissociation at 4°C and fixation immediately thereafter permitted cell populations to suitably endure the subsequent immunolabeling and FACS procedures.”
§ Alzheimer’s Patient Microglia Exhibit Enhanced Aging and Unique Transcriptional Activation > RESULTS > Defining the HAM Gene Expression Profile Using Frozen Tissues
plaindirect- Asserted: passes — The authors put it forward as true.
- Checkable: passes — It can be checked against evidence.
- Load-bearing: passes — The paper’s conclusions depend on it.
- Based: passes — The paper gives a reason why it holds.
Probably not a substantial claim.
A result the paper reports from its own data — it cites no other source for it, so there is none to check. The quote shows it is in the paper.
In the paper
“Third, we did not observe instances of DAM+ nuclei clustering separately from HAM+ nuclei in the snRNA-seq datasets; instead, these datasets revealed that to whatever extent the DAM signal was induced, it occurred in the same nuclei in which the HAM signal was detected (see Data S4, panel 2).”
§ Alzheimer’s Patient Microglia Exhibit Enhanced Aging and Unique Transcriptional Activation > DISCUSSION
plain- Asserted: passes — The authors put it forward as true.
- Checkable: passes — It can be checked against evidence.
- Load-bearing: passes — The paper’s conclusions depend on it.
- Based: passes — The paper gives a reason why it holds.
It may state two separate claims as one.
A result the paper reports from its own data — it cites no other source for it, so there is none to check. The quote shows it is in the paper.
In the paper
“However, of more than 100 genes in the module, only APOE was significantly increased in SFG microglia from AD patients (fold change = 4.1, p = 0.0004), and most other genes showed no clear trends in either direction (Figure S5A; Table S1).”
§ Alzheimer’s Patient Microglia Exhibit Enhanced Aging and Unique Transcriptional Activation > RESULTS > The HAM Profile Is Unlike Known Mouse Microglial Activation States
plain- Asserted: passes — The authors put it forward as true.
- Checkable: passes — It can be checked against evidence.
- Load-bearing: passes — The paper’s conclusions depend on it.
- Based: passes — The paper gives a reason why it holds.
It may state two separate claims as one.
None of the sources cited for this claim have been checked yet.
In the paper
“Just as DAM genes induced in neurodegenerative mouse models overlap with those induced by natural aging (Friedman et al., 2018; Holtman et al., 2015), so do many HAM genes induced in human AD tissues (Figure 5A), though the genes involved are distinct between species (Galatro etal.,2017).”
§ Alzheimer’s Patient Microglia Exhibit Enhanced Aging and Unique Transcriptional Activation > DISCUSSION
What the sources say
plaincorrelational- Asserted: passes — The authors put it forward as true.
- Checkable: passes — It can be checked against evidence.
- Load-bearing: passes — The paper’s conclusions depend on it.
- Based: passes — The paper gives a reason why it holds.
It may state two separate claims as one.
A result the paper reports from its own data — it cites no other source for it, so there is none to check. The quote shows it is in the paper.
In the paper
“In contrast, human xMG from 5xFAD mouse brains displayed similar extents of induction for HAM-Up and DAM gene sets, although no changes were observed in the Aging-Up and Aging-Down gene sets (Figure 7).”
§ Alzheimer’s Patient Microglia Exhibit Enhanced Aging and Unique Transcriptional Activation > RESULTS > HAM, DAM, and Aging Comparisons in Human AD, Xenograft AD, and Human MS Tissues
plain- Asserted: passes — The authors put it forward as true.
- Checkable: passes — It can be checked against evidence.
- Load-bearing: passes — The paper’s conclusions depend on it.
- Based: passes — The paper gives a reason why it holds.
It may state two separate claims as one.
A result the paper reports from its own data — it cites no other source for it, so there is none to check. The quote shows it is in the paper.
In the paper
“In all three whole-tissue datasets, the HAM-Up gene set was significantly increased (Figure 3D); this was most apparent in later Braak stages, which also showed decreased expression of our HAM-Down gene set (Figure S4C).”
§ Alzheimer’s Patient Microglia Exhibit Enhanced Aging and Unique Transcriptional Activation > RESULTS > Validation of the HAM Profile in Multiple Cortical Regions and Datasets
plaincorrelational- Asserted: passes — The authors put it forward as true.
- Checkable: passes — It can be checked against evidence.
- Load-bearing: passes — The paper’s conclusions depend on it.
- Based: passes — The paper gives a reason why it holds.
It may state two separate claims as one.
A result the paper reports from its own data — it cites no other source for it, so there is none to check. The quote shows it is in the paper.
In the paper
“Using these 22 genes to assign a DE score to each sample revealed a clear difference in FuG microglia between AD and control groups, reproducing the signal observed in the SFG RNA-seq data (Figure 3C).”
§ Alzheimer’s Patient Microglia Exhibit Enhanced Aging and Unique Transcriptional Activation > RESULTS > Validation of the HAM Profile in Multiple Cortical Regions and Datasets
boostedcorrelationaln = 21- Asserted: passes — The authors put it forward as true.
- Checkable: passes — It can be checked against evidence.
- Load-bearing: passes — The paper’s conclusions depend on it.
- Based: passes — The paper gives a reason why it holds.
It may state two separate claims as one.
A result the paper reports from its own data — it cites no other source for it, so there is none to check. The quote shows it is in the paper.
In the paper
“None of these attempts were as good as the method described above in terms of cell yield and RNA recovery.”
§ Alzheimer’s Patient Microglia Exhibit Enhanced Aging and Unique Transcriptional Activation > STAR★METHODS > METHOD DETAILS
plain- Asserted: passes — The authors put it forward as true.
- Checkable: passes — It can be checked against evidence.
- Load-bearing: fails — The paper’s conclusions may not depend on it.
- Based: passes — The paper gives a reason why it holds.
Probably not a substantial claim. The paper’s conclusions may not depend on it.
The paper states this without a source or data behind it here, so there is nothing to check it against. The quote shows it is in the paper.
In the paper
“As a point of reference, sorted mouse microglia from the PS2APP and Tau-P301S models showed strong DAM induction and no changes in the HAM-Up gene set.”
§ Alzheimer’s Patient Microglia Exhibit Enhanced Aging and Unique Transcriptional Activation > RESULTS > HAM, DAM, and Aging Comparisons in Human AD, Xenograft AD, and Human MS Tissues
boosted- Asserted: passes — The authors put it forward as true.
- Checkable: passes — It can be checked against evidence.
- Load-bearing: unclear — It is unclear whether the paper’s conclusions depend on it.
- Based: passes — The paper gives a reason why it holds.
It may state two separate claims as one.
A result the paper reports from its own data — it cites no other source for it, so there is none to check. The quote shows it is in the paper.
In the paper
“RIN scores for all cell types were typically between 1 and 3.”
§ Alzheimer’s Patient Microglia Exhibit Enhanced Aging and Unique Transcriptional Activation > STAR★METHODS > METHOD DETAILS
plain- Asserted: passes — The authors put it forward as true.
- Checkable: passes — It can be checked against evidence.
- Load-bearing: fails — The paper’s conclusions may not depend on it.
- Based: passes — The paper gives a reason why it holds.
Probably not a substantial claim. The paper’s conclusions may not depend on it.
None of the sources cited for this claim have been checked yet.
In the paper
“Most genes with higher expression in microglia from older subjects, including IL15 and the candidate AD risk genes MS4A6A, MS4A4A, NME8, and GPR141, trended toward elevated expression in AD relative to control microglia; conversely, genes with lower expression in microglia from older subjects, like CECR2, tended to be reduced in AD microglia (Figures 5A and 6A).”
§ Alzheimer’s Patient Microglia Exhibit Enhanced Aging and Unique Transcriptional Activation > RESULTS > AD Microglia Display an Enhanced Human Aging Phenotype
plaincorrelational- Asserted: passes — The authors put it forward as true.
- Checkable: passes — It can be checked against evidence.
- Load-bearing: passes — The paper’s conclusions depend on it.
- Based: passes — The paper gives a reason why it holds.
It may state two separate claims as one.
A result the paper reports from its own data — it cites no other source for it, so there is none to check. The quote shows it is in the paper.
In the paper
“These samples, which came from new fusiform gyrus tissue blocks, showed very similar sample-by-sample DE profiles as the corresponding samples from the same subjects in GSE95587 (Figure S4A)”
§ Alzheimer’s Patient Microglia Exhibit Enhanced Aging and Unique Transcriptional Activation > STAR★METHODS > METHOD DETAILS
plainn = 89- Asserted: passes — The authors put it forward as true.
- Checkable: passes — It can be checked against evidence.
- Load-bearing: fails — The paper’s conclusions may not depend on it.
- Based: passes — The paper gives a reason why it holds.
Probably not a substantial claim. The paper’s conclusions may not depend on it.
A result the paper reports from its own data — it cites no other source for it, so there is none to check. The quote shows it is in the paper.
In the paper
“All components of the HAM profile—elevated HAM-Up and Aging-Up scores and reduced HAM-Down and Aging-Down scores— were clearly represented in microglia from MS lesions, usually with larger effect sizes and lower p values than the DAM scores in the same cells (Figure 7).”
§ Alzheimer’s Patient Microglia Exhibit Enhanced Aging and Unique Transcriptional Activation > RESULTS > HAM, DAM, and Aging Comparisons in Human AD, Xenograft AD, and Human MS Tissues
boostedcorrelational- Asserted: passes — The authors put it forward as true.
- Checkable: passes — It can be checked against evidence.
- Load-bearing: unclear — It is unclear whether the paper’s conclusions depend on it.
- Based: passes — The paper gives a reason why it holds.
It may state two separate claims as one.
A result the paper reports from its own data — it cites no other source for it, so there is none to check. The quote shows it is in the paper.
In the paper
“Of 289 total samples, 89 were from subjects that had already been profiled in our previous study, GSE95587.”
§ Alzheimer’s Patient Microglia Exhibit Enhanced Aging and Unique Transcriptional Activation > STAR★METHODS > METHOD DETAILS
plainn = 89- Asserted: passes — The authors put it forward as true.
- Checkable: passes — It can be checked against evidence.
- Load-bearing: fails — The paper’s conclusions may not depend on it.
- Based: passes — The paper gives a reason why it holds.
Probably not a substantial claim. The paper’s conclusions may not depend on it.
The paper states this without a source or data behind it here, so there is nothing to check it against. The quote shows it is in the paper.
In the paper
“Although the fixation adversely affects RNA integrity (RIN), it also permeabilizes the cells and enables labeling of intracellular markers for sorting.”
§ Alzheimer’s Patient Microglia Exhibit Enhanced Aging and Unique Transcriptional Activation > RESULTS > Defining the HAM Gene Expression Profile Using Frozen Tissues
plaindirect- Asserted: passes — The authors put it forward as true.
- Checkable: passes — It can be checked against evidence.
- Load-bearing: passes — The paper’s conclusions depend on it.
- Based: passes — The paper gives a reason why it holds.
It may state two separate claims as one.
A result the paper reports from its own data — it cites no other source for it, so there is none to check. The quote shows it is in the paper.
In the paper
“many genes with higher expression in younger subjects in Galatro et al. (2017)’s dataset, like CECR2, were microglia enriched in Gosselin et al. (2017)’s dataset; conversely, many genes with elevated expression in older subjects, like IL15, were monocyte enriched (Figures 6A and 6C).”
§ Alzheimer’s Patient Microglia Exhibit Enhanced Aging and Unique Transcriptional Activation > RESULTS > AD Microglia Display an Enhanced Human Aging Phenotype
plaincorrelational- Asserted: passes — The authors put it forward as true.
- Checkable: passes — It can be checked against evidence.
- Load-bearing: passes — The paper’s conclusions depend on it.
- Based: passes — The paper gives a reason why it holds.
It may state two separate claims as one.
A result the paper reports from its own data — it cites no other source for it, so there is none to check. The quote shows it is in the paper.
In the paper
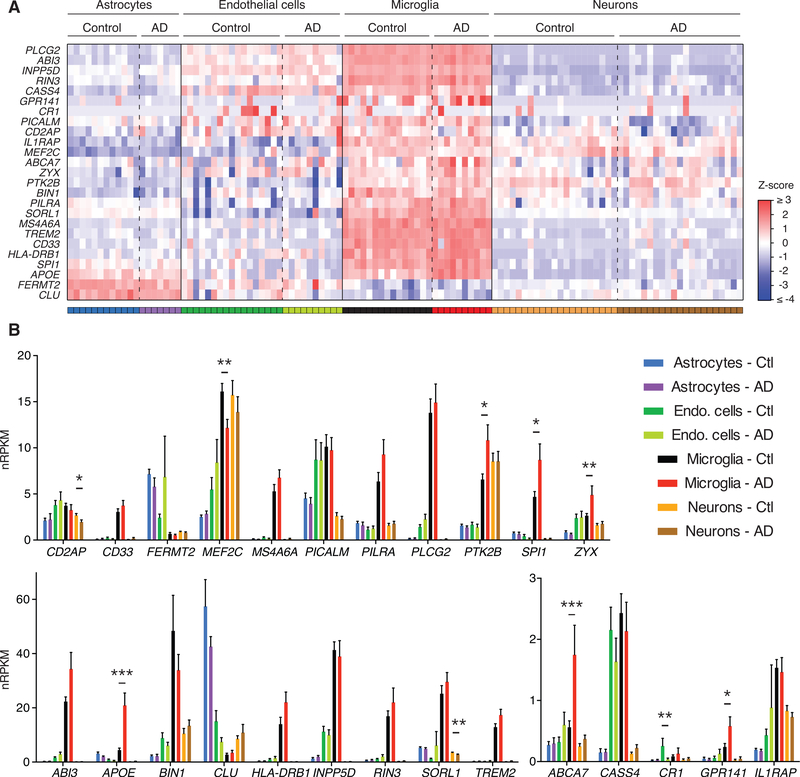
“we observed that APOE, ABCA7, GPR141, PTK2B, SPI1, and ZYX appeared upregulated in AD microglia, whereas MEF2C appeared downregulated (unadjusted p < 0.05) (Figure 2B).”
§ Alzheimer’s Patient Microglia Exhibit Enhanced Aging and Unique Transcriptional Activation > RESULTS > Defining the HAM Gene Expression Profile Using Frozen Tissues
hedgedcorrelational- Asserted: passes — The authors put it forward as true.
- Checkable: passes — It can be checked against evidence.
- Load-bearing: passes — The paper’s conclusions depend on it.
- Based: passes — The paper gives a reason why it holds.
It may state two separate claims as one.
A result the paper reports from its own data — it cites no other source for it, so there is none to check. The quote shows it is in the paper.
In the paper
“We included CD44 in our panel of genes tested by qPCR in FuG myeloid cell sorts, and it was again increased in the AD samples (unadjusted p = 0.041), so we consider its DE to be genuine”
§ Alzheimer’s Patient Microglia Exhibit Enhanced Aging and Unique Transcriptional Activation > STAR★METHODS > QUANTIFICATION AND STATISTICAL ANALYSIS
plaincorrelational- Asserted: passes — The authors put it forward as true.
- Checkable: passes — It can be checked against evidence.
- Load-bearing: unclear — It is unclear whether the paper’s conclusions depend on it.
- Based: passes — The paper gives a reason why it holds.
It may state two separate claims as one.
A result the paper reports from its own data — it cites no other source for it, so there is none to check. The quote shows it is in the paper.
In the paper
“Differential expression analysis (Data S4, panel 1) revealed that the expression of about 80 genes was significantly increased in microglia from subjects with larger post-mortem interval (PMI).”
§ Alzheimer’s Patient Microglia Exhibit Enhanced Aging and Unique Transcriptional Activation > STAR★METHODS > QUANTIFICATION AND STATISTICAL ANALYSIS
plaincorrelational- Asserted: passes — The authors put it forward as true.
- Checkable: passes — It can be checked against evidence.
- Load-bearing: fails — The paper’s conclusions may not depend on it.
- Based: passes — The paper gives a reason why it holds.
Probably not a substantial claim. The paper’s conclusions may not depend on it.
A result the paper reports from its own data — it cites no other source for it, so there is none to check. The quote shows it is in the paper.
In the paper
“We discarded 1/43 neuron libraries, 19/38 astrocyte libraries, 14/41 endothelial cell libraries, and 18/43 microglia libraries from original frozen tissues, and 16/16 microglia libraries from twice frozen tissues (which underscored the liabilities of the freeze-thaw process).”
§ Alzheimer’s Patient Microglia Exhibit Enhanced Aging and Unique Transcriptional Activation > STAR★METHODS > QUANTIFICATION AND STATISTICAL ANALYSIS
plain- Asserted: passes — The authors put it forward as true.
- Checkable: passes — It can be checked against evidence.
- Load-bearing: fails — The paper’s conclusions may not depend on it.
- Based: passes — The paper gives a reason why it holds.
Probably not a substantial claim. The paper’s conclusions may not depend on it. It may state two separate claims as one.
A result the paper reports from its own data — it cites no other source for it, so there is none to check. The quote shows it is in the paper.
In the paper
“The Cook’s distance filter eliminated 6/10 neuronal DE genes, 9/75 myeloid DE genes, and 382/517 endothelial DE genes from consideration, leaving 4 DE genes in neurons, 66 in myeloid cells, and 135 in endothelial cells.”
§ Alzheimer’s Patient Microglia Exhibit Enhanced Aging and Unique Transcriptional Activation > STAR★METHODS > QUANTIFICATION AND STATISTICAL ANALYSIS
plain- Asserted: passes — The authors put it forward as true.
- Checkable: passes — It can be checked against evidence.
- Load-bearing: passes — The paper’s conclusions depend on it.
- Based: passes — The paper gives a reason why it holds.
Probably not a substantial claim. It may state two separate claims as one.
A result the paper reports from its own data — it cites no other source for it, so there is none to check. The quote shows it is in the paper.
In the paper
“For APOE genotype, we only detected one DE gene, ACY3, in AD microglia between APOE-e4 carriers versus non-carriers.”
§ Alzheimer’s Patient Microglia Exhibit Enhanced Aging and Unique Transcriptional Activation > STAR★METHODS > QUANTIFICATION AND STATISTICAL ANALYSIS
plain- Asserted: passes — The authors put it forward as true.
- Checkable: passes — It can be checked against evidence.
- Load-bearing: fails — The paper’s conclusions may not depend on it.
- Based: passes — The paper gives a reason why it holds.
Probably not a substantial claim. The paper’s conclusions may not depend on it.
A result the paper reports from its own data — it cites no other source for it, so there is none to check. The quote shows it is in the paper.
In the paper
“Compared to”
§ Alzheimer’s Patient Microglia Exhibit Enhanced Aging and Unique Transcriptional Activation > STAR★METHODS > QUANTIFICATION AND STATISTICAL ANALYSIS
plaincorrelational- Asserted: passes — The authors put it forward as true.
- Checkable: passes — It can be checked against evidence.
- Load-bearing: fails — The paper’s conclusions may not depend on it.
- Based: passes — The paper gives a reason why it holds.
Probably not a substantial claim. The paper’s conclusions may not depend on it. It may state two separate claims as one.
The paper states this without a source or data behind it here, so there is nothing to check it against. The quote shows it is in the paper.
In the paper
“Given the highly fragmented condition of our sorted cell RNA preps”
§ Alzheimer’s Patient Microglia Exhibit Enhanced Aging and Unique Transcriptional Activation > STAR★METHODS > METHOD DETAILS
plain- Asserted: passes — The authors put it forward as true.
- Checkable: passes — It can be checked against evidence.
- Load-bearing: passes — The paper’s conclusions depend on it.
- Based: passes — The paper gives a reason why it holds.
Probably not a substantial claim.
A result the paper reports from its own data — it cites no other source for it, so there is none to check. The quote shows it is in the paper.
In the paper
“DE between AD and controls for this study’s sorted cell populations was first attempted using voom+limma, which identified only 12 DE genes (adjusted p ≤ 0.05) in myeloid cells and none in the other cell types.”
§ Alzheimer’s Patient Microglia Exhibit Enhanced Aging and Unique Transcriptional Activation > STAR★METHODS > QUANTIFICATION AND STATISTICAL ANALYSIS
plain- Asserted: passes — The authors put it forward as true.
- Checkable: passes — It can be checked against evidence.
- Load-bearing: passes — The paper’s conclusions depend on it.
- Based: passes — The paper gives a reason why it holds.
It may state two separate claims as one.
A conclusion the paper draws from its own results — it cites no other source for it, so there is none to check. The quote shows it is in the paper.
In the paper
“Thus, the relative lack of DAM gene induction in human microglia was a peculiar feature of human AD tissues and may be a specific feature of AD pathogenesis.”
§ Alzheimer’s Patient Microglia Exhibit Enhanced Aging and Unique Transcriptional Activation > INTRODUCTION
hedgedconditional- Asserted: passes — The authors put it forward as true.
- Checkable: passes — It can be checked against evidence.
- Load-bearing: passes — The paper’s conclusions depend on it.
- Based: passes — The paper gives a reason why it holds.
It may state two separate claims as one.
What the paper did — it cites no source for this, so there is none to check. The quote shows it is in the paper.
In the paper
“Linear model testing as well as visual exploration revealed no significant correlation between PMI and any of the other variables (diagnosis, see also Figure S2C PMI panel; sex; ApoE4 status; age; or Last MMSE).”
§ Alzheimer’s Patient Microglia Exhibit Enhanced Aging and Unique Transcriptional Activation > STAR★METHODS > EXPERIMENTAL MODEL AND SUBJECT DETAILS
plain- Asserted: passes — The authors put it forward as true.
- Checkable: passes — It can be checked against evidence.
- Load-bearing: unclear — It is unclear whether the paper’s conclusions depend on it.
- Based: passes — The paper gives a reason why it holds.
It may state two separate claims as one.
A conclusion the paper draws from its own results — it cites no other source for it, so there is none to check. The quote shows it is in the paper.
In the paper
“Thus, human microglia are capable of responding in a DAM-like manner, but for some reason this response is blunted in AD patients (at least in the disease stages we examined).”
§ Alzheimer’s Patient Microglia Exhibit Enhanced Aging and Unique Transcriptional Activation > RESULTS > HAM, DAM, and Aging Comparisons in Human AD, Xenograft AD, and Human MS Tissues
hedged- Asserted: passes — The authors put it forward as true.
- Checkable: passes — It can be checked against evidence.
- Load-bearing: passes — The paper’s conclusions depend on it.
- Based: passes — The paper gives a reason why it holds.
It may state two separate claims as one.
What the paper did — it cites no source for this, so there is none to check. The quote shows it is in the paper.
In the paper
“our approach allowed us to sample a suitably large number of tissues with known histopathological characteristics while obtaining broad coverage of the transcriptome.”
§ Alzheimer’s Patient Microglia Exhibit Enhanced Aging and Unique Transcriptional Activation > DISCUSSION
plaindirect- Asserted: passes — The authors put it forward as true.
- Checkable: passes — It can be checked against evidence.
- Load-bearing: passes — The paper’s conclusions depend on it.
- Based: passes — The paper gives a reason why it holds.
It may state two separate claims as one.
In the paper
“Standard polyA-selected Illumina RNA-Seq analysis was performed as described (Srinivasan et al., 2016) on samples with RNA integrity (RIN) scores at least 5 and post-mortem intervals (PMIs) no greater than 5 hr.”
§ Alzheimer’s Patient Microglia Exhibit Enhanced Aging and Unique Transcriptional Activation > STAR★METHODS > METHOD DETAILS
What the sources say
- Not checked yetcites Srinivasan et al., 2016 source
plainn = 289- Asserted: passes — The authors put it forward as true.
- Checkable: passes — It can be checked against evidence.
- Load-bearing: fails — The paper’s conclusions may not depend on it.
- Based: passes — The paper gives a reason why it holds.
Probably not a substantial claim. The paper’s conclusions may not depend on it. It may state two separate claims as one.
What the paper did — it cites no source for this, so there is none to check. The quote shows it is in the paper.
In the paper
“provides rich gene expression profiles to enable genome-wide analyses of differential expression (DE)”
§ Alzheimer’s Patient Microglia Exhibit Enhanced Aging and Unique Transcriptional Activation > INTRODUCTION
plaindirect- Asserted: passes — The authors put it forward as true.
- Checkable: passes — It can be checked against evidence.
- Load-bearing: passes — The paper’s conclusions depend on it.
- Based: passes — The paper gives a reason why it holds.
Probably not a substantial claim.
What the paper did — it cites no source for this, so there is none to check. The quote shows it is in the paper.
In the paper
“All AD subjects were clinically diagnosed with AD in life and brains were neuropathologically confirmed to have”
§ Alzheimer’s Patient Microglia Exhibit Enhanced Aging and Unique Transcriptional Activation > STAR★METHODS > EXPERIMENTAL MODEL AND SUBJECT DETAILS
plain- Asserted: passes — The authors put it forward as true.
- Checkable: passes — It can be checked against evidence.
- Load-bearing: passes — The paper’s conclusions depend on it.
- Based: passes — The paper gives a reason why it holds.
It may state two separate claims as one.
What the paper did — it cites no source for this, so there is none to check. The quote shows it is in the paper.
In the paper
“The method we developed allows the collection of desired cell types by the tens (or hundreds) of thousands from each tissue sample”
§ Alzheimer’s Patient Microglia Exhibit Enhanced Aging and Unique Transcriptional Activation > INTRODUCTION
plain- Asserted: passes — The authors put it forward as true.
- Checkable: passes — It can be checked against evidence.
- Load-bearing: passes — The paper’s conclusions depend on it.
- Based: passes — The paper gives a reason why it holds.
Probably not a substantial claim.
What the paper did — it cites no source for this, so there is none to check. The quote shows it is in the paper.
In the paper
“but were omitted in all other analyses associated with this manuscript to avoid overlap between the two datasets”
§ Alzheimer’s Patient Microglia Exhibit Enhanced Aging and Unique Transcriptional Activation > STAR★METHODS > METHOD DETAILS
plainn = 89- Asserted: passes — The authors put it forward as true.
- Checkable: passes — It can be checked against evidence.
- Load-bearing: passes — The paper’s conclusions depend on it.
- Based: passes — The paper gives a reason why it holds.
Probably not a substantial claim.
What the paper did — it cites no source for this, so there is none to check. The quote shows it is in the paper.
In the paper
“Although age was not well controlled in the new cohort, the direction of difference was anti-conservative, with the AD cases on average about a half decade younger.”
§ Alzheimer’s Patient Microglia Exhibit Enhanced Aging and Unique Transcriptional Activation > STAR★METHODS > EXPERIMENTAL MODEL AND SUBJECT DETAILS
plaincorrelational- Asserted: passes — The authors put it forward as true.
- Checkable: passes — It can be checked against evidence.
- Load-bearing: passes — The paper’s conclusions depend on it.
- Based: passes — The paper gives a reason why it holds.
It may state two separate claims as one.
None of the sources cited for this claim have been checked yet.
In the paper
“Several genesassoci-ated with AD incidence (APOE, CLU, ABCA7, SORL1, INPP5D, and PLCG2)(Jansen et al., 2019; Kunkle et al., 2019; Marioni et al., 2018) also function in lipid transport or signaling.”
§ Alzheimer’s Patient Microglia Exhibit Enhanced Aging and Unique Transcriptional Activation > DISCUSSION
What the sources say
plaincorrelational- Asserted: passes — The authors put it forward as true.
- Checkable: passes — It can be checked against evidence.
- Load-bearing: fails — The paper’s conclusions may not depend on it.
- Based: passes — The paper gives a reason why it holds.
Probably not a substantial claim. The paper’s conclusions may not depend on it.
A conclusion the paper draws from its own results — it cites no other source for it, so there is none to check. The quote shows it is in the paper.
In the paper
“These data indicated that the HAM profile in AD microglia reflected a mixture of an enhanced aging process and an age-independent, disease-related activation process.”
§ Alzheimer’s Patient Microglia Exhibit Enhanced Aging and Unique Transcriptional Activation > RESULTS > AD Microglia Display an Enhanced Human Aging Phenotype
hedgedcorrelational- Asserted: passes — The authors put it forward as true.
- Checkable: passes — It can be checked against evidence.
- Load-bearing: passes — The paper’s conclusions depend on it.
- Based: passes — The paper gives a reason why it holds.
It may state two separate claims as one.
What the paper did — it cites no source for this, so there is none to check. The quote shows it is in the paper.
In the paper
“We completed this process for 22 AD and 21 control SFG tissues.”
§ Alzheimer’s Patient Microglia Exhibit Enhanced Aging and Unique Transcriptional Activation > RESULTS > Defining the HAM Gene Expression Profile Using Frozen Tissues
plainn = 21- Asserted: passes — The authors put it forward as true.
- Checkable: passes — It can be checked against evidence.
- Load-bearing: passes — The paper’s conclusions depend on it.
- Based: passes — The paper gives a reason why it holds.
Probably not a substantial claim.
In the paper
“A third explanation for the dissimilarity could be that the DAM activation state in b-amyloid models is a protective response by healthy microglia (Keren-Shaul et al., 2017)”
§ Alzheimer’s Patient Microglia Exhibit Enhanced Aging and Unique Transcriptional Activation > DISCUSSION
What the sources say
- Not checked yetcites Keren-Shaul et al., 2017 source
hedgeddirect- Asserted: fails — The authors may not put it forward as true.
- Checkable: passes — It can be checked against evidence.
- Load-bearing: fails — The paper’s conclusions may not depend on it.
- Based: passes — The paper gives a reason why it holds.
Probably not a substantial claim. The authors may not put it forward as true. The paper’s conclusions may not depend on it.
What the paper did — it cites no source for this, so there is none to check. The quote shows it is in the paper.
In the paper
“For sorted cell cohort (GSE125050), controls had either”
§ Alzheimer’s Patient Microglia Exhibit Enhanced Aging and Unique Transcriptional Activation > STAR★METHODS > EXPERIMENTAL MODEL AND SUBJECT DETAILS
plain- Asserted: passes — The authors put it forward as true.
- Checkable: passes — It can be checked against evidence.
- Load-bearing: fails — The paper’s conclusions may not depend on it.
- Based: passes — The paper gives a reason why it holds.
Probably not a substantial claim. The paper’s conclusions may not depend on it. It may state two separate claims as one.
What the paper did — it cites no source for this, so there is none to check. The quote shows it is in the paper.
In the paper
“(The Braak stage analyses did not include the corrective measures for altered cellular makeup of AD tissues, because it was impractical to reduce the sample size.)”
§ Alzheimer’s Patient Microglia Exhibit Enhanced Aging and Unique Transcriptional Activation > RESULTS > Validation of the HAM Profile in Multiple Cortical Regions and Datasets
plain- Asserted: passes — The authors put it forward as true.
- Checkable: passes — It can be checked against evidence.
- Load-bearing: fails — The paper’s conclusions may not depend on it.
- Based: passes — The paper gives a reason why it holds.
Probably not a substantial claim. The paper’s conclusions may not depend on it.
What the paper did — it cites no source for this, so there is none to check. The quote shows it is in the paper.
In the paper
“Labeling nuclei with DAPI helps ensure that only singlet cell bodies are collected, because doublets with a higher DAPI signal and cell fragments that lack nuclei are easily excluded.”
§ Alzheimer’s Patient Microglia Exhibit Enhanced Aging and Unique Transcriptional Activation > RESULTS > Defining the HAM Gene Expression Profile Using Frozen Tissues
plaindirect- Asserted: passes — The authors put it forward as true.
- Checkable: passes — It can be checked against evidence.
- Load-bearing: fails — The paper’s conclusions may not depend on it.
- Based: passes — The paper gives a reason why it holds.
Probably not a substantial claim. The paper’s conclusions may not depend on it.
What the paper did — it cites no source for this, so there is none to check. The quote shows it is in the paper.
In the paper
“allows the selection of sample cohorts that include a suitably large number of AD and control subjects with desired histopathological or clinical characteristics.”
§ Alzheimer’s Patient Microglia Exhibit Enhanced Aging and Unique Transcriptional Activation > INTRODUCTION
plain- Asserted: passes — The authors put it forward as true.
- Checkable: passes — It can be checked against evidence.
- Load-bearing: passes — The paper’s conclusions depend on it.
- Based: passes — The paper gives a reason why it holds.
Probably not a substantial claim.
In the paper
“That the DAM activation state—generally considered protective in mouse neurodegeneration models—was more readily observed in microglia from MS lesions and in xMG from 5xFAD mouse brains”
§ Alzheimer’s Patient Microglia Exhibit Enhanced Aging and Unique Transcriptional Activation > DISCUSSION
What the sources say
- Not checked yetcites Keren-Shaul et al., 2017 source
hedgeddirect- Asserted: passes — The authors put it forward as true.
- Checkable: passes — It can be checked against evidence.
- Load-bearing: passes — The paper’s conclusions depend on it.
- Based: passes — The paper gives a reason why it holds.
Probably not a substantial claim.
What the paper did — it cites no source for this, so there is none to check. The quote shows it is in the paper.
In the paper
“qRT-PCR for specific cell-type markers validated the specificity of the collected populations and was successful for nearly all RNA samples (data not shown).”
§ Alzheimer’s Patient Microglia Exhibit Enhanced Aging and Unique Transcriptional Activation > RESULTS > Defining the HAM Gene Expression Profile Using Frozen Tissues
plain- Asserted: passes — The authors put it forward as true.
- Checkable: passes — It can be checked against evidence.
- Load-bearing: passes — The paper’s conclusions depend on it.
- Based: passes — The paper gives a reason why it holds.
It may state two separate claims as one.
What the paper did — it cites no source for this, so there is none to check. The quote shows it is in the paper.
In the paper
“After this step cells with less than 800 total transcripts or greater than 30% mitochondrial transcripts were discarded, resulting in 1,738 QC-passing cells for analysis.”
§ Alzheimer’s Patient Microglia Exhibit Enhanced Aging and Unique Transcriptional Activation > STAR★METHODS > QUANTIFICATION AND STATISTICAL ANALYSIS
plain- Asserted: passes — The authors put it forward as true.
- Checkable: passes — It can be checked against evidence.
- Load-bearing: fails — The paper’s conclusions may not depend on it.
- Based: passes — The paper gives a reason why it holds.
Probably not a substantial claim. The paper’s conclusions may not depend on it.
What the paper did — it cites no source for this, so there is none to check. The quote shows it is in the paper.
In the paper
“led us to set these cell types aside (taking a conservative position) and focus on the whether the changes in myeloid cells could be validated.”
§ Alzheimer’s Patient Microglia Exhibit Enhanced Aging and Unique Transcriptional Activation > STAR★METHODS > QUANTIFICATION AND STATISTICAL ANALYSIS
plain- Asserted: passes — The authors put it forward as true.
- Checkable: passes — It can be checked against evidence.
- Load-bearing: passes — The paper’s conclusions depend on it.
- Based: passes — The paper gives a reason why it holds.
Probably not a substantial claim. It may state two separate claims as one.
- Rests on an assumption: There was a lack of other human AD datasets available at the time for cross-comparison.
A conclusion the paper draws from its own results — it cites no other source for it, so there is none to check. The quote shows it is in the paper.
In the paper
“It showed variable expression levels in the Controls (all non-carriers), so it may be a false positive.”
§ Alzheimer’s Patient Microglia Exhibit Enhanced Aging and Unique Transcriptional Activation > STAR★METHODS > QUANTIFICATION AND STATISTICAL ANALYSIS
hedged- Asserted: passes — The authors put it forward as true.
- Checkable: passes — It can be checked against evidence.
- Load-bearing: fails — The paper’s conclusions may not depend on it.
- Based: passes — The paper gives a reason why it holds.
Probably not a substantial claim. The paper’s conclusions may not depend on it. It may state two separate claims as one.
What the paper did — it cites no source for this, so there is none to check. The quote shows it is in the paper.
In the paper
“All assays were performed in duplicate and the average of these two Ct values was kept, except for twelve sample/assay pairs for which the difference was more than 2.82 (corresponding to a standard deviation of 2), which were discarded.”
§ Alzheimer’s Patient Microglia Exhibit Enhanced Aging and Unique Transcriptional Activation > STAR★METHODS > QUANTIFICATION AND STATISTICAL ANALYSIS
plainn = 12- Asserted: passes — The authors put it forward as true.
- Checkable: passes — It can be checked against evidence.
- Load-bearing: fails — The paper’s conclusions may not depend on it.
- Based: passes — The paper gives a reason why it holds.
Probably not a substantial claim. The paper’s conclusions may not depend on it. It may state two separate claims as one.
What the paper did — it cites no source for this, so there is none to check. The quote shows it is in the paper.
In the paper
“We did not use the samples from batches 7 and 8 since, despite restricting to the batch-normalized values, we still saw very strong clustering of these two batches separately from the first 6 on PCA.”
§ Alzheimer’s Patient Microglia Exhibit Enhanced Aging and Unique Transcriptional Activation > STAR★METHODS > QUANTIFICATION AND STATISTICAL ANALYSIS
plaindirect- Asserted: passes — The authors put it forward as true.
- Checkable: passes — It can be checked against evidence.
- Load-bearing: fails — The paper’s conclusions may not depend on it.
- Based: passes — The paper gives a reason why it holds.
Probably not a substantial claim. The paper’s conclusions may not depend on it.
The authors state this as an assumption.
Damage from the freeze-thaw process led to cellular disintegration when cells remained unfixed for too long or were incubated at 37°C.
“We presume that damage from the freeze-thaw process led to cellular disintegration when cells remained unfixed for too long or were incubated at 37°C.”
The paper relies on this without support.
Gray matter atrophy was pronounced in the fusiform gyrus from AD subjects.
“since gray matter atrophy was pronounced in FuG from AD subjects”
The paper relies on this without support.
Activated microglia often display elevated CD45 reactivity.
“since we did not want to exclude activated microglia which often display elevated CD45 reactivity”
The paper relies on this without support.
There was a lack of other human AD datasets available at the time for cross-comparison.
“the lack of other human AD datasets available at the time for cross-comparison”
Claims other papers make about this one
Each is checked against this paper’s own text: does it say what the citing paper says it does?
The cited source says what the claim attributes to it.
In the citing paper
“Transcriptional profiles of microglia isolated from frozen human AD and control cortical tissue suggest an overall species difference in the disease associated signature, though an increased SPI1 expression was measured in AD samples compared to controls55 validating previous observations by others31.”
From Modest changes in Spi1 dosage reveal the potential for altered microglial function as seen in Alzheimer’s disease (2021) · cites this paper as [55]
The cited source says what the claim attributes to it.
In the citing paper
“Transcriptional profiles of microglia isolated from frozen human AD and control cortical tissue suggest an overall species difference in the disease associated signature, though an increased SPI1 expression was measured in AD samples compared to controls55 validating previous observations by others31.”
From Modest changes in Spi1 dosage reveal the potential for altered microglial function as seen in Alzheimer’s disease (2021) · cites this paper as [55]
The cited source says what the claim attributes to it.
In the citing paper
“Human single nucleus RNA sequencing data from Mathys and colleagues [5] and Lake and colleagues [12] were obtained from The Myeloid Landscape 2 portal (http://research-pub.gene.com/BrainMyeloidLandscape) [70].”
From Selective suppression of oligodendrocyte-derived amyloid beta rescues neuronal dysfunction in Alzheimer’s disease (2024) · cites this paper as [70]
The cited source says what the claim attributes to it.
In the citing paper
“We further compared 832 DEGs with bulk RNA-seq datasets from various brain regions in individuals with AD (80–84), gene members in GO terms related to apoptosis/neurodegeneration, and AD risk genes from Alzgene database, revealing distinct sets of DEGs with overlaps ranging from 8 to 135 genes (Table S7, page 2, 3 and 4).”
From Modeling late-onset Alzheimer’s disease neuropathology via direct neuronal reprogramming (2024) · cites this paper as [84]
The cited source says what the claim attributes to it.
In the citing paper
“APOE is greatly upregulated in human AD microglia (HAM) from human AD brains”
From ApoE4 reduction: An emerging and promising therapeutic strategy for Alzheimer's disease (2022) · cites this paper as Srinivasan et al 2020
The cited source says what the claim attributes to it.
In the citing paper
“Cluster 2 genes were significantly enriched for genes upregulated following in vitro culture34 and in AD-derived microglia33.”
From Genetic analysis of the human microglial transcriptome across brain regions, aging and disease pathologies (2022) · cites this paper as [33]
The cited source says what the claim attributes to it.
In the citing paper
“Cluster 1 contained genes that were upregulated in the cortical regions compared to subcortical regions, such as P2RY12, CD36, and MRC1, and was enriched in genes that were downregulated in AD brain33 and in response to in vitro culture34.”
From Genetic analysis of the human microglial transcriptome across brain regions, aging and disease pathologies (2022) · cites this paper as [33]
The cited source says what the claim attributes to it.
In the citing paper
“The downregulated genes were significantly enriched for cell motility, polarity, IL-6 cytokine signaling (Fig. 3b), and for genes also downregulated following in vitro culture34 and in AD-derived microglia33 (Fig. 3c).”
From Genetic analysis of the human microglial transcriptome across brain regions, aging and disease pathologies (2022) · cites this paper as [33]
The cited source says what the claim attributes to it.
In the citing paper
“While APOE is upregulated in human microglia in AD, the mouse DAM phenotype is absent or only partially overlaps, highlighting species differences between human and mouse and the importance of studying APOE4 in human systems (Galatro et al., 2017; Li et al., 2021; Srinivasan et al., 2020; Zhou et al., 2020).”
From Cholesterol and matrisome pathways dysregulated in astrocytes and microglia (2022) · cites this paper as Srinivasan et al., 2020
The check wasn’t confident either way, so it gives no verdict — never disputed.
In the citing paper
“Cluster 1 genes were enriched in genes that were downregulated in AD brain and in response to in vitro culture.”
From Genetic analysis of the human microglial transcriptome across brain regions, aging and disease pathologies (2022) · cites this paper as [33]
Experimental — accuracy not yet measured
Self-check
Percentages, sums and reported differences re-computed from the paper’s own numbers.
Each contradiction between two passages listed here was confirmed by an independent check.
Rated minor: it would not touch a result — a value no result rests on, a p-value that stays on the same side of the significance level, or a conflict that is clerical, resolved elsewhere in the paper, or outside its own findings.
In the paper
§ Alzheimer’s Patient Microglia Exhibit Enhanced Aging and Unique Transcriptional Activation > RESULTS > Defining the HAM Gene Expression Profile Using Frozen Tissues
“We completed this process for 22 AD and 21 control SFG tissues.”
§ Alzheimer’s Patient Microglia Exhibit Enhanced Aging and Unique Transcriptional Activation > STAR★METHODS > EXPERIMENTAL MODEL AND SUBJECT DETAILS
“| N | 21 | 21 | | 15 | 10 | |”
Citations
Cites
Neuropathological stageing of Alzheimer-related changes.
Braak, H., & Braak, E. (1991) · Acta Neuropathologica · doi:10.1007/bf00308809 · Cited by 16,123 · cited 2×
“All AD subjects were clinically diagnosed with AD in life and brains were neuropathologically confirmed to have "frequent" CERAD neuritic plaque densities (Mirra et al., 1991) and Braak score V or VI ( Braak and Braak, 1991).”
A Unique Microglia Type Associated with Restricting Development of Alzheimer’s Disease
Keren-Shaul, H., Spinrad, A., Weiner, A., Matcovitch-Natan, O., Dvir-Szternfeld, R., Ulland, T. K., David, E., Baruch, K., Lara-Astaiso, D., Toth, B., et al. (2017) · Cell · doi:10.1016/j.cell.2017.05.018 · Cited by 5,493
Mirra, S. S., Heyman, A., McKeel, D., Sumi, S. M., Crain, B. J., Brownlee, L. M., Vogel, F. S., Hughes, J. P., Belle, G. V., Berg, L., et al. (1991) · Neurology · doi:10.1212/wnl.41.4.479 · Cited by 4,961
Meta-Analysis of 74,046 Individuals Identifies 11 New Susceptibility Loci for Alzheimer’s Disease
(EADI), E. A. D. I., Lambert, J.-C., (GERAD), G. A. E. R. I. A. D., Alzheimer's Disease Genetic Consortium (ADGC), (CHARGE), C. F. H. A. A. R. I. G. E., Ibrahim-Verbaas, C. A., Harold, D., Naj, A. C., Sims, R., Bellenguez, C., et al. (2013) · Nature Genetics · doi:10.1038/ng.2802 · Cited by 4,336
Host microbiota constantly control maturation and function of microglia in the CNS
Erny, D., Hrabě de Angelis, A. L., Jaitin, D., Wieghofer, P., Staszewski, O., David, E., Keren-Shaul, H., Mahlakoiv, T., Jakobshagen, K., Buch, T., et al. (2015) · Nature Neuroscience · doi:10.1038/nn.4030 · Cited by 3,569
Cell types in the mouse cortex and hippocampus revealed by single-cell RNA-seq
Zeisel, A., Muñoz-Manchado, A. B., Codeluppi, S., Lönnerberg, P., La Manno, G., Juréus, A., Marques, S., Munguba, H., He, L., Betsholtz, C., et al. (2015) · Science · doi:10.1126/science.aaa1934 · Cited by 3,124
Krasemann, S., Madore, C., Cialic, R., Baufeld, C., Calcagno, N., El Fatimy, R., Beckers, L., O’Loughlin, E., Xu, Y., Fanek, Z., et al. (2017) · Immunity · doi:10.1016/j.immuni.2017.08.008 · Cited by 2,979
Alzheimer Disease Genetics Consortium (ADGC), Kunkle, B. W., The European Alzheimer’s Disease Initiative (EADI), Cohorts for Heart and Aging Research in Genomic Epidemiology Consortium (CHARGE), Genetic and Environmental Risk in AD/Defining Genetic, P. A. E. R. F. A. D. C. (., Grenier-Boley, B., Sims, R., Bis, J. C., Damotte, V., Naj, A. C., et al. (2019) · Nature Genetics · doi:10.1038/s41588-019-0358-2 · Cited by 2,946
Single-cell transcriptomic analysis of Alzheimer’s disease
Mathys, H., Davila-Velderrain, J., Peng, Z., Gao, F., Mohammadi, S., Young, J. Z., Menon, M., He, L., Abdurrob, F., Jiang, X., et al. (2019) · Nature · doi:10.1038/s41586-019-1195-2 · Cited by 2,568
Zhang, Y., Sloan, S. A., Clarke, L. E., Caneda, C., Plaza, C. A., Blumenthal, P. D., Vogel, H., Steinberg, G. K., Edwards, M. S. B., Li, G., et al. (2016) · Neuron · doi:10.1016/j.neuron.2015.11.013 · Cited by 2,295
Cited by
Sorted by citations
Microglia states and nomenclature: A field at its crossroads
Paolicelli, R. C., Sierra, A., Stevens, B., Tremblay, M.-E., Aguzzi, A., Ajami, B., Amit, I., Audinat, E., Bechmann, I., Bennett, M., et al. (2022) · Neuron · doi:10.1016/j.neuron.2022.10.020 · Cited by 1,973
Spatial Transcriptomics and In Situ Sequencing to Study Alzheimer’s Disease
Chen, W.-T., Lu, A., Craessaerts, K., Pavie, B., Sala Frigerio, C., Corthout, N., Qian, X., Laláková, J., Kühnemund, M., Voytyuk, I., et al. (2020) · Cell · doi:10.1016/j.cell.2020.06.038 · Cited by 949
Single cell RNA sequencing of human microglia uncovers a subset associated with Alzheimer’s disease
Olah, M., Menon, V., Habib, N., Taga, M. F., Ma, Y., Yung, C. J., Cimpean, M., Khairallah, A., Coronas-Samano, G., Sankowski, R., et al. (2020) · Nature Communications · doi:10.1038/s41467-020-19737-2 · Cited by 722
Neuroinflammation in Alzheimer disease
Heneka, M. T., van der Flier, W. M., Jessen, F., Hoozemanns, J., Thal, D. R., Boche, D., Brosseron, F., Teunissen, C., Zetterberg, H., Jacobs, A. H., et al. (2025) · Nature Reviews Immunology · doi:10.1038/s41577-024-01104-7 · Cited by 638
Molecular characterization of selectively vulnerable neurons in Alzheimer’s disease
Leng, K., Li, E., Eser, R., Piergies, A., Sit, R., Tan, M., Neff, N., Li, S. H., Rodriguez, R. D., Suemoto, C. K., et al. (2021) · Nature Neuroscience · doi:10.1038/s41593-020-00764-7 · Cited by 485
Human microglial state dynamics in Alzheimer’s disease progression
Sun, N., Victor, M. B., Park, Y. P., Xiong, X., Scannail, A. N., Leary, N., Prosper, S., Viswanathan, S., Luna, X., Boix, C. A., et al. (2023) · Cell · doi:10.1016/j.cell.2023.08.037 · Cited by 462
Crosstalk Between Astrocytes and Microglia: An Overview
Matejuk, A., & Ransohoff, R. M. (2020) · Frontiers in Immunology · doi:10.3389/fimmu.2020.01416 · Cited by 445
The neurobiology of long COVID
Monje, M., & Iwasaki, A. (2022) · Neuron · doi:10.1016/j.neuron.2022.10.006 · Cited by 415
Cholesterol and matrisome pathways dysregulated in astrocytes and microglia
TCW, J., Qian, L., Pipalia, N. H., Chao, M. J., Liang, S. A., Shi, Y., Jain, B. R., Bertelsen, S. E., Kapoor, M., Marcora, E., et al. (2022) · Cell · doi:10.1016/j.cell.2022.05.017 · Cited by 411
Cai, Y., Liu, J., Wang, B., Sun, M., & Yang, H. (2022) · Frontiers in Immunology · doi:10.3389/fimmu.2022.856376 · Cited by 351
Microglia Phenotypes in Aging and Neurodegenerative Diseases
Wendimu, M. Y., & Hooks, S. B. (2022) · Cells · doi:10.3390/cells11132091 · Cited by 336
Microglia in Alzheimer's disease at single-cell level. Are there common patterns in humans and mice?
Chen, Y., & Colonna, M. (2021) · Journal of Experimental Medicine · doi:10.1084/jem.20202717 · Cited by 339
The neuroimmune axis of Alzheimer’s disease
Jorfi, M., Maaser‐Hecker, A., & Tanzi, R. E. (2023) · Genome Medicine · doi:10.1186/s13073-023-01155-w · Cited by 313
Novel Alzheimer risk genes determine the microglia response to amyloid-β but not to TAU pathology
Sierksma, A., Lu, A., Mancuso, R., Fattorelli, N., Thrupp, N., Salta, E., Zoco, J., Blum, D., Buée, L., De Strooper, B., et al. (2020) · EMBO Molecular Medicine · doi:10.15252/emmm.201910606 · Cited by 291
Lopez‐Rodriguez, A. B., Hennessy, E., Murray, C. L., Nazmi, A., Delaney, H. J., Healy, D., Fagan, S. G., Rooney, M., Stewart, E., Lewis, A., et al. (2021) · Alzheimer's & Dementia · doi:10.1002/alz.12341 · Cited by 293
Beyond Activation: Characterizing Microglial Functional Phenotypes
Lier, J., Streit, W. J., & Bechmann, I. (2021) · Cells · doi:10.3390/cells10092236 · Cited by 274
“As shown in studies using single-cell RNA sequencing in Alzheimer’s disease and other neurodegenerative conditions, P2RY12 is one of the proteins marking the transition from homeostatic microglia to disease-associated microglia by the downregulation of gene expression [55,61].”
ResultLopes, K. D. P., Snijders, G. J. L., Humphrey, J., Allan, A., Sneeboer, M. A. M., Navarro, E., Schilder, B. M., Vialle, R. A., Parks, M., Missall, R., et al. (2022) · Nature Genetics · doi:10.1038/s41588-021-00976-y · Cited by 273
Disease-associated oligodendrocyte responses across neurodegenerative diseases
Pandey, S., Shen, K., Lee, S.-H., Shen, Y.-A. A., Wang, Y., Otero-García, M., Kotova, N., Vito, S. T., Laufer, B. I., Newton, D. F., et al. (2022) · Cell Reports · doi:10.1016/j.celrep.2022.111189 · Cited by 227
Self-citationCholesterol and Alzheimer’s Disease; From Risk Genes to Pathological Effects
Feringa, F. M., & van der Kant, R. (2021) · Frontiers in Aging Neuroscience · doi:10.3389/fnagi.2021.690372 · Cited by 226
Lee, S., Devanney, N. A., Golden, L. R., Smith, C. T., Schwartz, J. L., Walsh, A. E., Clarke, H. A., Goulding, D. S., Allenger, E. J., Morillo-Segovia, G., et al. (2023) · Cell Reports · doi:10.1016/j.celrep.2023.112196 · Cited by 203
Autophagy enables microglia to engage amyloid plaques and prevents microglial senescence
Choi, I., Wang, M., Yoo, S., Xu, P., Seegobin, S. P., Li, X., Han, X., Wang, Q., Peng, J., Zhang, B., et al. (2023) · Nature Cell Biology · doi:10.1038/s41556-023-01158-0 · Cited by 202
Jin, M., Xu, R., Wang, L., Alam, M. M., Ma, Z., Zhu, S., Martini, A. C., Jadali, A., Bernabucci, M., Xie, P., et al. (2022) · Cell Stem Cell · doi:10.1016/j.stem.2022.06.007 · Cited by 174
Human Microglia Show Unique Transcriptional Changes in Alzheimer's Disease
Prater, K. E., Green, K. J., Mamde, S., Sun, W., Cochoit, A., Smith, C. L., Chiou, K. L., Heath, L., Rose, S. E., Wiley, J., et al. (2023) · Nature Aging · doi:10.1038/s43587-023-00424-y · Cited by 164
You, Y., Muraoka, S., Jedrychowski, M. P., Hu, J., McQuade, A., Young‐Pearse, T. L., Aslebagh, R., Shaffer, S. A., Gygi, S. P., Blurton-Jones, M. M., et al. (2022) · Journal of Extracellular Vesicles · doi:10.1002/jev2.12183 · Cited by 165
Targeting synapse function and loss for treatment of neurodegenerative diseases
Dejanovic, B., Sheng, M., & Hanson, J. E. (2023) · Nature Reviews Drug Discovery · doi:10.1038/s41573-023-00823-1 · Cited by 177
AD-linked R47H- TREM2 mutation induces disease-enhancing microglial states via AKT hyperactivation
Sayed, F. A., Kodama, L., Fan, L., Carling, G. K., Udeochu, J. C., Le, D., Li, Q., Zhou, L., Wong, M. Y., Horowitz, R., et al. (2021) · Science Translational Medicine · doi:10.1126/scitranslmed.abe3947 · Cited by 155
Microglial amyloid beta clearance is driven by PIEZO1 channels
Jäntti, H., Sitnikova, V., Ishchenko, Y., Shakirzyanova, A., Giudice, L., Ugidos, I. F., Gómez‐Budia, M., Korvenlaita, N., Ohtonen, S., Belaya, I., et al. (2022) · Journal of Neuroinflammation · doi:10.1186/s12974-022-02486-y · Cited by 164
Ellwanger, D. C., Wang, S., Brioschi, S., Shao, Z., Green, L. B., Case, R. B., Yoo, D., Weishuhn, D., Rathanaswami, P., Bradley, J., et al. (2021) · Proceedings of the National Academy of Sciences · doi:10.1073/pnas.2017742118 · Cited by 144
The interaction between ageing and Alzheimer's disease: insights from the hallmarks of ageing
Liu, Y., Tan, Y., Zhang, Z., Yi, M., Zhu, L., & Peng, W. (2024) · Translational Neurodegeneration · doi:10.1186/s40035-024-00397-x · Cited by 156
Transgenic Mouse Models of Alzheimer’s Disease: An Integrative Analysis
Sanchez-Varo, R. M., Mejias‐Ortega, M., Fernandez-Valenzuela, J. J., Nuñez‐Diaz, C., Cáceres-Palomo, L., Vegas‐Gomez, L., Sánchez‐Mejías, E., Trujillo‐Estrada, L., García‐León, J. A., Moreno‐González, I., et al. (2022) · International Journal of Molecular Sciences · doi:10.3390/ijms23105404 · Cited by 136
Neuroinflammation in Alzheimer’s disease: microglial signature and their relevance to disease
Sobue, A., Komine, O., & Yamanaka, K. (2023) · Inflammation and Regeneration · doi:10.1186/s41232-023-00277-3 · Cited by 134
Cohn, W., Melnik, M., Huang, C., Teter, B., Chandra, S., Zhu, C., McIntire, L. B., John, V., Gylys, K. H., & Bilousova, T. V. (2021) · Frontiers in Pharmacology · doi:10.3389/fphar.2021.766082 · Cited by 123
Xia, D., Lianoglou, S., Sandmann, T., Calvert, M., Suh, J. H., Thomsen, E., Dugas, J., Pizzo, M. E., DeVos, S. L., Earr, T. K., et al. (2022) · Molecular Neurodegeneration · doi:10.1186/s13024-022-00547-7 · Cited by 124
Antignano, I., Liu, Y., Offermann, N., & Capasso, M. (2023) · Cellular and Molecular Life Sciences · doi:10.1007/s00018-023-04775-y · Cited by 117
Neurodegeneration and demyelination in multiple sclerosis
Garton, T. P., Gadani, S. P., Gill, A. J., & Calabresi, P. A. (2024) · Neuron · doi:10.1016/j.neuron.2024.05.025 · Cited by 129
Decoding microglial immunometabolism: a new frontier in Alzheimer's disease research
Jung, E. S., Choi, H., & Mook-Jung, I. (2025) · Molecular Neurodegeneration · doi:10.1186/s13024-025-00825-0 · Cited by 124
Diversity of transcriptomic microglial phenotypes in aging and Alzheimer's disease
Boche, D., & Gordon, M. N. (2021) · Alzheimer s & Dementia · doi:10.1002/alz.12389 · Cited by 122
A cell therapy approach to restore microglial Trem2 function in a mouse model of Alzheimer’s disease
Yoo, Y., Neumayer, G., Shibuya, Y., Mader, M. M.-D., & Wernig, M. (2023) · Cell Stem Cell · doi:10.1016/j.stem.2023.07.006 · Cited by 109
Baloni, P., Arnold, M., Buitrago, L., Nho, K. T., Moreno, H., Huynh, K., Brauner, B., Louie, G., Kueider‐Paisley, A., Suhre, K., et al. (2022) · Communications Biology · doi:10.1038/s42003-022-04011-6 · Cited by 117
Ivashko-Pachima, Y., Hadar, A., Grigg, I., Korenková, V., Kapitansky, O., Karmon, G., Gershovits, M., Sayas, C. L., Kooy, R. F., Attems, J., et al. (2021) · Molecular Psychiatry · doi:10.1038/s41380-019-0563-5 · Cited by 107
Single-nucleus RNA-sequencing of autosomal dominant Alzheimer disease and risk variant carriers
Brase, L., You, S., Albanus, R. D., Del‐Aguila, J. L., Dai, Y., Novotny, B. C., Soriano‐Tárraga, C., Dykstra, T., Fernández, M. V., Budde, J., et al. (2023) · Nature Communications · doi:10.1038/s41467-023-37437-5 · Cited by 104
Microglia and astrocyte involvement in neurodegeneration and brain cancer
Vandenbark, A. A., Offner, H., Matejuk, S., & Matejuk, A. (2021) · Journal of Neuroinflammation · doi:10.1186/s12974-021-02355-0 · Cited by 101
A neurodegenerative cellular stress response linked to dark microglia and toxic lipid secretion
Flury, A. G., Aljayousi, L., Park, H.-J., Khakpour, M., Mechler, J., Aziz, S., McGrath, J. D., Deme, P., Sandberg, C., Ibáñez, F. G., et al. (2024) · Neuron · doi:10.1016/j.neuron.2024.11.018 · Cited by 102
Bayesian estimation of cell type–specific gene expression with prior derived from single-cell dataPreprint
Wang, J., Roeder, K., & Devlin, B. (2021) · Genome Research · doi:10.1101/gr.268722.120 · Cited by 89
Genomics of Alzheimer’s disease implicates the innate and adaptive immune systems
Li, Y., Laws, S. M., Miles, L. A., Wiley, J. S., Huang, X., Masters, C. L., & Gu, B. J. (2021) · Cellular and Molecular Life Sciences · doi:10.1007/s00018-021-03986-5 · Cited by 96
Pellegrini, C., Pirazzini, C., Sala, C., Sambati, L., Yusipov, I., Kalyakulina, A., Ravaioli, F., Kwiatkowska, K. M., Durso, D. F., Ivanchenko, M., et al. (2021) · Frontiers in Aging Neuroscience · doi:10.3389/fnagi.2021.639428 · Cited by 90
Rong, Z., Mai, H., Ebert, G., Kapoor, S., Puelles, V. G., Czogalla, J., Hu, S., Su, J., Prtvar, D., Singh, I., et al. (2024) · Cell Host & Microbe · doi:10.1016/j.chom.2024.11.007 · Cited by 96
Internal m7G methylation: A novel epitranscriptomic contributor in brain development and diseases
Xia, X., Wang, Y., & Zheng, J. (2023) · Molecular Therapy — Nucleic Acids · doi:10.1016/j.omtn.2023.01.003 · Cited by 87
The old guard: Age-related changes in microglia and their consequences
Costa, J., Martins, S., Ferreira, P. A., Cardoso, A. M., Guedes, J. R., Peça, J., & Cardoso, A. L. (2021) · Mechanisms of Ageing and Development · doi:10.1016/j.mad.2021.111512 · Cited by 88
de Dios, C., Abadin, X., Roca-Agujetas, V., Jimenez-Martinez, M., Morales, A., Trullas, R., Mari, M., & Colell, A. (2023) · Translational Neurodegeneration · doi:10.1186/s40035-023-00343-3 · Cited by 85
Shifting paradigms: The central role of microglia in Alzheimer’s disease
Schwabe, T., Srinivasan, K., & Rhinn, H. (2020) · Neurobiology of Disease · doi:10.1016/j.nbd.2020.104962 · Cited by 84
Self-citationAlsema, A. M., Jiang, Q., Kracht, L., Gerrits, E., Dubbelaar, M. L., Miedema, A., Brouwer, N., Hol, E. M., Middeldorp, J., van Dijk, R. E., et al. (2020) · Frontiers in Molecular Neuroscience · doi:10.3389/fnmol.2020.00134 · Cited by 86
Nuclei isolation of multiple brain cell types for omics interrogation
Nott, A., Schlachetzki, J. C. M., Fixsen, B. R., & Glass, C. K. (2021) · Nature Protocols · doi:10.1038/s41596-020-00472-3 · Cited by 81
Hashemiaghdam, A., & Mroczek, M. (2020) · Journal of Neuroimmunology · doi:10.1016/j.jneuroim.2020.577185 · Cited by 79
Cross-Talk of the CNS With Immune Cells and Functions in Health and Disease
Matejuk, A., Vandenbark, A. A., & Offner, H. (2021) · Frontiers in Neurology · doi:10.3389/fneur.2021.672455 · Cited by 81
Different phenotypes of microglia in animal models of Alzheimer disease
Wei, Y., & Li, X. (2022) · Immunity & Ageing · doi:10.1186/s12979-022-00300-0 · Cited by 86
Lee, S.-H., Rezzonico, M. G., Friedman, B. A., Huntley, M. H., Meilandt, W. J., Pandey, S., Chen, Y.-J. J., Easton, A. E., Modrusan, Z. D., Hansen, D. V., et al. (2021) · Cell Reports · doi:10.1016/j.celrep.2021.110158 · Cited by 82
Self-citationModeling late-onset Alzheimer’s disease neuropathology via direct neuronal reprogramming
Sun, Z., Kwon, J.-S., Ren, Y., Chen, S., Walker, C. K., Lu, X., Cates, K., Karahan, H., Sviben, S., Fitzpatrick, J. A. J., et al. (2024) · Science · doi:10.1126/science.adl2992 · Cited by 77
“We further compared 832 DEGs with bulk RNA-seq datasets from various brain regions in individuals with AD (80–84), gene members in GO terms related to apoptosis/neurodegeneration, and AD risk genes from Alzgene database, revealing distinct sets of DEGs with overlaps ranging from 8 to 135 genes…”
Fruhwürth, S., Zetterberg, H., & Paludan, S. R. (2024) · Journal of Neuroimmunology · doi:10.1016/j.jneuroim.2024.578342 · Cited by 77
The Impact of Obesity on Microglial Function: Immune, Metabolic and Endocrine Perspectives
Alexaki, V. I. (2021) · Cells · doi:10.3390/cells10071584 · Cited by 84
Hole, K. L., & Williams, R. J. (2020) · Brain Plasticity · doi:10.3233/bpl-200098 · Cited by 81
Neurovascular Alterations in Vascular Dementia: Emphasis on Risk Factors
Lecordier, S., Manrique‐Castano, D., Moghrabi, Y. E., & ElAli, A. (2021) · Frontiers in Aging Neuroscience · doi:10.3389/fnagi.2021.727590 · Cited by 78
Imaging Neuroinflammation in Neurodegenerative Disorders
Masdeu, J. C., Pascual, B., & Fujita, M. (2022) · Journal of Nuclear Medicine · doi:10.2967/jnumed.121.263200 · Cited by 77
Single-cell analysis reveals inflammatory interactions driving macular degeneration
Kuchroo, M. R., DiStasio, M., Song, E., Calapkulu, E., Zhang, L., Ige, M., Sheth, A. H., Majdoubi, A., Menon, M., Tong, A., et al. (2023) · Nature Communications · doi:10.1038/s41467-023-37025-7 · Cited by 78
Vitek, M. P., Araujo, J. A., Fossel, M., Greenberg, B. D., Howell, G. R., Rizzo, S. J. S., Seyfried, N. T., Tenner, A. J., Territo, P. R., Windisch, M., et al. (2020) · Alzheimer's & Dementia: Translational Research & Clinical Interventions · doi:10.1002/trc2.12114 · Cited by 103
Rosen, S. F., Soung, A., Yang, W., Ai, S., Kanmogne, M., Davé, V. A., Prabhakar, S., Swain, A., Artyomov, M. N., Magee, J. A., et al. (2022) · Genome Medicine · doi:10.1186/s13073-022-01111-0 · Cited by 71
Microglia in Ischemic Stroke: Pathogenesis Insights and Therapeutic Challenges
Shui, X., Chen, J., Fu, Z., Zhu, H., Tao, H., & Li, Z. (2024) · Journal of Inflammation Research · doi:10.2147/jir.s461795 · Cited by 80
Biological roles of RNA m7G modification and its implications in cancer
Zhang, X., Zhu, W., Shen, S., Shen, J., & Chen, X.-D. (2023) · Biology Direct · doi:10.1186/s13062-023-00414-5 · Cited by 72
Xue, F., & Du, H. (2021) · Cells · doi:10.3390/cells10020321 · Cited by 73
Deng, R., Wu, H., Yan, W., & Mengdie, W. (2021) · Journal of Ethnopharmacology · doi:10.1016/j.jep.2021.113958 · Cited by 73
Association of peripheral blood DNA methylation level with Alzheimer’s disease progression
Li, Q. S., Vasanthakumar, A., Davis, J. W., Idler, K. B., Nho, K. T., Waring, J. F., Saykin, A. J., & Initiative, A. D. N. (2021) · Clinical Epigenetics · doi:10.1186/s13148-021-01179-2 · Cited by 66
A loss of mature microglial markers without immune activation in schizophrenia
Snijders, G. J. L., van Zuiden, W., Sneeboer, M. A. M., van Berlekom, A. B., van der Geest, A. T., Schnieder, T. P., MacIntyre, D. J., Hol, E. M., Kahn, R. S., & de Witte, L. D. (2021) · Glia · doi:10.1002/glia.23962 · Cited by 70
Audrain, M., Haure‐Mirande, J., Mleczko, J., Wang, M., Griffin, J. K., St George‐Hyslop, P. H., Fraser, P., Zhang, B., Gandy, S., & Ehrlich, M. E. (2021) · Alzheimer's & Dementia · doi:10.1002/alz.12256 · Cited by 65
Metabolic Regulation of Glia and Their Neuroinflammatory Role in Alzheimer's Disease
Kumari, P., Sood, A., & Fernandes, V. (2021) · Cellular and Molecular Neurobiology · doi:10.1007/s10571-021-01147-7 · Cited by 68
Magno, L., Bunney, T. D., Mead, E., Svensson, F., & Bictash, M. N. (2021) · Molecular Neurodegeneration · doi:10.1186/s13024-021-00436-5 · Cited by 64
Sex Differences in Neurodegeneration: The Role of the Immune System in Humans
Lopez-Lee, C., Kodama, L., & Gan, L. (2021) · Biological Psychiatry · doi:10.1016/j.biopsych.2021.01.002 · Cited by 69
ApoE4 reduction: An emerging and promising therapeutic strategy for Alzheimer's disease
Li, Y., Macyczko, J. R., Liu, C.-C., & Bu, G. (2022) · Neurobiology of Aging · doi:10.1016/j.neurobiolaging.2022.03.011 · Cited by 61
Patel, T., Carnwath, T., Wang, X., Allen, M., Lincoln, S., Lewis‐Tuffin, L. J., Quicksall, Z., Lin, S., Tutor‐New, F. Q., Ho, C. C. G., et al. (2022) · Aging Cell · doi:10.1111/acel.13606 · Cited by 61
Xu, Y., Au, N. P. B., & Ma, C. H. E. (2022) · Frontiers in Aging Neuroscience · doi:10.3389/fnagi.2022.896852 · Cited by 68
Cell type-specific changes identified by single-cell transcriptomics in Alzheimer’s disease
Luquez, T., Gaur, P., Kosater, I. M., Lam, M., Lee, D. I., Mares, J. A., Paryani, F., Yadav, A., & Menon, V. (2022) · Genome Medicine · doi:10.1186/s13073-022-01136-5 · Cited by 64
Zhou, Y., Tada, M., Cai, Z., Andhey, P. S., Swain, A., Miller, K. R., Gilfillan, S., Artyomov, M. N., Takao, M., Kakita, A., et al. (2023) · Nature Immunology · doi:10.1038/s41590-022-01403-y · Cited by 62
Immunotherapy-related cognitive impairment after CAR T cell therapy in mice
Geraghty, A. C., Acosta-Alvarez, L., Rotiroti, M. C., Dutton, S., O’Dea, M. R., Kim, W., Trivedi, V., Mancusi, R. A., Shamardani, K., Malacon, K. E., et al. (2025) · Cell · doi:10.1016/j.cell.2025.03.041 · Cited by 64
Rajani, R. M., Ellingford, R., Hellmuth, M., Harris, S. S., Taso, O. S., Graykowski, D., Lam, F. K. W., Arber, C., Fertan, E., Danial, J. S. H., et al. (2024) · PLOS Biology · doi:10.1371/journal.pbio.3002727 · Cited by 62
“Human single nucleus RNA sequencing data from Mathys and colleagues [5] and Lake and colleagues [12] were obtained from The Myeloid Landscape 2 portal (http://research-pub.gene.com/BrainMyeloidLandscape) [70].”
MethodInflammation promotes synucleinopathy propagation
Kim, T.-K., Bae, E.-J., Jung, B. C., Choi, M.-S., Shin, S. J., Park, S. J., Kim, J. T., Jung, M. K., Ulusoy, A., Song, M., et al. (2022) · Experimental & Molecular Medicine · doi:10.1038/s12276-022-00895-w · Cited by 61
Triglyceride metabolism controls inflammation and microglial phenotypes associated with APOE4
Stephenson, R. A., Sepulveda, J., Johnson, K. R., Lita, A., Gopalakrishnan, J., Acri, D. J., Beilina, A., Cheng, L., Yang, L. G., Root, J. T., et al. (2025) · Cell Reports · doi:10.1016/j.celrep.2025.115961 · Cited by 55
Omics-based biomarkers discovery for Alzheimer's disease
Aerqin, Q., Wang, Z.-T., Wu, K., He, X., Dong, Q., & Yu, J. (2022) · Cellular and Molecular Life Sciences · doi:10.1007/s00018-022-04614-6 · Cited by 56
Reich, M., Paris, I., Ebeling, M., Dahm, N., Schweitzer, C., Reinhardt, D., Schmucki, R., Prasad, M., Köchl, F., Leist, M., et al. (2021) · Frontiers in Immunology · doi:10.3389/fimmu.2020.617860 · Cited by 49
Symptomatic, Genetic, and Mechanistic Overlaps between Autism and Alzheimer’s Disease
Nadeem, M. S., Hosawi, S. B. I., Alshehri, S., Ghoneim, M. M., Imam, S. S., Murtaza, B. N., & Kazmi, I. A. (2021) · Biomolecules · doi:10.3390/biom11111635 · Cited by 60
Park, J., Kim, H., Kim, J., & Cheon, M. (2020) · PLoS Computational Biology · doi:10.1371/journal.pcbi.1008099 · Cited by 51
Chronic peripheral inflammation: a possible contributor to neurodegenerative diseases
Süβ, P., Lana, A. J., & Schlachetzki, J. C. M. (2021) · Neural Regeneration Research · doi:10.4103/1673-5374.306060 · Cited by 55
Appleton, J., Finn, Q., Zanotti-Fregonara, P., Yu, M., Faridar, A., Nakawah, M. O., Zarate, C., Carrillo, M. C., Dickerson, B. C., Rabinovici, G. D., et al. (2025) · Brain · doi:10.1093/brain/awae234 · Cited by 58
Altered oligodendroglia and astroglia in chronic traumatic encephalopathy
Chancellor, K. B., Chancellor, S. E., Duke-Cohan, J. E., Huber, B. R., Stein, T. D., Alvarez, V. E., Okaty, B. W., Dymecki, S. M., & McKee, A. C. (2021) · Acta Neuropathologica · doi:10.1007/s00401-021-02322-2 · Cited by 51
Characterizing the landscape of gene expression variance in humans
Wolf, S., Melo, D., Garske, K. M., Pallares, L. F., Lea, A. J., & Ayroles, J. F. (2023) · PLoS Genetics · doi:10.1371/journal.pgen.1010833 · Cited by 52
Berdowski, W. M., van der Linde, H. C., Breur, M., Oosterhof, N., Beerepoot, S., Sanderson, L. E., Wijnands, L. I., de Jong, P., Tsai-Meu-Chong, E., de Valk, W. G., et al. (2022) · Acta Neuropathologica · doi:10.1007/s00401-022-02440-5 · Cited by 52
Implications of glial metabolic dysregulation in the pathophysiology of neurodegenerative diseases
Afridi, R., Rahman, M. H., & Suk, K. (2022) · Neurobiology of Disease · doi:10.1016/j.nbd.2022.105874 · Cited by 53
You, J., Youssef, M., Santos, J. R., Lee, J., & Park, J. (2023) · Biology · doi:10.3390/biology12101307 · Cited by 60
Tillmon, H., Soteros, B. M., Shen, L., Cong, Q., Wollet, M., General, J., Chin, H., Lee, J. B., Carreno, F. R., Morilak, D. A., et al. (2024) · Nature Communications · doi:10.1038/s41467-024-54007-5 · Cited by 58
Spatial proteomics of Alzheimer’s disease-specific human microglial states
Mrdjen, D., Cannon, B. J., Amouzgar, M., Kim, Y., Liu, C. C., Vijayaragavan, K., Fullaway, C. C., Spence, A., McCaffrey, E., Bharadwaj, A., et al. (2025) · Nature Immunology · doi:10.1038/s41590-025-02203-w · Cited by 58
Self-citationDisease-associated microglia in neurodegenerative diseases: Friend or foe?
Cheng, Y.-H., & Ho, M. S.-C. (2025) · PLoS Biology · doi:10.1371/journal.pbio.3003426 · Cited by 57
S100A4 in the Physiology and Pathology of the Central and Peripheral Nervous System
D’Ambrosi, N., Milani, M., & Apolloni, S. (2021) · Cells · doi:10.3390/cells10040798 · Cited by 55
Metadata
- Authors
- Srinivasan, K., Friedman, B. A., Etxeberria, A., Huntley, M. A., van der Brug, M. P., Foreman, O., Paw, J. S., Modrusan, Z., Beach, T. G., Serrano, G. E., & Hansen, D. V.
- Affiliations
- Genentech (US)
- Banner Sun Health Research Institute (US)
- Corresponding author
- Friedman, Brad A.
- Hansen, David V.
- ORCID
- Venue
- Cell Reports
- Publisher
- Elsevier BV
- Published
- 2020-06
- Volume
- 31
- Issue
- 13
- Pages
- 107843
- ISSN
- 2211-1247 (ISSN-L)
- PMC
- PMC7422733
- OpenAlex
- W3039072393
- Semantic Scholar
- 161193b958b5ad9f3c708d4d10a0ed89678d1d84
- Cited by
- 427
- References
- 52
- Citations by year
- 2026: 55 · 2025: 60 · 2024: 68 · 2023: 61 · 2022: 74 · 2021: 89 · 2020: 18
- FWCI
- 24.01
- Type
- journal article
- Language
- en
- Open access
- gold
- doi.org
- Licence
- Locations
- Cell Reports (publishedVersion, cc-by)
- bioRxiv (Cold Spring Harbor Laboratory) (acceptedVersion, cc-by-nd)
- PubMed (publishedVersion)
- PubMed Central (acceptedVersion, cc-by)
- DOAJ (DOAJ: Directory of Open Access Journals) (submittedVersion, cc-by-sa)
- Funders
- Michael J. Fox Foundation for Parkinson's Research (GSE125050, GSE125583)
- Genentech
- Arizona Department of Health Services (211002)
- Arizona Biomedical Research Commission (0011, 05-901, 1001, 4001)
- National Institute on Aging (P30 AG19610)
- National Institute of Neurological Disorders and Stroke (U24 NS072026)
- Topics
- Life Sciences › Neuroscience › Neurology › Neuroinflammation and Neurodegeneration Mechanisms
- Life Sciences › Neuroscience › Cellular and Molecular Neuroscience › Alzheimer's disease research and treatments
- Life Sciences › Biochemistry, Genetics and Molecular Biology › Molecular Biology › Single-cell and spatial transcriptomics
- Keywords
- Alzheimer's disease, human microglia, microglial activation, aging, apolipoprotein E, transcriptome, single-nucleus RNA sequencing, single-cell RNA sequencing, mouse model, neuroinflammation
- MeSH terms
- Aged, Aged, 80 and over, Alzheimer Disease, Animals, Female, Frontal Lobe, Frozen Sections, Humans, Male, Monocytes, Multiple Sclerosis, Phenotype, Risk Factors, Temporal Lobe, Reproducibility of Results, Transcriptional Activation, Cellular Senescence, Microglia, Genetic Predisposition to Disease, Gene Expression Profiling, Databases, Genetic, Mice, Heterografts
About these checks
Registry, retraction, Cites and statistics results are computed, not judged, with one exception: a printed reference that no index lists is read once by a model before it counts as a citation error. Claims are extracted by a model and kept only when their quote appears verbatim in the text; each cited source is then checked, with a model’s help, for whether it says what the claim relies on. Those verdicts can be wrong — read the claim’s quote and the cited source before relying on one.
A language model drew the claims from the paper on 2026-10-07, under version 3 of the claim definition (model deepseek-v4.1-flash, prompt extract-v3).
A second model labelled each claim on 2026-10-07 (model jev-1.13-20260917, definition revision gold-guideline-v0.2).
Statistics and arithmetic are recomputed, not judged.
Confidence bands are shown only for fields calibrated on our annotated test set. None is calibrated yet, so no band is shown.
What counts as a claim ›How we measure confidence ›How we check this ›
Are you an author, or do you see a problem with this page? Request a review
