

The DOI matches its Crossref record; 49 of the 49 references it cites were found in a registry or an index.
Local Production of Osteoprotegerin by Osteoblasts Suppresses Bone Resorption
Open accessAbstract
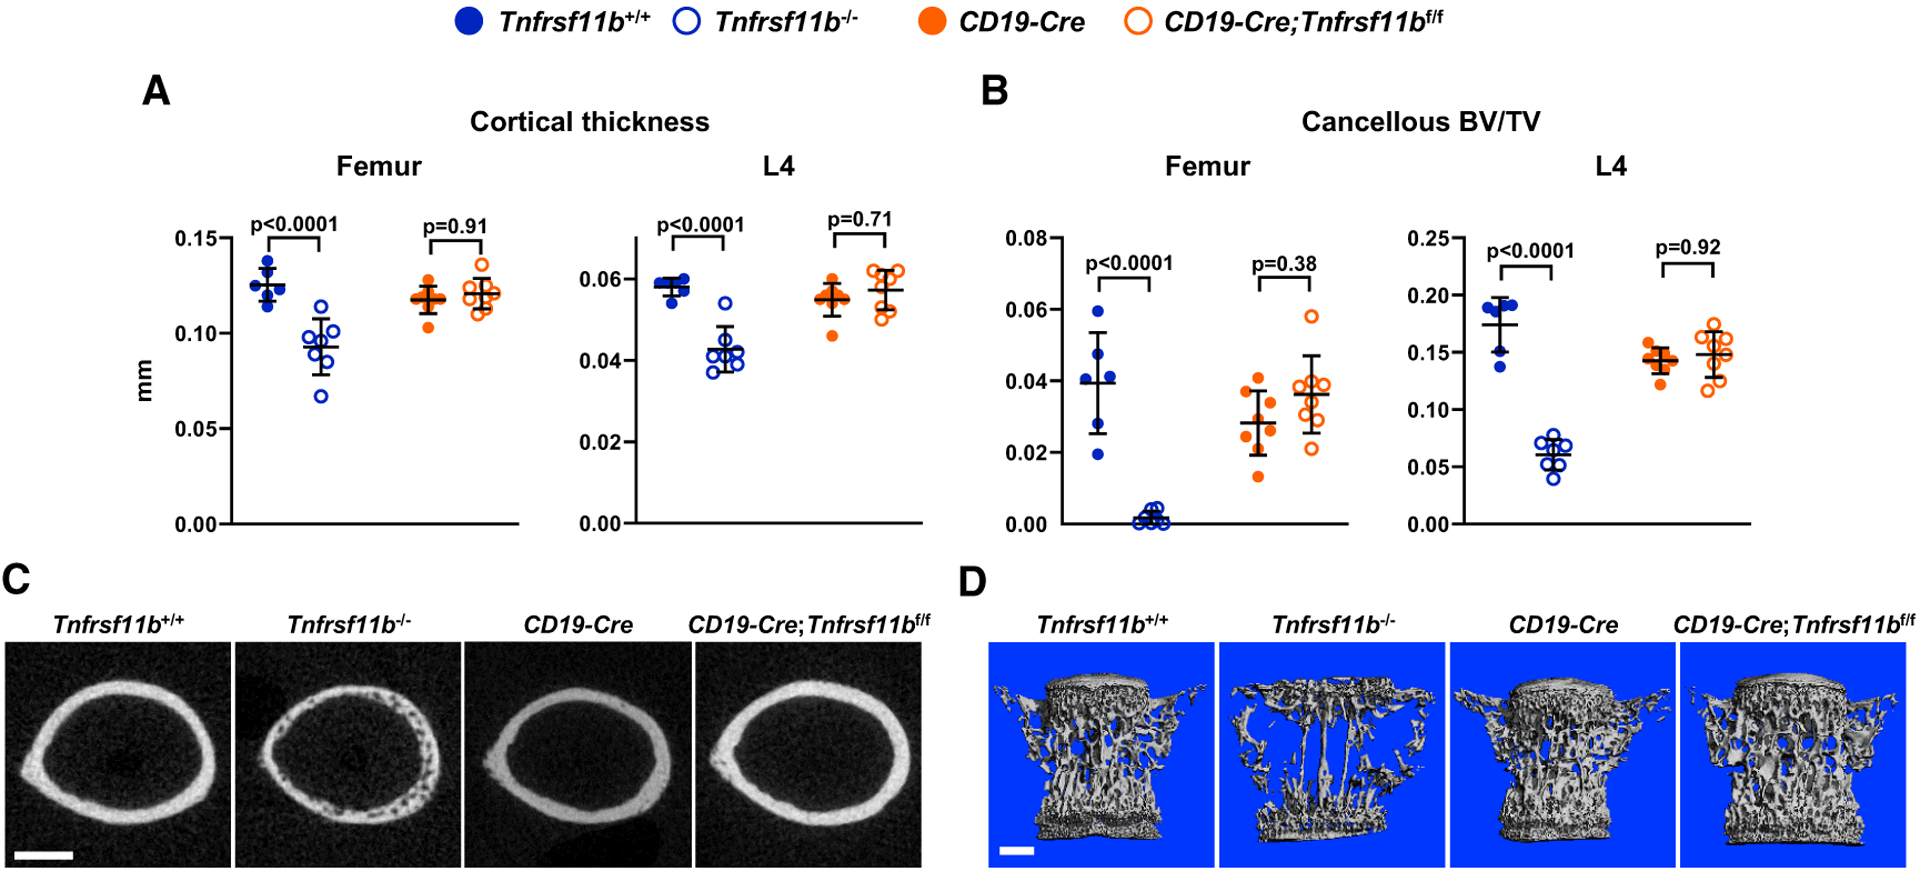
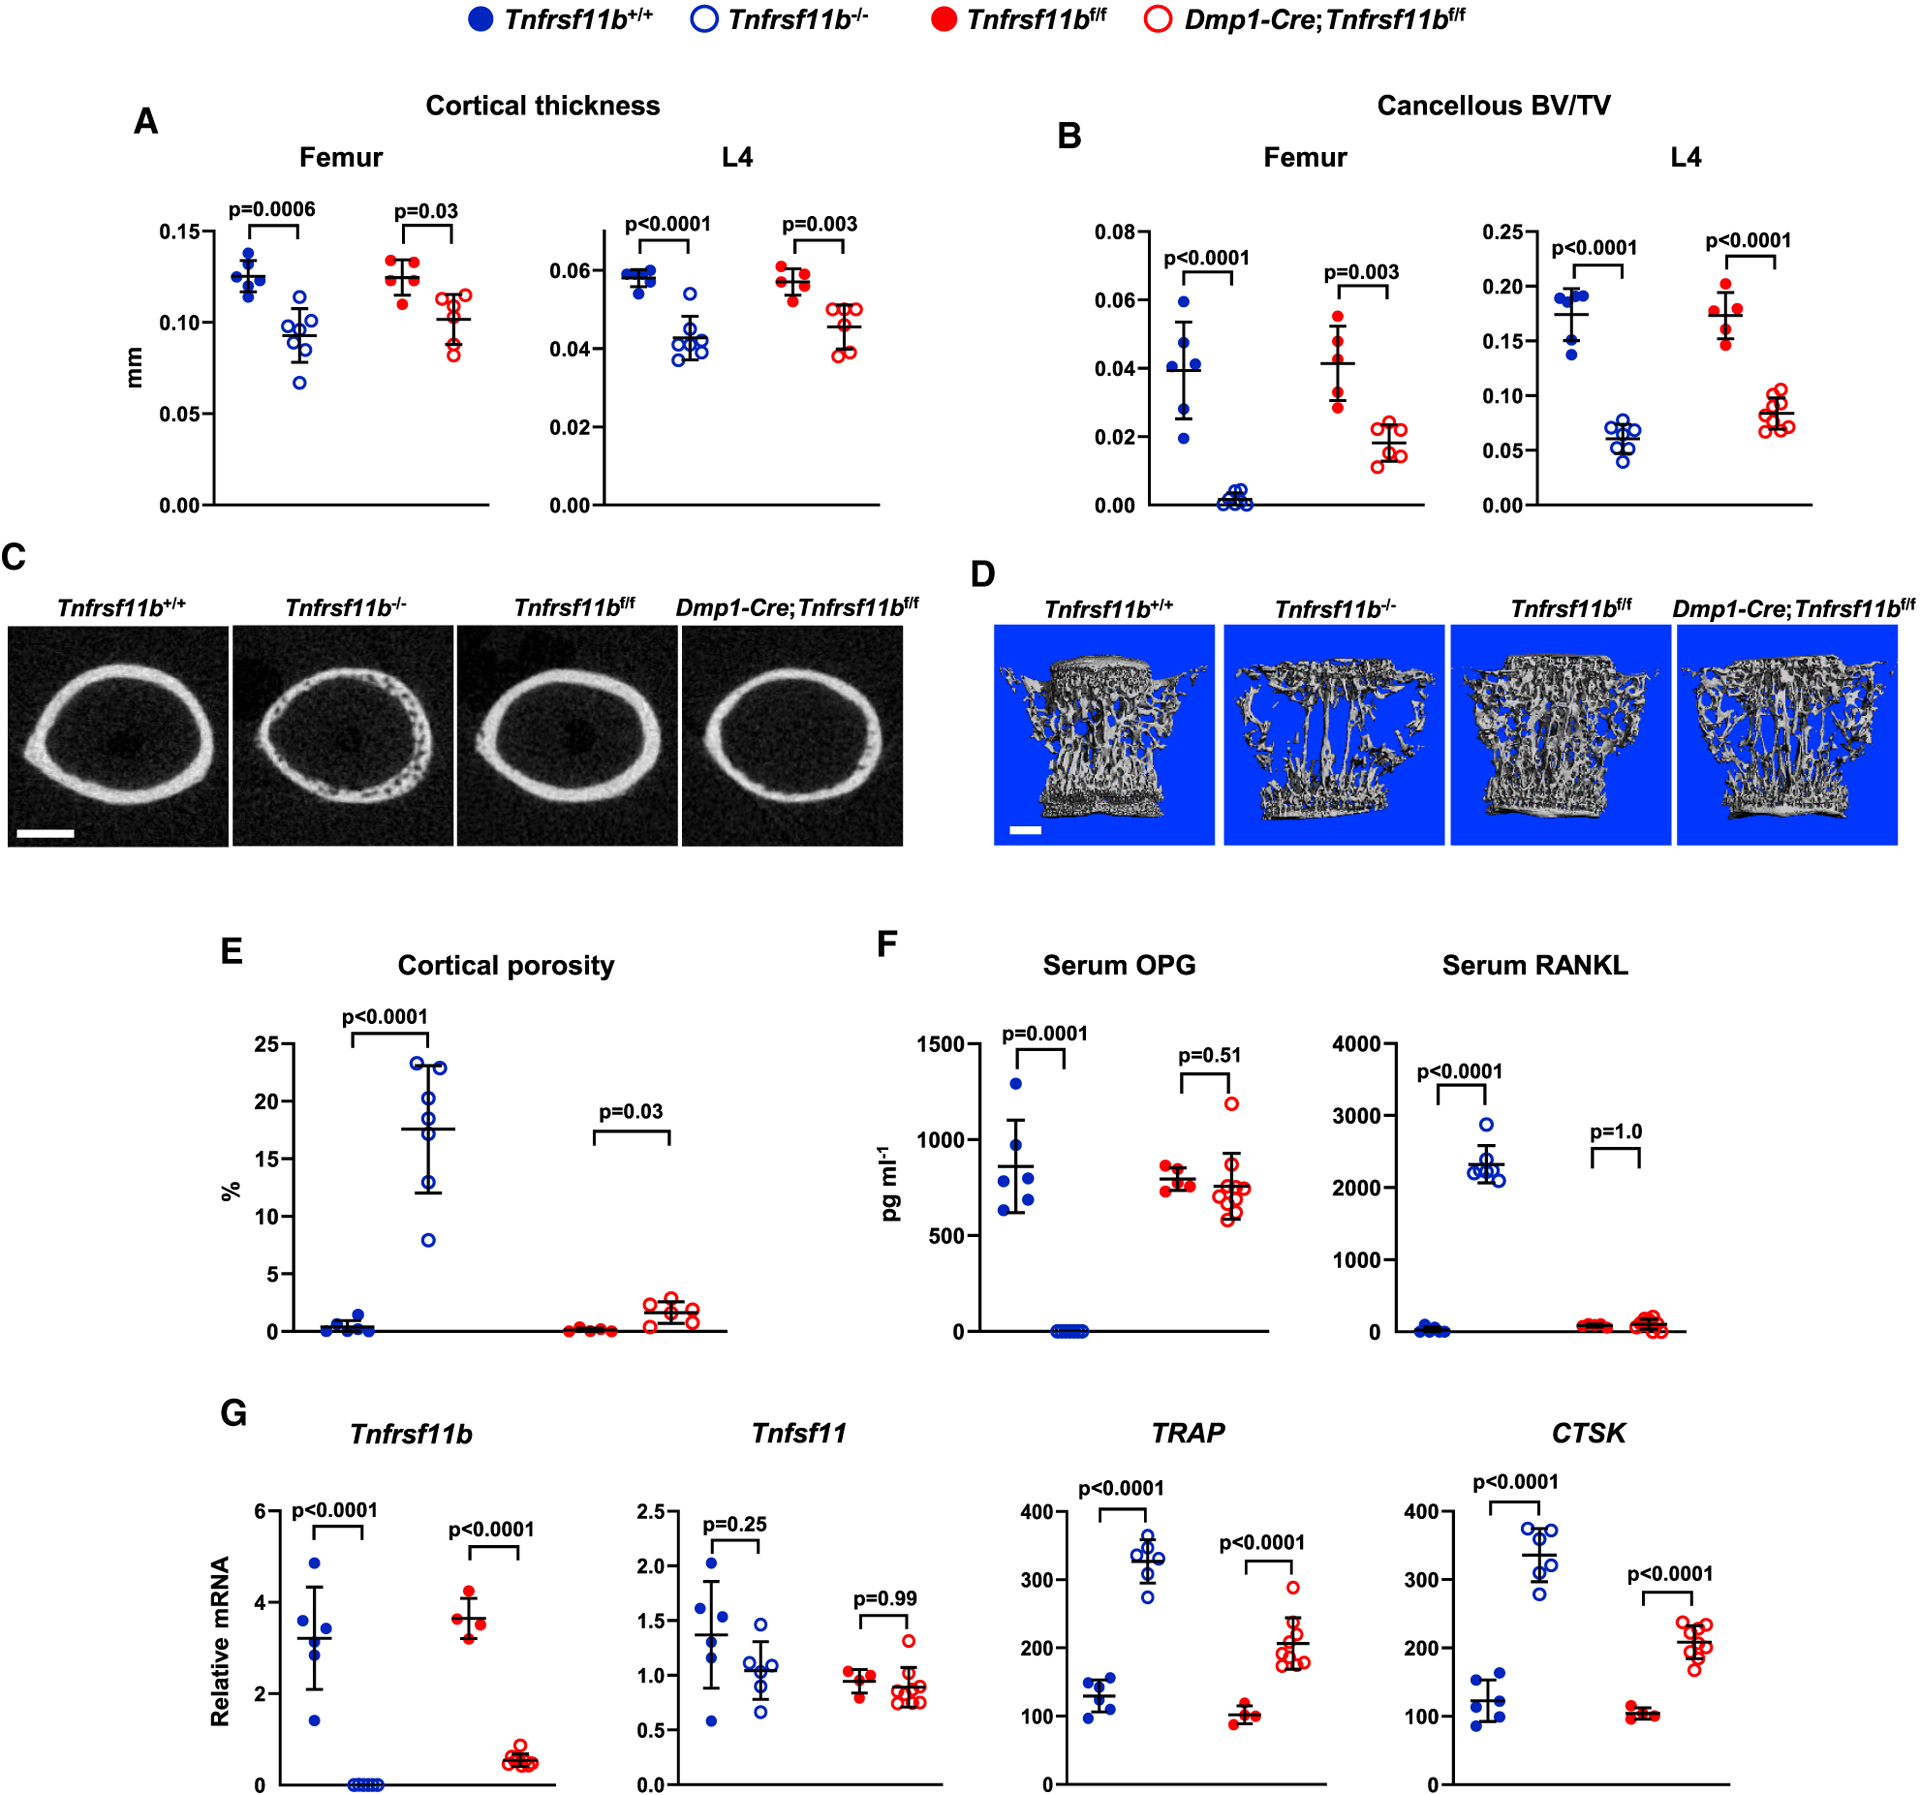
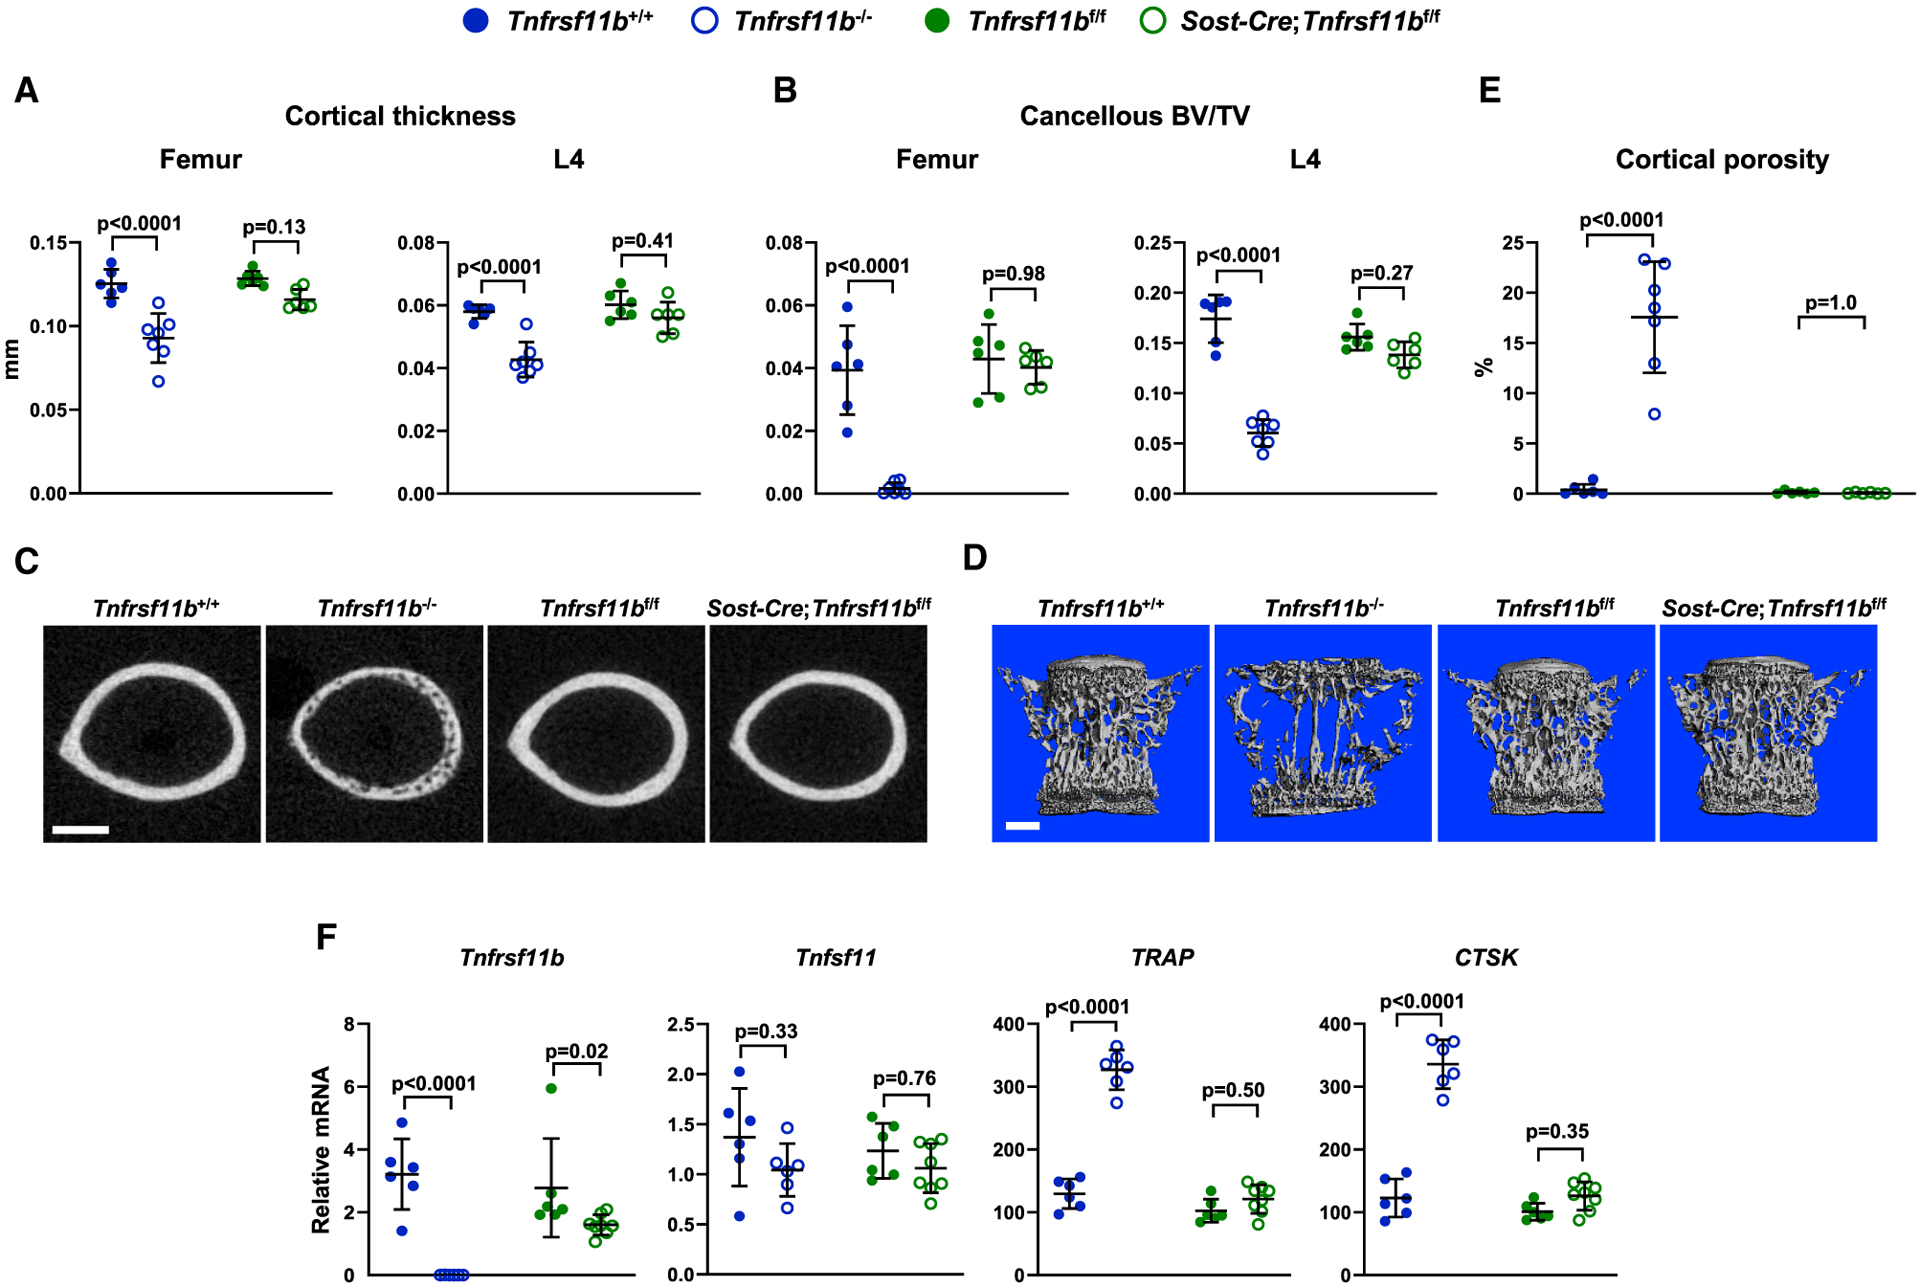
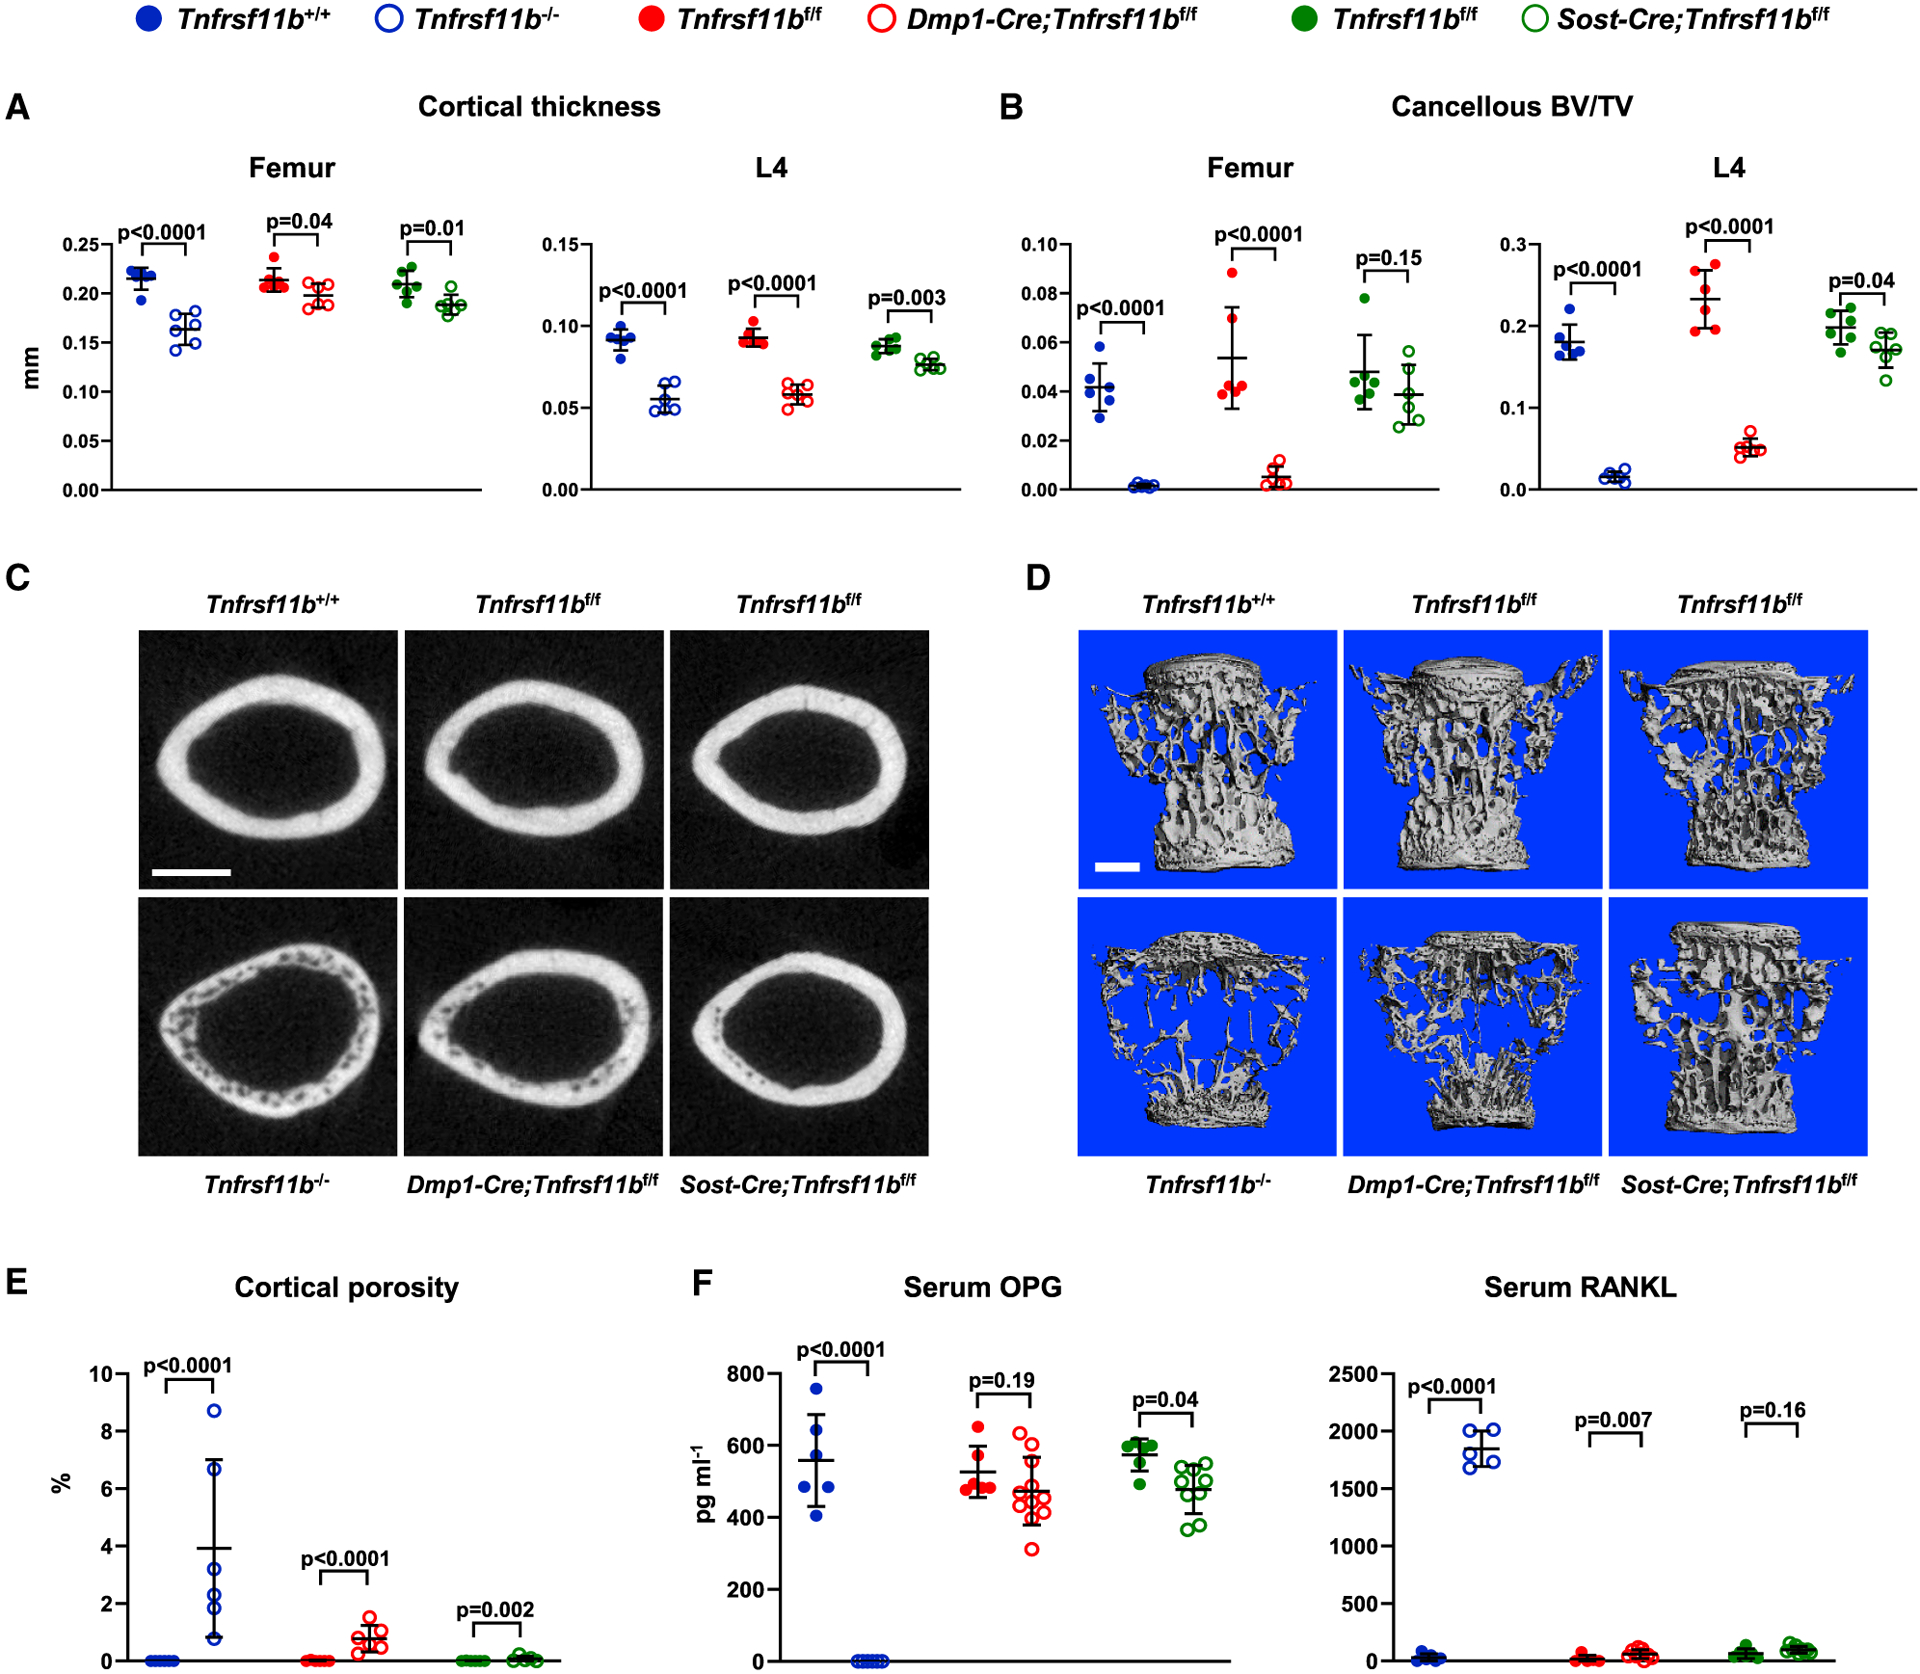
Osteoprotegerin (OPG) inhibits the ability of receptor activator of nuclear factor κB (NF-κB) ligand (RANKL) to stimulate the differentiation, activity, and survival of bone-resorbing osteoclasts. Genetic studies in mice show that osteocytes are an important source of RANKL, but the cellular sources of OPG are unclear. We use conditional deletion of Tnfrsf11b, which encodes OPG, from different cell populations to identify functionally relevant sources of OPG in mice. Deletion from B lymphocytes and osteocytes, two cell types commonly thought to supply OPG, has little or no impact on bone mass. By contrast, deletion of Tnfrsf11b from osteoblasts increases bone resorption and reduces bone mass to an extent similar to germline deletion, demonstrating that osteoblasts are an essential source of OPG. These results suggest that, in addition to producing new bone matrix, osteoblasts also play an active role in terminating the resorption phase of the bone remodeling cycle by suppressing RANKL activity.
Overview
The claims and statistics of this paper haven’t been checked yet.
Run the check — free, no account needed. It reads the open-access text and checks the sources it cites.
Integrity signals
Registry
Cites
Statistics
Figures
Verification
Claims the paper makes
The claims and statistics of this paper haven’t been checked yet.
Run the check — free, no account needed. It reads the open-access text and checks the sources it cites.
Claims other papers make about this one
Each is checked against this paper’s own text: does it say what the citing paper says it does?
The source backs part of the claim, not all of it — or backs it for a different population, condition or comparison.
In the citing paper
“Furthermore, T cells signal to B cells to induce OPG expression [76, 77].”
From Osteoimmunology of Fracture Healing. (2024) · cites this paper as [76]
Experimental — accuracy not yet measuredIn the citing paper
“Nevertheless, OPG released by mature osteoblasts and/or osteocytes may constitute the termination signal of the resorption phase in the remodeling cycle.77”
From Bone remodeling: an operational process ensuring survival and bone mechanical competence (2022) · cites this paper as [77]
In the citing paper
“This inhibitory activity is mandatory for the correct shift from bone resorption to bone formation and protects newly formed bone against untimely resorption.77”
From Bone remodeling: an operational process ensuring survival and bone mechanical competence (2022) · cites this paper as [77]
In the citing paper
“Cawley’s study stressed the concept “that the local concentration of OPG near the cell surface is a key factor in its ability to block the activity of RANKL”.”
From Bone remodeling: an operational process ensuring survival and bone mechanical competence (2022) · cites this paper as [77]
In the citing paper
“Hence, osteocytes can be considered dynamic cells capable of reconstituted mechanical sensitivity after replacement293 as well as the inhibitory control over osteoclastogenesis via the local production of OPG.77”
From Bone remodeling: an operational process ensuring survival and bone mechanical competence (2022) · cites this paper as [77]
In the citing paper
“Moreover, as cells mature, they secrete more ECM and exert local inhibitory control over osteoclastogenesis by releasing the osteoclastogenic inhibitor OPG.77”
From Bone remodeling: an operational process ensuring survival and bone mechanical competence (2022) · cites this paper as [77]
In the citing paper
“Osteoblasts are considered the major sources of OPG in cancellous bone, acting in concert with osteocytes and other cells to modulate the RANKL/RANK ratio and reduce resorption by osteoclasts.”
From Bone remodeling: an operational process ensuring survival and bone mechanical competence (2022) · cites this paper as [77]
Self-check
Percentages, sums and reported differences re-computed from the paper’s own numbers.
The self-check needs the paper’s full text.
Citations
Cites
Analysis of Relative Gene Expression Data Using Real-Time Quantitative PCR and the 2−ΔΔCT Method
Livak, K. J., & Schmittgen, T. D. (2001) · Methods · doi:10.1006/meth.2001.1262 · Cited by 180,860
A robust and high-throughput Cre reporting and characterization system for the whole mouse brain
Madisen, L., Zwingman, T. A., Sunkin, S. M., Oh, S. W., Zariwala, H. A., Gu, H., Ng, L. L., Palmiter, R. D., Hawrylycz, M. J., Jones, A. R., et al. (2010) · Nature Neuroscience · doi:10.1038/nn.2467 · Cited by 6,907
Osteoprotegerin ligand is a cytokine that regulates osteoclast differentiation and activation.
Lacey, D. L., Timms, E., Tan, H.-L., Kelley, M. J., Dunstan, C. R., Burgess, T., Elliott, R., Colombero, A., Elliott, G., Scully, S., et al. (1998) · Cell · doi:10.1016/s0092-8674(00)81569-x · Cited by 5,439
Osteoprotegerin: a novel secreted protein involved in the regulation of bone density.
Simonet, W. S., Lacey, D. L., Dunstan, C. R., Kelley, M., Chang, M.-S., Lüthy, R., Nguyen, H. Q., Wooden, S., Bennett, L., Boone, T., et al. (1997) · Cell · doi:10.1016/s0092-8674(00)80209-3 · Cited by 5,130
Bone Resorption by Osteoclasts
Teitelbaum, S. L. (2000) · Science · doi:10.1126/science.289.5484.1504 · Cited by 3,962
OPGL is a key regulator of osteoclastogenesis, lymphocyte development and lymph node organogenesis.
Kong, Y.-Y., Yoshida, H., Sarosi, I., Tan, H.-L., Timms, E., Capparelli, C., Morony, S., Oliveira-dos-Santos, A. J., Van, G., Itie, A., et al. (1999) · Nature · doi:10.1038/16852 · Cited by 3,351
Osteoprotegerin-deficient mice develop early onset osteoporosis and arterial calcification.
Bucay, N., Sarosi, I., Dunstan, C. R., Morony, S., Tarpley, J., Capparelli, C., Scully, S., Tan, H. L., Xu, W., Lacey, D. L., et al. (1998) · Genes & Development · doi:10.1101/gad.12.9.1260 · Cited by 2,483
Kitamura, D., Roes, J., Kühn, R., & Rajewsky, K. (1991) · Nature · doi:10.1038/350423a0 · Cited by 1,783
Evidence for osteocyte regulation of bone homeostasis through RANKL expression
Nakashima, T., Hayashi, M., Fukunaga, T., Kurata, K., Oh-hora, M., Feng, J. Q., Bonewald, L. F., Kodama, T., Wutz, A., Wagner, E. F., et al. (2011) · Nature Medicine · doi:10.1038/nm.2452 · Cited by 1,778
The molecular understanding of osteoclast differentiation
Asagiri, M., & Takayanagi, H. (2007) · Bone · doi:10.1016/j.bone.2006.09.023 · Cited by 1,363
Cited by
Sorted by citations
Bone remodeling: an operational process ensuring survival and bone mechanical competence
Bolamperti, S., Villa, I., & Rubinacci, A. (2022) · Bone Research · doi:10.1038/s41413-022-00219-8 · Cited by 482
The osteocyte as a signaling cell
Delgado‐Calle, J., & Bellido, T. (2021) · Physiological Reviews · doi:10.1152/physrev.00043.2020 · Cited by 280
Osteoclasts, Master Sculptors of Bone
Novack, D. V., & O’Brien, C. A. (2022) · Annual Review of Pathology Mechanisms of Disease · doi:10.1146/annurev-pathmechdis-031521-040919 · Cited by 208
Self-citationRANKL as the master regulator of osteoclast differentiation
Takayanagi, H. (2021) · Journal of Bone and Mineral Metabolism · doi:10.1007/s00774-020-01191-1 · Cited by 175
Targeting strategies for bone diseases: signaling pathways and clinical studies
Xu, H., Wang, W., Liu, X., Huang, W. H., Chen, Z., Xu, Y., Yang, H., Bai, J., & Geng, D. (2023) · Signal Transduction and Targeted Therapy · doi:10.1038/s41392-023-01467-8 · Cited by 177
Metadata
- Authors
- Cawley, K. M., Bustamante-Gomez, N. C., Guha, A. G., MacLeod, R. S., Xiong, J., Gubrij, I., Liu, Y., Mulkey, R., Palmieri, M., Thostenson, J. D., Goellner, J. J., & O’Brien, C. A.
- Affiliations
- University of Arkansas for Medical Sciences (US)
- Central Arkansas Veterans Healthcare System (US)
- Corresponding author
- O’Brien, Charles A.
- ORCID
- Venue
- Cell Reports
- Publisher
- Elsevier BV
- Published
- 2020-09
- Volume
- 32
- Issue
- 10
- Pages
- 108052
- ISSN
- 2211-1247 (ISSN-L)
- PMC
- PMC7493998
- OpenAlex
- W3084164734
- Cited by
- 114
- References
- 49
- Citations by year
- 2026: 15 · 2025: 18 · 2024: 15 · 2023: 20 · 2022: 28 · 2021: 13 · 2020: 5
- FWCI
- 5.35
- Type
- journal article
- Language
- en
- Update notices
- erratum (2025-06-24)
- Open access
- gold
- doi.org
- Licence
- Locations
- Cell Reports (publishedVersion, cc-by-nc-nd)
- PubMed (publishedVersion)
- PubMed Central (acceptedVersion, cc-by-nc-nd)
- Funders
- U.S. Department of Veterans Affairs (I01 BX000294)
- University of Arkansas for Medical Sciences
- National Institutes of Health (R01AR049794, P20GM125503)
- Topics
- Life Sciences › Biochemistry, Genetics and Molecular Biology › Molecular Biology › Bone Metabolism and Diseases
- Health Sciences › Medicine › Orthopedics and Sports Medicine › Bone health and osteoporosis research
- Health Sciences › Medicine › Rheumatology › Osteomyelitis and Bone Disorders Research
- Keywords
- osteoprotegerin, osteoblasts, bone resorption, RANKL, osteocytes, B cells, bone remodeling, conditional gene deletion, bone mass, osteoclasts
- MeSH terms
- Animals, Cell Differentiation, Humans, Osteoblasts, Osteoclasts, Osteocytes, Bone Remodeling, Mice, Osteoprotegerin
About these checks
Registry, retraction, Cites and statistics results are computed, not judged, with one exception: a printed reference that no index lists is read once by a model before it counts as a citation error. Claims are extracted by a model and kept only when their quote appears verbatim in the text; each cited source is then checked, with a model’s help, for whether it says what the claim relies on. Those verdicts can be wrong — read the claim’s quote and the cited source before relying on one.
Statistics and arithmetic are recomputed, not judged.
Confidence bands are shown only for fields calibrated on our annotated test set. None is calibrated yet, so no band is shown.
What counts as a claim ›How we measure confidence ›How we check this ›
Are you an author, or do you see a problem with this page? Request a review
