

The DOI matches its Crossref record; 99 of the 99 references it cites were found in a registry or an index; 16 of the 54 sources its claims cite were checked for support.
A criterion-placement theory of face matching
Open accessAbstract
Face matching is an important applied task that requires binary decisions to pairs of face images to determine whether these depict the same person (an identity match) or different people (a mismatch). While these choices are mutually exclusive, performance for match and mismatch trials appears to be dissociable, which poses a problem for theory development. The current study demonstrates that this dissociation arises from systematic response biases, which reflect individual differences in the placement of decision-making thresholds to distinguish matches from mismatches. When these biases are controlled or partialled out from classification accuracy, reliable associations between match and mismatch identifications are found. This is demonstrated over two experiments with a sample of over 500 participants, several face-matching tests, and a series of data simulations. These findings support a cognitive theory in which individual differences in the placement of decision-making thresholds provide the mechanism by which the identification of face matches and mismatches are linked.
Overview
AI snapshot
Written from the paper’s full text.
TL;DR
The paper argues that the widely reported dissociation between face-match and face-mismatch accuracy is caused by individual differences in decision criterion placement. When criterion is controlled or partialled out, match and mismatch performance become positively correlated, supporting a unitary account of face matching.
Key findings
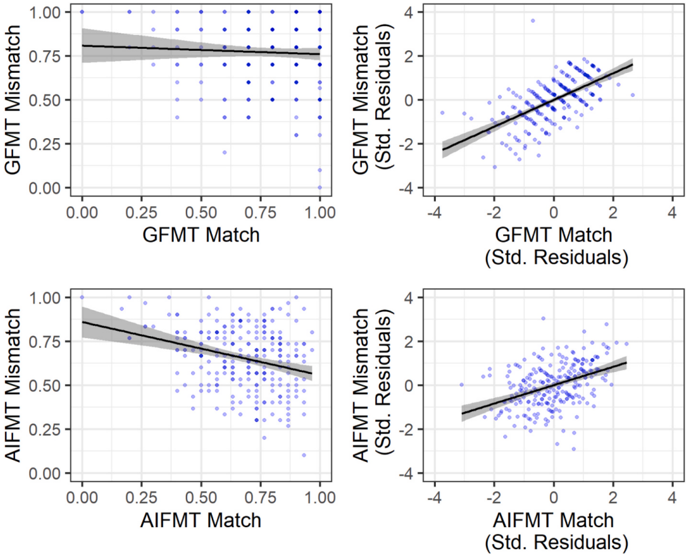
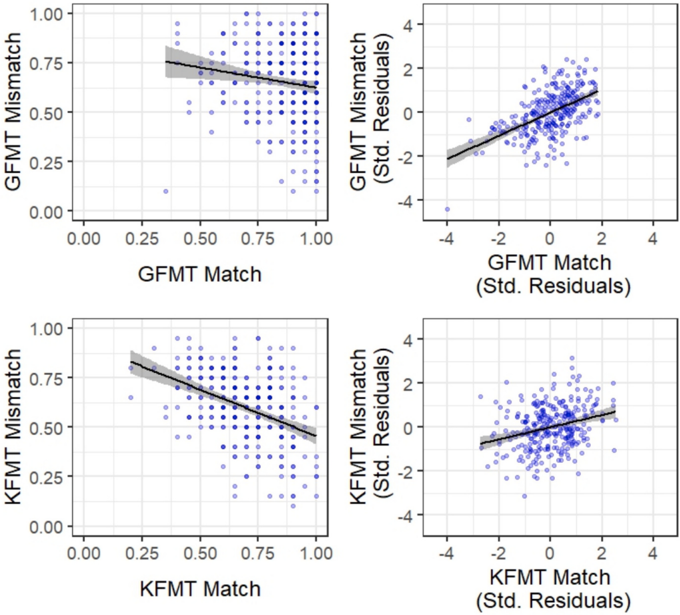
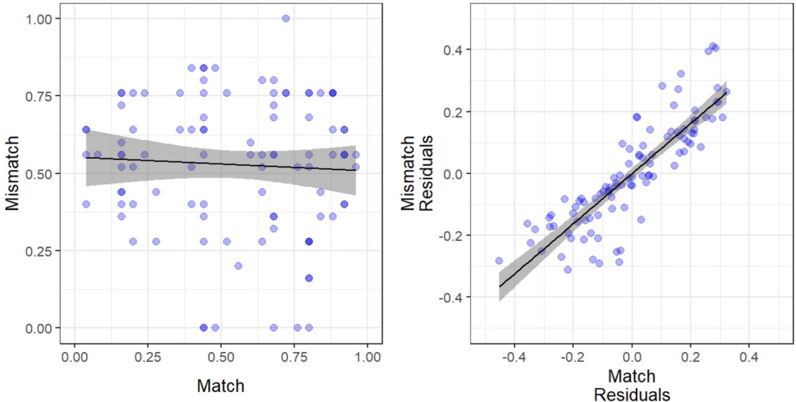
- Raw match and mismatch accuracy were unrelated or negatively related: Experiment 1 GFMT, r(247) = −0.05, p = 0.44; AIFMT, r(247) = −0.29, p < 0.001. Experiment 2 GFMT, r(297) = −0.15, p < 0.001; KFMT, r(297) = −0.42, p < 0.001.
- After partialling out criterion, match–mismatch correlations became positive: Experiment 1 GFMT, r(247) = 0.61, p < 0.001; AIFMT, r(247) = 0.42, p < 0.001. Experiment 2 GFMT, r(297) = 0.53, p < 0.001; KFMT, r(297) = 0.28, p < 0.001.
- Criterion was stable and transferred across tests: GFMT–AIFMT criterion correlation r = 0.59, p < 0.001; GFMT–KFMT criterion correlation r(297) = 0.55, p < 0.001.
- Simulations reproduced the pattern: when bias varied freely, match–mismatch correlation was negative, r = −0.06, p = 0.59; when bias was controlled, it was positive, r = 0.85, p < 0.001. Further simulations showed the direction of the correlation depends on the relative variability in bias versus ability, and that item- and participant-level biases can produce similar dissociations in old/new recognition.
Methods
- Experiment 1 analysed Session 1 data from 249 participants (female N = 166; age M = 22.56, SD = 4.29) who completed the GFMT-short and AIFMT. Accuracy was converted to signal detection measures d′ and criterion c; residual match and mismatch scores were computed after controlling for average criterion across tasks.
- Experiment 2 analysed 299 white undergraduate students (female n = 245; age M = 20.25, SD = 4.98) who completed the GFMT-short and KFMT. The same signal detection and residual-score approach was used, with criterion averaged across tests.
- Three simulations modelled participants’ ability and bias and item difficulty using truncated normal distributions. Simulation 1 replicated the experimental pattern; Simulation 2 varied the ratio of bias to ability variance and examined PCA outcomes; Simulation 3 modelled old/new recognition with participant- and item-level bias.
Limitations
- The paper states that future research should examine the origin of individual differences in criterion placement, and that whether the effects extend to familiar face recognition remains an open question.
- The paper notes that criterion shifts might also affect match–mismatch correlations, but whether this occurs when individual differences in criterion are present remains to be seen.
- Evident from the text: the experiments are correlational and rely on partialling rather than direct manipulation of criterion, so causal claims rest partly on simulations; the simulations use deterministic or lightly noised models with assumed distributions; and the human samples are mostly young university students or Prolific volunteers, limiting generalisability.
Model-written summary. Check it against the paper before relying on it.
Integrity signals
Registry
Cites
Statistics
Figures
Verification
Claims the paper makes
43 Own interpretation · 30 Own result · 16 Not checked yet · 8 Own method · 6 No full text of the sources · 4 Partly supported · 4 No basis given · 3 Supported so far · 2 Supported · 1 Not supported · 1 Sources not found · accuracy not yet measured
Every source the paper cites for this claim was checked and supports it.
In the paper
“These biases can be captured by recoding the accuracy of face-matching tasks into hits (correct responses on match trials) and false positives (incorrect responses on mismatch trials) and by converting these variables into the signal detection measures of d' (sensitivity) and criterion (see Stanislaw & Todorov, 1999).”
§ A criterion-placement theory of face matching > 1. Introduction
What the sources say
- Supportedcites Stanislaw & Todorov, 1999 source
The Yes/No Tasks section explains that hit and false-alarm rates reflect both sensitivity and response bias, with bias determined by the criterion. The Computational Examples section shows how responses become hit and false-alarm rates and how those rates yield d′ and criterion c. Applying that method to match and mismatch trials is consistent with the paper’s account. (LLM, conf=0.92)
plaindirect- Asserted: passes — The authors put it forward as true.
- Checkable: passes — It can be checked against evidence.
- Load-bearing: passes — The paper’s conclusions depend on it.
- Based: passes — The paper gives a reason why it holds.
- Supported
Every source the paper cites for this claim was checked and supports it.
In the paper
“This finding is remarkable considering strong by-item correlations for matches and mismatches of familiar identities, whereby faces that are easier to recognise as an identity match are also easier to reject when they do not match another person (Megreya & Burton, 2007).”
§ A criterion-placement theory of face matching > 1. Introduction
What the sources say
- Supportedcites Megreya & Burton, 2007 source
The Results report a large, significant by-item correlation between hits and false positives for familiarized faces (r = .60). The General Discussion describes the association as negative: faces easier to identify as matches were also easier to reject when absent. The study used briefly familiarized faces, rather than highly familiar identities. (LLM, conf=0.90)
boostedcorrelational- Asserted: passes — The authors put it forward as true.
- Checkable: passes — It can be checked against evidence.
- Load-bearing: unclear — It is unclear whether the paper’s conclusions depend on it.
- Based: passes — The paper gives a reason why it holds.
- Supported
The sources with a verdict support this claim; the rest weren’t checked yet, have no full text we could read, or their verdicts aren’t rated yet.
In the paper
“as well as the applied context in which face matching is studied (e.g., Bindemann et al., 2022;Feng & Burton, 2019, 2021;McCaffery & Burton, 2016;Tummon et al., 2019)”
§ A criterion-placement theory of face matching > 7. General discussion
What the sources say
- Supportedcites Bindemann et al., 2022 source
The “d′ and criterion” section reports a significantly more liberal response criterion in the Airport task than in the two laboratory face-matching tests. The General Discussion likewise says that presenting avatars in the airport context produced a bias toward falsely accepting identity mismatches. These passages support the claim that the applied context can influence criterion. (LLM, conf=0.94)
- Not checked — no full text of the sourcecites Feng & Burton, 2019 source
- Supportedcites McCaffery & Burton, 2016 source
The passage labelled “FIGURE 8 HERE PLEASE” states that embedding a face in an ID document biases viewers toward a ‘same person’ decision. This directly supports the claim that the applied context influences the face-matching decision criterion. (LLM, conf=0.93)
plaindirect- Asserted: passes — The authors put it forward as true.
- Checkable: passes — It can be checked against evidence.
- Load-bearing: unclear — It is unclear whether the paper’s conclusions depend on it.
- Based: passes — The paper gives a reason why it holds.
- Supported
The cited sources support only part of this claim — read each source’s verdict below.
In the paper
“Collectively, this can explain why match and mismatch performance and old/new performance is often uncorrelated in behavioural experiments (e.g., Fysh & Bindemann, 2023;Megreya & Burton, 2007;Megreya et al., 2011;Sauerland et al., 2016).”
§ A criterion-placement theory of face matching > 7. General discussion
What the sources say
- Partly supportedcites Fysh & Bindemann, 2023 sourceExperimental — accuracy not yet measured
The Introduction and Experiment 1 Discussion report that match and mismatch accuracy often lack a positive correlation. The General discussion also relates this dissociation to old/new face decisions, but explains it through different processes for accepting and rejecting faces—not variability in decision criterion. No page numbers are provided in our copy. (LLM, conf=0.86)
- Partly supportedcites Megreya & Burton, 2007 sourceExperimental — accuracy not yet measured
The Results and Discussion report uncorrelated performance on match and mismatch trials, and the paper describes a similar pattern in unfamiliar-face recognition. But the General Discussion treats a possible criterion shift as a question for future research, not an established explanation for those correlations. (LLM, conf=0.85)
- Could not verifycites Sauerland et al., 2016 sourceExperimental — accuracy not yet measured
The Introduction describes unfamiliar-face matching and choice blindness, while §3.2.2 examines confidence and detection of manipulated identity decisions. Neither passage addresses variability in decision criterion or a correlation between match/mismatch and old/new performance; searches for those terms and for matching versus recognition found no supporting passage in our copy. (LLM, conf=0.72)
plaindirect- Asserted: passes — The authors put it forward as true.
- Checkable: passes — It can be checked against evidence.
- Load-bearing: passes — The paper’s conclusions depend on it.
- Based: passes — The paper gives a reason why it holds.
- Partly supported
The cited sources support only part of this claim — read each source’s verdict below.
In the paper
“Second, it has long been observed that oldnew memory tasks that investigate face identification elicit a dissociation similar to that which is found in face matching tasks (e.g., Hancock et al., 1996aHancock et al., , 1996b;;Megreya & Burton, 2007;Vokey & Read, 1992).”
§ A criterion-placement theory of face matching > 6. Simulation 3
What the sources say
- Not matchedcites Hancock et al., 1996a
Couldn’t be matched to a paper in Crossref, so it can’t be checked.
- Supportedcites Megreya & Burton, 2007 source
The paper’s Abstract reports that old/new recognition-memory experiments with unfamiliar faces generally find no association between hits and false positives. Its Discussion reports a corresponding lack of correlation in face-matching trials and explicitly describes a similar dissociation in unfamiliar-face recognition. The support is specifically for unfamiliar faces. (LLM, conf=0.91)
- Partly supportedcites Vokey & Read, 1992 sourceExperimental — accuracy not yet measured
Experiments 2 and 3 tested old/new recognition using the same versus different photographs of a face. Table 3 in the General Discussion shows substantially lower recognition discrimination with different photographs. The paper does not compare this result with face-matching tasks, so it supports the recognition-task difference but not the claimed similarity between tasks. (LLM, conf=0.78)
boostedcorrelational- Asserted: passes — The authors put it forward as true.
- Checkable: passes — It can be checked against evidence.
- Load-bearing: passes — The paper’s conclusions depend on it.
- Based: passes — The paper gives a reason why it holds.
- Not matched
A result the paper reports from its own data — it cites no other source for it, so there is none to check. The quote shows it is in the paper.
In the paper
“When bias was allowed to vary, as is the case with the raw data in Experiments 1 and 2, performance on match and mismatch trials echoes the negative relationship between match and mismatch accuracy shown in Experiment 2, r = -0.06,p = 0.59.”
§ A criterion-placement theory of face matching > 4.2. Results
plaincorrelational- Asserted: passes — The authors put it forward as true.
- Checkable: passes — It can be checked against evidence.
- Load-bearing: passes — The paper’s conclusions depend on it.
- Based: passes — The paper gives a reason why it holds.
A result the paper reports from its own data — it cites no other source for it, so there is none to check. The quote shows it is in the paper.
In the paper
“performance for match and mismatch trials appears to be dissociable”
- Also stated in: § 2.2. Results · plain
“Match and mismatch accuracy were unrelated on the GFMT, r(247) = -0.05,p = 0.44, BF 10 = 0.11, and correlated negatively on the AIFMT, r(247) = -0.29,p < 0.001, BF 10 > 100.”
- Also stated in: § 3.2. Results · plain
“Match and mismatch accuracy correlated negatively on the GFMT, r(297) = -0.15,p < 0.001, BF 10 = 1.85, and on the KFMT, r(297) = -0.42,p < 0.001, B 10 > 100.”
§ A criterion-placement theory of face matching > Abstract
plainn = 500 ·- Asserted: passes — The authors put it forward as true.
- Checkable: passes — It can be checked against evidence.
- Load-bearing: passes — The paper’s conclusions depend on it.
- Based: passes — The paper gives a reason why it holds.
- Also stated in: § 2.2. Results · plain
A result the paper reports from its own data — it cites no other source for it, so there is none to check. The quote shows it is in the paper.
In the paper
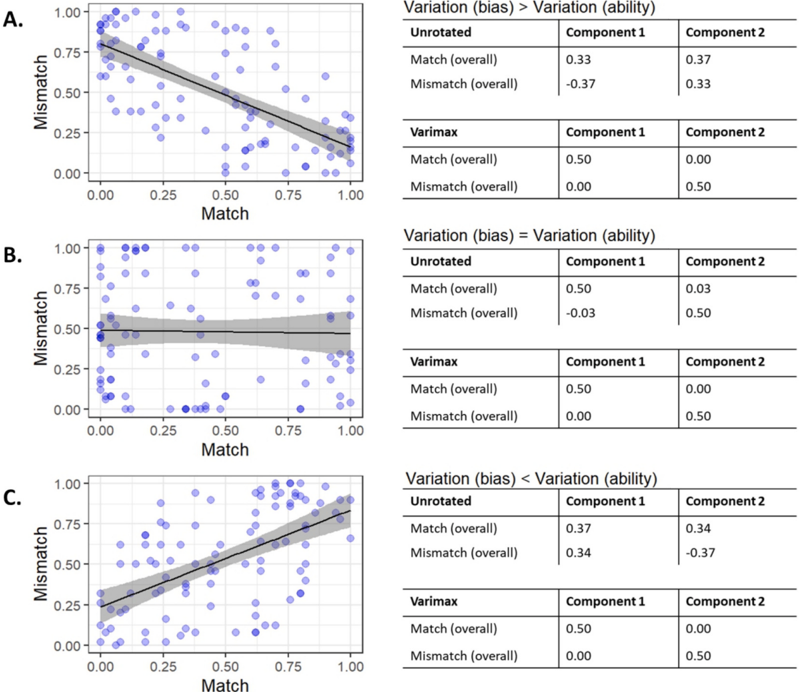
“As shown in Fig. 6B, when the simulation has equal variation in bias and ability (SDs = 0.10), there is little correlation between match and mismatch scores, r = -0.02,p = 0.84.”
§ A criterion-placement theory of face matching > 5.2. Results
plain- Asserted: passes — The authors put it forward as true.
- Checkable: passes — It can be checked against evidence.
- Load-bearing: passes — The paper’s conclusions depend on it.
- Based: passes — The paper gives a reason why it holds.
A result the paper reports from its own data — it cites no other source for it, so there is none to check. The quote shows it is in the paper.
In the paper
“As shown in Fig. 6A, when variability in simulated values are greater for bias (SD = 0.10) than ability (SD = 0.05), match and mismatch scores correlate negatively, r = -0.67,p < 0.001.”
§ A criterion-placement theory of face matching > 5.2. Results
plaincorrelational- Asserted: passes — The authors put it forward as true.
- Checkable: passes — It can be checked against evidence.
- Load-bearing: passes — The paper’s conclusions depend on it.
- Based: passes — The paper gives a reason why it holds.
A result the paper reports from its own data — it cites no other source for it, so there is none to check. The quote shows it is in the paper.
In the paper
“Finally, when the simulation has less variation in bias (SD = 0.05) than that for ability (SD = 0.10), as is the case for Fig. 6C, there is a strong positive correlation between match and mismatch performance, r = 0.55, p < 0.001.”
§ A criterion-placement theory of face matching > 5.2. Results
boostedcorrelational- Asserted: passes — The authors put it forward as true.
- Checkable: passes — It can be checked against evidence.
- Load-bearing: passes — The paper’s conclusions depend on it.
- Based: passes — The paper gives a reason why it holds.
- Probably not a substantial claim. 10
- It may state two separate claims as one. 33
- The quote only partly states this claim. 1
At least one cited source doesn’t support this claim or points to a different paper, and none confirmed it — see the verdicts below.
In the paper
“As reported in Baker et al. (2023), an additional four participants were tested, but were excluded for failing attention checks.”
§ A criterion-placement theory of face matching > 2.1.1. Participants
What the sources say
- Disputedcites Baker et al., 2023 sourceExperimental — accuracy not yet measured
The Methods > Participants passage says three additional participants were excluded for failing attention checks, not four. Procedure > Attention checks independently gives the exclusion count as n = 3. (LLM, conf=0.94)
Checked by a reasoning model — may be wrong.
plainn = 4- Asserted: passes — The authors put it forward as true.
- Checkable: passes — It can be checked against evidence.
- Load-bearing: fails — The paper’s conclusions may not depend on it.
- Based: passes — The paper gives a reason why it holds.
Probably not a substantial claim. The paper’s conclusions may not depend on it.
- Disputed
The sources with a verdict support this claim; the rest weren’t checked yet, have no full text we could read, or their verdicts aren’t rated yet.
In the paper
“Similar dissociations are seen in training effects for unfamiliar face matching, where instructions to attend to some features (e.g., the eyebrow regions) yields improved performance on match trials (Megreya & Bindemann, 2018), while increased attention to other features (e.g., facial marks such as moles and blemishes) improves performance on mismatch trials (Towler et al., 2021).”
§ A criterion-placement theory of face matching > 1. Introduction
What the sources say
- Supportedcites Megreya & Bindemann, 2018 source
The Experiment 1 Discussion says that eyebrow instructions enhanced accuracy and that the benefit was carried primarily by identity-match trials. The General discussion says the benefit was obtained only for identity matches. This supports the part of the sentence attributed to Megreya and Bindemann; the facial-marks finding is attributed to a different source. (LLM, conf=0.92)
- Not checked — no full text of the sourcecites Towler et al., 2021 source
plaindirect- Asserted: passes — The authors put it forward as true.
- Checkable: passes — It can be checked against evidence.
- Load-bearing: passes — The paper’s conclusions depend on it.
- Based: passes — The paper gives a reason why it holds.
It may state two separate claims as one.
- Supported
The cited sources support only part of this claim — read each source’s verdict below.
In the paper
“For example, in a recognition memory test for names, a naturally occurring bias to classify names as 'unfamiliar' reduces the mirror effect.”
§ A criterion-placement theory of face matching > 1. Introduction
What the sources say
- Supportedcites Hilford et al., 2015 source
The Conventional analysis reports a strong conservative bias for unfamiliar names: participants said “yes” to them less often, and the bias made the mirror effect appear to fail on the H/FA Index. Experiment 3 describes this as a bias that concealed the mirror effect; the paper does not claim the underlying effect disappeared. (LLM, conf=0.91)
- Partly supportedcites Glanzer et al., 2009 sourceExperimental — accuracy not yet measured
The Bias Effects section says a general bias toward “new” responses can weaken or eliminate the mirror effect. It does not identify a naturally occurring bias to classify names as unfamiliar. In the New/New Slope Correlation section, it reports that recognition experiments using name familiarity produced a mirror pattern, without linking those results to such a bias. Page numbers are unavailable in our copy. (LLM, conf=0.85)
plaindirect- Asserted: passes — The authors put it forward as true.
- Checkable: passes — It can be checked against evidence.
- Load-bearing: fails — The paper’s conclusions may not depend on it.
- Based: passes — The paper gives a reason why it holds.
Probably not a substantial claim. The paper’s conclusions may not depend on it.
- Supported
The cited sources support only part of this claim — read each source’s verdict below.
In the paper
“criterion is influenced by task difficulty and the relative frequency with which matches and mismatches occur (e.g., Baker & Bindemann, 2025;Stabile et al., 2024)”
§ A criterion-placement theory of face matching > 7. General discussion
What the sources say
- Partly supportedcites Baker & Bindemann, 2025 sourceExperimental — accuracy not yet measured
The Experiment 3 Discussion (page unavailable) reports that unequal match–mismatch base rates produced a more liberal decision-making criterion. The passages do not establish that task difficulty influences criterion; they discuss face matching as challenging but do not link difficulty to criterion shifts. (LLM, conf=0.85)
- Not checked — no full text of the sourcecites Stabile et al., 2024 source
plaindirect- Asserted: passes — The authors put it forward as true.
- Checkable: passes — It can be checked against evidence.
- Load-bearing: unclear — It is unclear whether the paper’s conclusions depend on it.
- Based: passes — The paper gives a reason why it holds.
It may state two separate claims as one.
- Partly supported
The sources with a verdict support this claim; the rest weren’t checked yet, have no full text we could read, or their verdicts aren’t rated yet.
In the paper
“Criterion shifts have been observed under a range of conditions, for example, when face matching is performed in an airport context (Bindemann et al., 2022), in response to costs, payoffs and unequal base rates (Baker & Bindemann, 2025;Stabile et al., 2024”
§ A criterion-placement theory of face matching > 7. General discussion
What the sources say
- Supportedcites Bindemann et al., 2022 source
The d′ and criterion section reports a more liberal response criterion in the virtual-airport task than in two laboratory face-matching tests. Bindemann et al. (2022) is cited for the airport-context example, not for the separately cited costs, payoffs, base rates, or image differences. The General Discussion notes that the study cannot isolate which features of the airport task produced the bias. (LLM, conf=0.92)
- Supportedcites Baker & Bindemann, 2025 source
The citation is attached to the costs, payoffs, and unequal-base-rate part of the citing sentence. The paper’s ‘Decision-making framing in facial image comparison’ section says that face-matching criterion shifts when matches and mismatches have unequal base rates and responses carry different costs; its Experiment 3 Discussion also reports a criterion shift under unequal base rates. No page numbers are available in our copy. (LLM, conf=0.91)
- Not checked — no full text of the sourcecites Stabile et al., 2024 source
plaincorrelational- Asserted: passes — The authors put it forward as true.
- Checkable: passes — It can be checked against evidence.
- Load-bearing: passes — The paper’s conclusions depend on it.
- Based: passes — The paper gives a reason why it holds.
It may state two separate claims as one.
- Supported
A result the paper reports from its own data — it cites no other source for it, so there is none to check. The quote shows it is in the paper.
In the paper
“The unrotated PCA detects that ability carries the most variance in scores, as is reflected by component 1 which has positive component loadings on both match and mismatch scores.The second component captures variations in bias.This is reflected by positive component loadings for match scores and negative loadings for mismatch scores.”
§ A criterion-placement theory of face matching > 5.2. Results
plaincorrelational- Asserted: passes — The authors put it forward as true.
- Checkable: passes — It can be checked against evidence.
- Load-bearing: passes — The paper’s conclusions depend on it.
- Based: passes — The paper gives a reason why it holds.
It may state two separate claims as one.
A result the paper reports from its own data — it cites no other source for it, so there is none to check. The quote shows it is in the paper.
In the paper
“In the unrotated PCA, the first component, which captures the larger source of variance, corresponds to bias.This is reflected by the positive component loadings for match scores and negative component loadings for mismatch scores.”
§ A criterion-placement theory of face matching > 5.2. Results
plaincorrelational- Asserted: passes — The authors put it forward as true.
- Checkable: passes — It can be checked against evidence.
- Load-bearing: passes — The paper’s conclusions depend on it.
- Based: passes — The paper gives a reason why it holds.
It may state two separate claims as one.
A result the paper reports from its own data — it cites no other source for it, so there is none to check. The quote shows it is in the paper.
In the paper
“The second component corresponds to ability.This is reflected by the positive component loadings for both match and mismatch scores.”
§ A criterion-placement theory of face matching > 5.2. Results
plaincorrelational- Asserted: passes — The authors put it forward as true.
- Checkable: passes — It can be checked against evidence.
- Load-bearing: unclear — It is unclear whether the paper’s conclusions depend on it.
- Based: passes — The paper gives a reason why it holds.
It may state two separate claims as one.
A result the paper reports from its own data — it cites no other source for it, so there is none to check. The quote shows it is in the paper.
In the paper
“This simulation replicates the findings with human participants in Experiments 1 and 2, by demonstrating that match and mismatch performance can be correlated negatively when bias values vary freely, but correlated positively when bias is controlled.”
§ A criterion-placement theory of face matching > 4.3. Discussion
boostedcorrelational- Asserted: passes — The authors put it forward as true.
- Checkable: passes — It can be checked against evidence.
- Load-bearing: passes — The paper’s conclusions depend on it.
- Based: passes — The paper gives a reason why it holds.
It may state two separate claims as one.
A result the paper reports from its own data — it cites no other source for it, so there is none to check. The quote shows it is in the paper.
In the paper
“We provide evidence that the placement of these decisionmaking thresholds is stable at the individual level and transfers across tests, by demonstrating split-half reliability and correlations of criterion values.”
§ A criterion-placement theory of face matching > 7. General discussion
boostedcorrelationaln = 550- Asserted: passes — The authors put it forward as true.
- Checkable: passes — It can be checked against evidence.
- Load-bearing: passes — The paper’s conclusions depend on it.
- Based: passes — The paper gives a reason why it holds.
It may state two separate claims as one.
A result the paper reports from its own data — it cites no other source for it, so there is none to check. The quote shows it is in the paper.
In the paper
“The first of these simulations reproduced the dissociation between match and mismatch performance when criterion is free to vary, and the positive relationship between match and mismatch accuracy when criterion is controlled.”
§ A criterion-placement theory of face matching > 7. General discussion
plaincorrelational- Asserted: passes — The authors put it forward as true.
- Checkable: passes — It can be checked against evidence.
- Load-bearing: passes — The paper’s conclusions depend on it.
- Based: passes — The paper gives a reason why it holds.
It may state two separate claims as one.
A result the paper reports from its own data — it cites no other source for it, so there is none to check. The quote shows it is in the paper.
In the paper
“the maximum amount that any individual match or mismatch score deviated from the reported value above was less than ± 0.10.”
§ A criterion-placement theory of face matching > 7. General discussion
plain- Asserted: passes — The authors put it forward as true.
- Checkable: passes — It can be checked against evidence.
- Load-bearing: fails — The paper’s conclusions may not depend on it.
- Based: passes — The paper gives a reason why it holds.
Probably not a substantial claim. The paper’s conclusions may not depend on it.
A result the paper reports from its own data — it cites no other source for it, so there is none to check. The quote shows it is in the paper.
In the paper
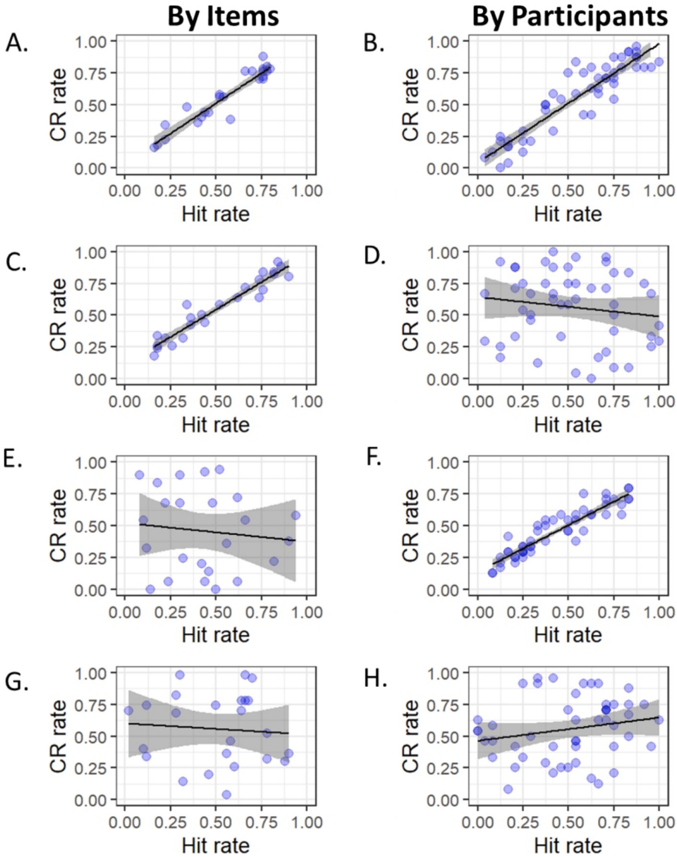
“When bias varies only at the participant level (C and D), there is no association between hits and correct rejections at the participant level (r = -0.15,p = 0.13) but a strong positive correlation at the item level (r = 0.92, p < 0.001).”
§ A criterion-placement theory of face matching > 6.2. Results
plaincorrelational- Asserted: passes — The authors put it forward as true.
- Checkable: passes — It can be checked against evidence.
- Load-bearing: passes — The paper’s conclusions depend on it.
- Based: passes — The paper gives a reason why it holds.
It may state two separate claims as one.
A result the paper reports from its own data — it cites no other source for it, so there is none to check. The quote shows it is in the paper.
In the paper
“Finally, when variability in bias is present at both the participant and the item levels (G and H), performance is not correlated either for items (r = -0.08,p = 0.71) or participants (r = 0.21, p = 0.15).”
§ A criterion-placement theory of face matching > 6.2. Results
plain- Asserted: passes — The authors put it forward as true.
- Checkable: passes — It can be checked against evidence.
- Load-bearing: passes — The paper’s conclusions depend on it.
- Based: passes — The paper gives a reason why it holds.
It may state two separate claims as one.
A result the paper reports from its own data — it cites no other source for it, so there is none to check. The quote shows it is in the paper.
In the paper
“When bias only varies at the item level (E and F), while there is a strong positive relationship between hits and correct rejections at the subject level (r = 0.87, p < 0.001), but the correlation is non-existent at the item level (r = -0.11,p = 0.60).”
§ A criterion-placement theory of face matching > 6.2. Results
boostedcorrelational- Asserted: passes — The authors put it forward as true.
- Checkable: passes — It can be checked against evidence.
- Load-bearing: passes — The paper’s conclusions depend on it.
- Based: passes — The paper gives a reason why it holds.
It may state two separate claims as one.
What the paper did — it cites no source for this, so there is none to check. The quote shows it is in the paper.
In the paper
“Four additional participants were excluded for recognising identities used in one of the other tests (n = 1) and inattention (i.e., repeatedly pressing the”
§ A criterion-placement theory of face matching > 3.1.1. Participants
plainn = 4- Asserted: passes — The authors put it forward as true.
- Checkable: passes — It can be checked against evidence.
- Load-bearing: fails — The paper’s conclusions may not depend on it.
- Based: passes — The paper gives a reason why it holds.
Probably not a substantial claim. The paper’s conclusions may not depend on it.
In the paper
“Individuals with lower face-matching ability adopt more extreme criteria when there are more match than mismatch trials, or the cost of mismatch errors is high, and as such show higher levels of liberal and conservative tendencies, respectively (Stabile et al., 2024).”
§ A criterion-placement theory of face matching > 1. Introduction
What the sources say
- Not checked — no full text of the sourcecites Stabile et al., 2024 source
plaindirect- Asserted: passes — The authors put it forward as true.
- Checkable: passes — It can be checked against evidence.
- Load-bearing: passes — The paper’s conclusions depend on it.
- Based: passes — The paper gives a reason why it holds.
It may state two separate claims as one.
A conclusion the paper draws from its own results — it cites no other source for it, so there is none to check. The quote shows it is in the paper.
In the paper
“When ability dominates, scores are positively correlated; when bias dominates, the correlation is negative.”
§ A criterion-placement theory of face matching > 5.3. Discussion
plaincorrelational- Asserted: passes — The authors put it forward as true.
- Checkable: passes — It can be checked against evidence.
- Load-bearing: passes — The paper’s conclusions depend on it.
- Based: passes — The paper gives a reason why it holds.
It may state two separate claims as one.
A conclusion the paper draws from its own results — it cites no other source for it, so there is none to check. The quote shows it is in the paper.
In the paper
“This indicates the presence of systematic response biases, whereby observers are biased towards match or mismatch decisions in their attempts to solve these tasks.”
§ A criterion-placement theory of face matching > 3.3. Discussion
hedgeddirect- Asserted: passes — The authors put it forward as true.
- Checkable: passes — It can be checked against evidence.
- Load-bearing: passes — The paper’s conclusions depend on it.
- Based: passes — The paper gives a reason why it holds.
It may state two separate claims as one.
A conclusion the paper draws from its own results — it cites no other source for it, so there is none to check. The quote shows it is in the paper.
In the paper
“We also suggest that item difficulty and the number of trials might be moderating factors, whereby increases in the number of items stabilizes the relative influence of difficulty values for each item, and therefore strengthens the correlation between match and mismatch performance when bias is controlled.”
§ A criterion-placement theory of face matching > 4.3. Discussion
hedgedconditional- Asserted: passes — The authors put it forward as true.
- Checkable: passes — It can be checked against evidence.
- Load-bearing: unclear — It is unclear whether the paper’s conclusions depend on it.
- Based: passes — The paper gives a reason why it holds.
It may state two separate claims as one.
A conclusion the paper draws from its own results — it cites no other source for it, so there is none to check. The quote shows it is in the paper.
In the paper
“Increasing the number of items reduces the average effect of this variation, which increases the correlation further.”
§ A criterion-placement theory of face matching > 4.2. Results
plaindirect- Asserted: passes — The authors put it forward as true.
- Checkable: passes — It can be checked against evidence.
- Load-bearing: unclear — It is unclear whether the paper’s conclusions depend on it.
- Based: passes — The paper gives a reason why it holds.
It may state two separate claims as one.
What the paper did — it cites no source for this, so there is none to check. The quote shows it is in the paper.
In the paper
“Five participants recognized one identity, so these trials were removed from data analysis.”
§ A criterion-placement theory of face matching > 2.1.2. Stimuli
plaindirectn = 5- Asserted: passes — The authors put it forward as true.
- Checkable: passes — It can be checked against evidence.
- Load-bearing: fails — The paper’s conclusions may not depend on it.
- Based: passes — The paper gives a reason why it holds.
Probably not a substantial claim. The paper’s conclusions may not depend on it. It may state two separate claims as one.
What the paper did — it cites no source for this, so there is none to check. The quote shows it is in the paper.
In the paper
“These values also exhibited good split-half reliability for criterion (both rs > 0.62, ps < 0.001) and adequate split half reliability for d' (both rs > 0.29, ps < 0.001).”
§ A criterion-placement theory of face matching > 3.2. Results
plain- Asserted: passes — The authors put it forward as true.
- Checkable: passes — It can be checked against evidence.
- Load-bearing: unclear — It is unclear whether the paper’s conclusions depend on it.
- Based: passes — The paper gives a reason why it holds.
It may state two separate claims as one. The quote only partly states this claim.
None of the sources cited for this claim have been checked yet.
In the paper
“Notably, the mirror effect is also attenuated by response biases, such as a tendency to categorise items as 'new' under conditions of uncertainty.”
§ A criterion-placement theory of face matching > 1. Introduction
What the sources say
plaindirect- Asserted: passes — The authors put it forward as true.
- Checkable: passes — It can be checked against evidence.
- Load-bearing: fails — The paper’s conclusions may not depend on it.
- Based: passes — The paper gives a reason why it holds.
Probably not a substantial claim. The paper’s conclusions may not depend on it.
What the paper did — it cites no source for this, so there is none to check. The quote shows it is in the paper.
In the paper
“Participants first applied Testable's screen calibration tool to ensure that stimulus size was held constant across the experiment.”
§ A criterion-placement theory of face matching > 2.1.3. Procedure
plaindirect- Asserted: passes — The authors put it forward as true.
- Checkable: passes — It can be checked against evidence.
- Load-bearing: fails — The paper’s conclusions may not depend on it.
- Based: passes — The paper gives a reason why it holds.
Probably not a substantial claim. The paper’s conclusions may not depend on it.
None of the sources cited for this claim have been checked yet.
In the paper
“Again, this interpretation is strengthened by a correlation of criterion values across the two tests, which suggests that these biases are stable at the level of the individual and show transfer across different face-matching tests (Baker et al., 2023).”
§ A criterion-placement theory of face matching > 3.3. Discussion
What the sources say
- Not checked yetcites Baker et al., 2023 source
Checked before — its earlier verdict is held back until a new check runs.
hedgedcorrelational- Asserted: passes — The authors put it forward as true.
- Checkable: passes — It can be checked against evidence.
- Load-bearing: passes — The paper’s conclusions depend on it.
- Based: passes — The paper gives a reason why it holds.
It may state two separate claims as one.
- Not checked yet
None of the sources cited for this claim have been checked yet.
In the paper
“These values were previously reported to have good test-retest reliability (i.e., criterion: both rs > 0.52, ps < 0.001; d': both rs > 0.53, ps < 0.001; Baker et al., 2023).”
§ A criterion-placement theory of face matching > 2.2. Results
What the sources say
- Not checked yetcites Baker et al., 2023 source
Checked before — its earlier verdict is held back until a new check runs.
plain- Asserted: passes — The authors put it forward as true.
- Checkable: passes — It can be checked against evidence.
- Load-bearing: fails — The paper’s conclusions may not depend on it.
- Based: passes — The paper gives a reason why it holds.
Probably not a substantial claim. The paper’s conclusions may not depend on it. It may state two separate claims as one.
- Not checked yet
A conclusion the paper draws from its own results — it cites no other source for it, so there is none to check. The quote shows it is in the paper.
In the paper
“Collectively, this suggests that such item-level biases do exist in unfamiliar face identification and might influence the dissociation found in old/new tasks.”
§ A criterion-placement theory of face matching > 6. Simulation 3
hedgedconditional- Asserted: passes — The authors put it forward as true.
- Checkable: passes — It can be checked against evidence.
- Load-bearing: passes — The paper’s conclusions depend on it.
- Based: passes — The paper gives a reason why it holds.
It may state two separate claims as one.
A conclusion the paper draws from its own results — it cites no other source for it, so there is none to check. The quote shows it is in the paper.
In the paper
“This is an important simulation as it shows that just as individual differences in observers' criterion can drive the dissociation of match and mismatch performance, it also can drive the dissociation of old/new performance.”
§ A criterion-placement theory of face matching > 6.3. Discussion
plaindirect- Asserted: passes — The authors put it forward as true.
- Checkable: passes — It can be checked against evidence.
- Load-bearing: passes — The paper’s conclusions depend on it.
- Based: passes — The paper gives a reason why it holds.
It may state two separate claims as one.
None of the sources cited for this claim have been checked yet.
In the paper
“Forensic facial examiners, on the other hand, are practitioners with a trained ability for face identification and tend to be more balanced in the placement of the decision-making criterion between matches and mismatches.These experts are also more cautious in expressing confidence when errors are made (Towler et al., 2023).”
§ A criterion-placement theory of face matching > 7. General discussion
What the sources say
- Not checked yetcites Towler et al., 2023 source
Checked before — its earlier verdict is held back until a new check runs.
plaincorrelational- Asserted: passes — The authors put it forward as true.
- Checkable: passes — It can be checked against evidence.
- Load-bearing: passes — The paper’s conclusions depend on it.
- Based: passes — The paper gives a reason why it holds.
It may state two separate claims as one.
- Not checked yet
A conclusion the paper draws from its own results — it cites no other source for it, so there is none to check. The quote shows it is in the paper.
In the paper
“Whereas recognition (match trials, old trials) and discrimination (mismatch trials, new trials) are associated strongly when criterion is controlled, variability in criterion disconnects these measures.”
§ A criterion-placement theory of face matching > 7. General discussion
boostedcorrelational- Asserted: passes — The authors put it forward as true.
- Checkable: passes — It can be checked against evidence.
- Load-bearing: passes — The paper’s conclusions depend on it.
- Based: passes — The paper gives a reason why it holds.
It may state two separate claims as one.
A conclusion the paper draws from its own results — it cites no other source for it, so there is none to check. The quote shows it is in the paper.
In the paper
“When sensitivity is poor, as is represented by partially overlapping signal and noise distributions, criterion placement should matter (e.g., a placement that yields more hits will also yield more false alarms) and this might lead to a negative relationship between match and mismatch performance.”
§ A criterion-placement theory of face matching > 5.3. Discussion
hedgedconditional- Asserted: passes — The authors put it forward as true.
- Checkable: passes — It can be checked against evidence.
- Load-bearing: passes — The paper’s conclusions depend on it.
- Based: passes — The paper gives a reason why it holds.
It may state two separate claims as one.
A conclusion the paper draws from its own results — it cites no other source for it, so there is none to check. The quote shows it is in the paper.
In the paper
“The unrotated PCA results behave exactly as they should, identifying the two underlying independent sources of variance in the data and allocating the first component to the source with greater variance.”
§ A criterion-placement theory of face matching > 5.3. Discussion
boosteddirect- Asserted: passes — The authors put it forward as true.
- Checkable: passes — It can be checked against evidence.
- Load-bearing: passes — The paper’s conclusions depend on it.
- Based: passes — The paper gives a reason why it holds.
It may state two separate claims as one.
None of the sources cited for this claim have been checked yet.
In the paper
“The current findings extend recent calls to integrate decision-making measures into models of face identification (Baker et al., 2023;Bindemann & Burton, 2021).”
§ A criterion-placement theory of face matching > 7. General discussion
What the sources say
plain- Asserted: passes — The authors put it forward as true.
- Checkable: passes — It can be checked against evidence.
- Load-bearing: passes — The paper’s conclusions depend on it.
- Based: passes — The paper gives a reason why it holds.
Probably not a substantial claim.
A conclusion the paper draws from its own results — it cites no other source for it, so there is none to check. The quote shows it is in the paper.
In the paper
“Overall, these results extend the findings from our experiments and simulations, by demonstrating how individual differences in sensitivity and criterionor ability and biasinteract and suggest that both are important for understanding face matching.”
§ A criterion-placement theory of face matching > 5.3. Discussion
boostedcorrelational- Asserted: passes — The authors put it forward as true.
- Checkable: passes — It can be checked against evidence.
- Load-bearing: passes — The paper’s conclusions depend on it.
- Based: passes — The paper gives a reason why it holds.
It may state two separate claims as one.
A conclusion the paper draws from its own results — it cites no other source for it, so there is none to check. The quote shows it is in the paper.
In the paper
“Notably, the correlations at the item level and the participant level are each dependent on the amount of variation in the bias at the corresponding level, and as such it is possible to get a correlation at the item-but not the participant-level, or vice versa.”
§ A criterion-placement theory of face matching > 6.3. Discussion
hedgedcorrelational- Asserted: passes — The authors put it forward as true.
- Checkable: passes — It can be checked against evidence.
- Load-bearing: passes — The paper’s conclusions depend on it.
- Based: passes — The paper gives a reason why it holds.
It may state two separate claims as one.
A conclusion the paper draws from its own results — it cites no other source for it, so there is none to check. The quote shows it is in the paper.
In the paper
“It is possible that enhanced accuracy with one of these stimulus types reflects differences in observer's decision-making thresholds.”
§ A criterion-placement theory of face matching > 7. General discussion
hedgedconditional- Asserted: passes — The authors put it forward as true.
- Checkable: passes — It can be checked against evidence.
- Load-bearing: passes — The paper’s conclusions depend on it.
- Based: passes — The paper gives a reason why it holds.
Probably not a substantial claim.
None of the sources cited for this claim have been checked yet.
In the paper
“These observers exhibit a tendency to classify face pairs as matches and are biased to make highly confident errors on mismatch trials (Towler et al., 2023).”
§ A criterion-placement theory of face matching > 7. General discussion
What the sources say
- Not checked yetcites Towler et al., 2023 source
Checked before — its earlier verdict is held back until a new check runs.
plaincorrelational- Asserted: passes — The authors put it forward as true.
- Checkable: passes — It can be checked against evidence.
- Load-bearing: passes — The paper’s conclusions depend on it.
- Based: passes — The paper gives a reason why it holds.
It may state two separate claims as one.
- Not checked yet
What the paper did — it cites no source for this, so there is none to check. The quote shows it is in the paper.
In the paper
“This phenomenon was observed with large sample sizes, totalling nearly 550 participants across two experiments that were conducted in two different labs, and three face-matching tests (AIFMT, GFMT, KFMT).”
§ A criterion-placement theory of face matching > 7. General discussion
plainn = 550- Asserted: passes — The authors put it forward as true.
- Checkable: passes — It can be checked against evidence.
- Load-bearing: passes — The paper’s conclusions depend on it.
- Based: passes — The paper gives a reason why it holds.
It may state two separate claims as one.
A conclusion the paper draws from its own results — it cites no other source for it, so there is none to check. The quote shows it is in the paper.
In the paper
“When sensitivity is high, as is represented by a large separation of signal and noise distributions, criterion placement should not matter and there should be a positive relationship between match and mismatch performance.”
§ A criterion-placement theory of face matching > 5.3. Discussion
plaincorrelational- Asserted: passes — The authors put it forward as true.
- Checkable: passes — It can be checked against evidence.
- Load-bearing: passes — The paper’s conclusions depend on it.
- Based: passes — The paper gives a reason why it holds.
It may state two separate claims as one.
A conclusion the paper draws from its own results — it cites no other source for it, so there is none to check. The quote shows it is in the paper.
In the paper
“While accuracy and sensitivity can determine the number of errors one makes, the placement of criterion determines the type of error.”
§ A criterion-placement theory of face matching > 7. General discussion
plaindirect- Asserted: passes — The authors put it forward as true.
- Checkable: passes — It can be checked against evidence.
- Load-bearing: passes — The paper’s conclusions depend on it.
- Based: passes — The paper gives a reason why it holds.
It may state two separate claims as one.
The paper relies on this without support.
Both match and mismatch decisions rely on a visual comparison of the similarity of faces within the pair.
“However, this match-mismatch dissociation is difficult to reconcile with a key observation-both types of decisions rely on a visual comparison of the similarity of faces within the pair.”
The paper relies on this without support.
Observers must approach the identification of both stimulus types in the same manner initially, before an identification decision is reached.
“Moreover, observers must approach the identification of both stimulus types in the same manner initially, before an identification decision is reached.”
The paper relies on this without support.
Errors on match and mismatch trials are associated with different risks in applied settings.
“This issue is also important practically as errors on match and mismatch trials are associated with different risks in applied settings.”
The paper relies on this without support.
The simulation model's decision rule and parameter distributions capture the relevant processes in human face matching.
“For the first simulation, we generated data for a deterministic model by drawing from separate truncated normal distributions (Luong, 2025) foot_2 to act as participants' ability and bias, and also for stimulus item difficulty.”
“A match trial is scored correct if a simulated participant's combined ability and bias (i.e., ability + bias) exceeds the trial difficulty, and a mismatch trial is correct if their combined ability and bias (i.e., ability -bias) value exceeds the trial difficulty.”
Statistics that don’t add up
Each reported p-value recomputed from its test statistic and degrees of freedom.
Rated minor: it would not touch a result — a value no result rests on, a p-value that stays on the same side of the significance level, or a conflict that is clerical, resolved elsewhere in the paper, or outside its own findings.
In the paper
“r(297) = -0.15,p < 0.001”
§ A criterion-placement theory of face matching > 3.2. Results
Reported p < .001 · recomputed p = .009
Statistics recomputed
Every reported test result, recomputed from its test statistic and degrees of freedom. A result shows as not adding up only once an independent check has confirmed it.
- Doesn’t add upr(297) = -0.15reported p < .001 · recomputed p = .009
“r(297) = -0.15,p < .001”
- Consistentr(247) = 0.67reported p < .001 · recomputed p < .001
“r(247) = 0.67, p < .001”
- Consistentr(247) = 0.58reported p < .001 · recomputed p < .001
“r(247) = 0.58, p < .001”
- Consistentr(247) = 0.69reported p < .001 · recomputed p < .001
“r(247) = 0.69, p < .001”
- Consistentr(247) = 0.69reported p < .001 · recomputed p < .001
“r (247) = 0.69, p < .001”
- Consistentr(247) = -0.05reported p = .44 · recomputed p = .432
“r(247) = -0.05,p = .44”
- Consistentr(247) = -0.29reported p < .001 · recomputed p < .001
“r(247) = -0.29,p < .001”
- Consistentr(247) = 0.43reported p < .001 · recomputed p < .001
“r (247) = 0.43, p < .001”
- Consistentr(247) = 0.47reported p < .001 · recomputed p < .001
“r(247) = 0.47, p < .001”
- Consistentr(247) = 0.59reported p < .001 · recomputed p < .001
“r(247) = 0.59, p < .001”
- Consistentr(247) = 0.41reported p < .001 · recomputed p < .001
“r (247) = 0.41, p < .001”
- Consistentr(247) = 0.61reported p < .001 · recomputed p < .001
“r(247) = 0.61, p < .001”
- Consistentr(247) = 0.42reported p < .001 · recomputed p < .001
“r(247) = 0.42, p < .001”
- Consistentr(297) = 0.55reported p < .001 · recomputed p < .001
“r(297) = 0.55, p < .001”
- Consistentr(297) = 0.62reported p < .001 · recomputed p < .001
“r(297) = 0.62, p < .001”
- Consistentr(297) = 0.52reported p < .001 · recomputed p < .001
“r(297) = 0.52, p < .001”
- Consistentr(297) = 0.54reported p < .001 · recomputed p < .001
“r (297) = 0.54, p < .001”
- Consistentr(297) = -0.42reported p < .001 · recomputed p < .001
“r(297) = -0.42,p < .001”
- Consistentr(297) = 0.47reported p < .001 · recomputed p < .001
“r(297) = 0.47, p < .001”
- Consistentr(297) = 0.46reported p < .001 · recomputed p < .001
“r(297) = 0.46, p < .001”
- Consistentr(297) = 0.31reported p < .001 · recomputed p < .001
“r(297) = 0.31, p < .001”
- Consistentr(297) = 0.3reported p < .001 · recomputed p < .001
“r(297) = 0.30, p < .001”
- Consistentr(297) = 0.53reported p < .001 · recomputed p < .001
“r(297) = 0.53, p < .001”
- Consistentr(297) = 0.28reported p < .001 · recomputed p < .001
“r(297) = 0.28, p < .001”
Self-check
Percentages, sums and reported differences re-computed from the paper’s own numbers.
Self-check results appear here once an independent check has confirmed them.
Citations
Cites
Understanding face recognition
Bruce, V., & Young, A. (1986) · British Journal of Psychology · doi:10.1111/j.2044-8295.1986.tb02199.x · Cited by 4,067
Calculation of signal detection theory measures
Stanislaw, H., & Todorov, N. (1999) · Behavior Research Methods, Instruments, & Computers · doi:10.3758/bf03207704 · Cited by 2,673
A Unified Account of the Effects of Distinctiveness, Inversion, and Race in Face Recognition
Valentine, T. (1991) · The Quarterly Journal of Experimental Psychology Section A · doi:10.1080/14640749108400966 · Cited by 1,434
Duchaine, B., & Nakayama, K. (2005) · Neuropsychologia · doi:10.1016/j.neuropsychologia.2005.07.001 · Cited by 1,040
Variability in photos of the same face
Jenkins, R., White, D., van Montfort, X. A. N. D. R. A., & Burton, A. M. (2011) · Cognition · doi:10.1016/j.cognition.2011.08.001 · Cited by 672
The Glasgow Face Matching Test
Burton, A. M., White, D., & McNeill, A. (2010) · Behavior Research Methods · doi:10.3758/brm.42.1.286 · Cited by 472
Family resemblance: Ten family members with prosopagnosia and within-class object agnosia
Duchaine, B., Germine, L. T., & Nakayama, K. (2007) · Cognitive Neuropsychology · doi:10.1080/02643290701380491 · Cited by 411
Human face recognition ability is specific and highly heritable
Wilmer, J. B., Germine, L., Chabris, C. F., Chatterjee, G., Williams, M., Loken, E., Nakayama, K., & Duchaine, B. (2010) · Proceedings of the National Academy of Sciences · doi:10.1073/pnas.0913053107 · Cited by 396
Verification of face identities from images captured on video.
Bruce, V., Henderson, Z., Greenwood, K., Hancock, P. J. B., Burton, A. M., & Miller, P. (1999) · Journal of Experimental Psychology: Applied · doi:10.1037/1076-898x.5.4.339 · Cited by 333
Self-citation“Utilizing” Signal Detection Theory
Lynn, S. K., & Barrett, L. F. (2014) · Psychological Science · doi:10.1177/0956797614541991 · Cited by 270
Research works printed but not linked: 1
- Hancock, 1996, Face processing: Human perception and principal components analysis, Memory and Cognition, 24, 26, 10.3758/bf03197270 · DOI
Cited by
Sorted by citations
Hunt, L. (2025) · Kent Academic Repository (University of Kent) · doi:10.22024/unikent/01.02.113519
Zhang, G., Yang, Y., Chen, H., Xie, X., Huang, J., & Xiaoxia, D. (2026) · Frontiers in Psychology · doi:10.3389/fpsyg.2026.1833741
When criterion control in face matching induces correlation: Commentary on Baker et al. (2026)
Kramer, R. S. S. (2026) · Cognition · doi:10.1016/j.cognition.2026.106644
Decision making in the justice system: New insights and future directions.
Palmer, M. A. (2026) · Journal of Applied Research in Memory and Cognition · doi:10.1037/mac0000290
Deep Face Matching via Sparse Embedding of Partial Face Representations
Hannane, R., Elboushaki, A., & Afdel, K. (2026) · International Conference on Circuit, Systems and Communication (ICCSC) · doi:10.1109/iccsc71566.2026.11650232
Metadata
- Authors
- Baker, K. A., Mondloch, C. J., Hancock, P. J. B., & Bindemann, M.
- Affiliations
- University of Kent (GB)
- Brock University (CA)
- University of Stirling (GB)
- Corresponding author
- Baker, Kristen A.
- Venue
- Cognition
- Publisher
- Elsevier BV
- Published
- 2026-01
- Volume
- 266
- Pages
- 106319
- ISSN
- 0010-0277 (ISSN-L)
- OpenAlex
- W4414591049
- Semantic Scholar
- 8c59f1df1b8e6c5a6e3dc3abbae2768e1ac73c05
- Cited by
- 5
- References
- 77
- Citations by year
- 2026: 4
- FWCI
- 2.06
- Type
- journal article
- Language
- en
- Open access
- hybrid
- doi.org
- Licence
- Locations
- Cognition (publishedVersion, cc-by)
- SSRN Electronic Journal (acceptedVersion)
- PubMed (publishedVersion)
- Kent Academic Repository (University of Kent) (submittedVersion)
- Funders
- Natural Sciences and Engineering Research Council of Canada (RGPIN 2022-04386)
- Royal Society (221754)
- Topics
- Life Sciences › Neuroscience › Cognitive Neuroscience › Face Recognition and Perception
- Physical Sciences › Computer Science › Computer Vision and Pattern Recognition › Face recognition and analysis
- Social Sciences › Psychology › Experimental and Cognitive Psychology › Evolutionary Psychology and Human Behavior
- Keywords
- face matching, face identification, response bias, decision threshold, individual differences
- MeSH terms
- Facial Recognition, Adolescent, Adult, Decision Making, Face, Female, Humans, Individuality, Male, Psychological Theory, Recognition, Psychology, Young Adult
About these checks
Registry, retraction, Cites and statistics results are computed, not judged, with one exception: a printed reference that no index lists is read once by a model before it counts as a citation error. Claims are extracted by a model and kept only when their quote appears verbatim in the text; each cited source is then checked, with a model’s help, for whether it says what the claim relies on. Those verdicts can be wrong — read the claim’s quote and the cited source before relying on one.
A language model drew the claims from the paper on 2026-11-10, under version 3 of the claim definition (model deepseek-v4.1-flash, prompt extract-v3).
A second model labelled each claim on 2026-11-10 (model jev-1.13-20260917, definition revision gold-guideline-v0.2).
Cited sources are checked with a language model’s help (gpt-6-sol).
Statistics and arithmetic are recomputed, not judged.
Confidence bands are shown only for fields calibrated on our annotated test set. None is calibrated yet, so no band is shown.
What counts as a claim ›How we measure confidence ›How we check this ›
Are you an author, or do you see a problem with this page? Request a review
