

The DOI matches its Crossref record; 92 of the 92 references it cites were found in a registry or an index; 89 of the 95 sources its claims cite were checked for support.
hdWGCNA identifies co-expression networks in high-dimensional transcriptomics data
Open accessPublished version of a preprint
Abstract
Biological systems are immensely complex, organized into a multi-scale hierarchy of functional units based on tightly regulated interactions between distinct molecules, cells, organs, and organisms. While experimental methods enable transcriptome-wide measurements across millions of cells, popular bioinformatic tools do not support systems-level analysis. Here we present hdWGCNA, a comprehensive framework for analyzing co-expression networks in high-dimensional transcriptomics data such as single-cell and spatial RNA sequencing (RNA-seq). hdWGCNA provides functions for network inference, gene module identification, gene enrichment analysis, statistical tests, and data visualization. Beyond conventional single-cell RNA-seq, hdWGCNA is capable of performing isoform-level network analysis using long-read single-cell data. We showcase hdWGCNA using data from autism spectrum disorder and Alzheimer's disease brain samples, identifying disease-relevant co-expression network modules. hdWGCNA is directly compatible with Seurat, a widely used R package for single-cell and spatial transcriptomics analysis, and we demonstrate the scalability of hdWGCNA by analyzing a dataset containing nearly 1 million cells.
Overview
AI snapshot
Written from the paper’s full text.
TL;DR
hdWGCNA is an R package/framework for co-expression network analysis in single-cell and spatial transcriptomics data, extending Seurat and adding metacell/metaspot aggregation, network inference, module detection, enrichment, and visualization. The authors demonstrate it across human brain, mouse brain spatial, long-read isoform, ASD, AD, and million-cell PBMC datasets, identifying disease- and cell-type-relevant modules.
Key findings
- hdWGCNA identified 96 co-expression modules across six major cell types in 36,671 human PFC snRNA-seq cells from 11 cognitively normal donors; ODC modules were reproducible in an independent dataset, with all ODC-specific modules significantly preserved (Z summary preservation ≥5).
- In mouse brain Visium ST, hdWGCNA found 12 spatial modules from 2,696 anterior and 3,353 posterior spots, including white-matter myelination module SM1 and ventricle/BBB-associated SM4 enriched for hemoglobin subunits.
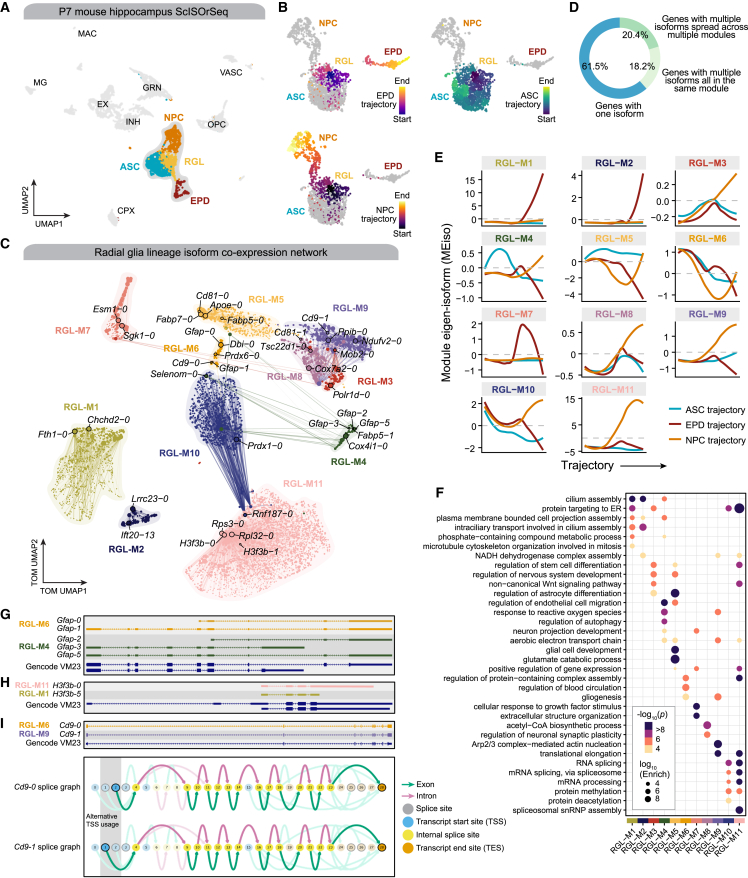
- Isoform-level analysis of 2,190 radial glia lineage cells from mouse hippocampus ScISOrSeq yielded 11 modules; 61.5% of retained genes had a single isoform, 18.2% had multiple isoforms all in the same module, and 20.4% had isoforms spread across several modules.
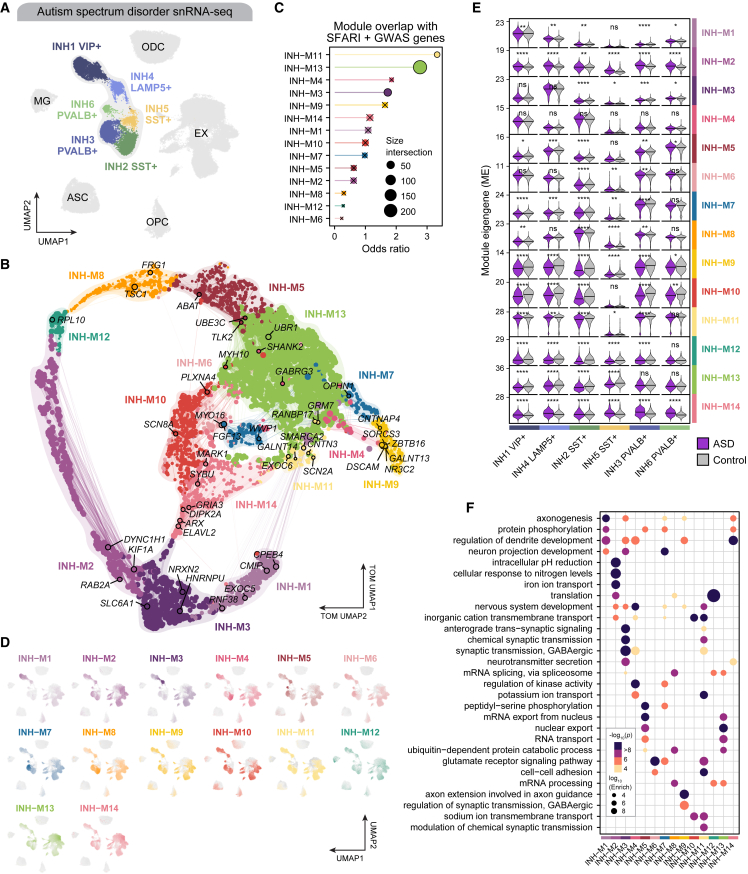
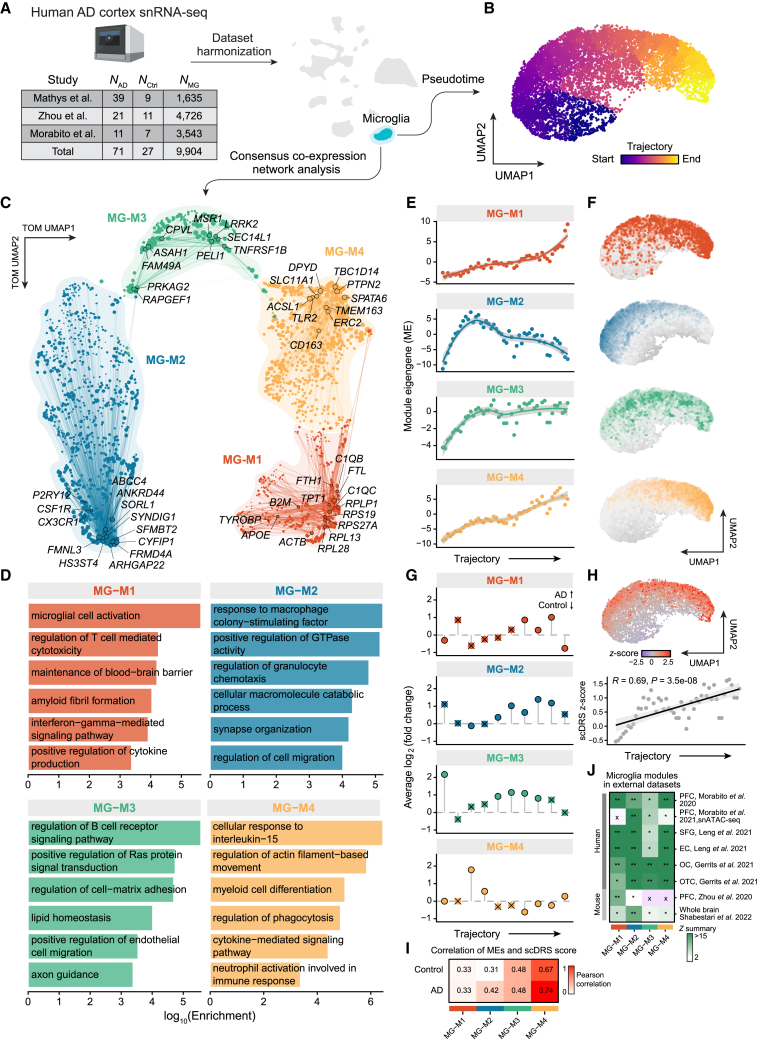
- In ASD inhibitory neurons (20,249 INH nuclei), hdWGCNA found 14 modules; modules INH-M11, INH-M13, and INH-M3 were enriched for ASD-associated genes, and all modules except INH-M4 showed significant ME differences in at least one INH subpopulation. In AD microglia consensus analysis, four modules were identified, with MG-M1 containing DAM genes and MG-M2 containing homeostatic markers.
Methods
- Design: hdWGCNA builds on WGCNA-style co-expression network analysis, using metacells for scRNA-seq or metaspots for spatial transcriptomics to reduce sparsity, then signed adjacency, soft-power thresholding, signed topological overlap matrix (TOM), and Dynamic Tree Cut for module detection.
- Data: applications included human PFC snRNA-seq (36,671 cells), mouse brain Visium ST (6,049 spots total), mouse hippocampus ScISOrSeq (6,832 nuclei; 2,190 radial glia lineage cells), ASD snRNA-seq (20,249 inhibitory neurons), AD microglia from three snRNA-seq datasets (9,904 microglia nuclei from 189,127 total nuclei), and a PBMC scRNA-seq dataset (965,363 cells retained).
- Analysis: module eigengenes (MEs) computed by SVD with optional Harmony correction; downstream tests included differential module eigengene analysis, module preservation with permutations, EGAD functional coherence, XGBoost hub-gene prediction, Monocle3 pseudotime, scDRS polygenic risk scoring, and projection of bulk RNA-seq modules into snRNA-seq.
Limitations
- Stated: single-cell transcriptomic measurements are noisy, with technical noise from dropout events and experimental protocols; hdWGCNA attempts to address this by constructing networks in metacell or metaspot profiles and by using module preservation testing for reproducibility.
- Evident from the text: the metacell algorithm requires a dimensional reduction of the input matrix, and technical artifacts in that reduction can influence metacell construction; the optimal number of cells per metacell may differ across cell types and tissues.
- Evident from the text: pseudo-bulk aggregation is suggested as likely suitable for co-expression network analysis only given sufficient sample size, and several analyses rely on external datasets and parameter choices for validation.
Model-written summary. Check it against the paper before relying on it.
Integrity signals
Registry
Cites
Statistics
Figures
Verification
Claims the paper makes
68 Own result · 38 Supported · 31 Own interpretation · 22 No basis given · 15 Partly supported · 10 Own method · 5 Couldn’t confirm · 2 Sources not found · 2 No full text of the sources · 1 Supported so far · 1 Not checked yet · accuracy not yet measured
Every source the paper cites for this claim was checked and supports it.
In the paper
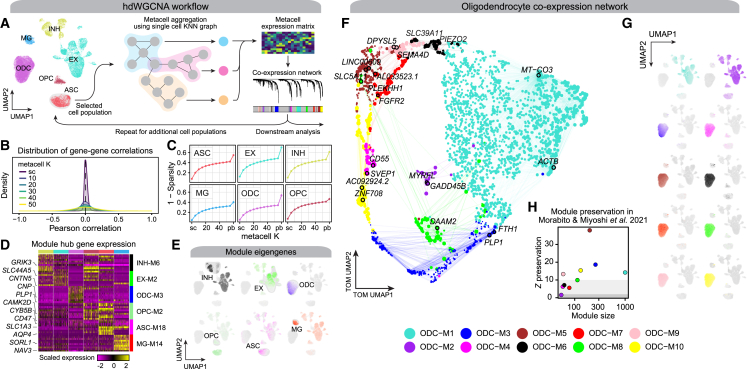
“We constructed metacells and performed co-expression network analysis for each major cell type in the human PFC dataset11 using the standard hdWGCNA workflow, yielding distinct network structures and sets of gene modules (Data S2 and S3).”
§ hdWGCNA identifies co-expression networks in high-dimensional transcriptomics data > Results > Constructing co-expression networks from high-dimensional transcriptomics data
What the sources say
- Supportedcites [11] Zhou Y. Song W.M. Andhey P.S. Swain A. Levy T. Miller K.R. Poliani P.L. Cominelli M. Grover S. Gilfillan S. Human and mouse single-nucleus transcriptomics reveal TREM2-dependent and TREM2-independent cellular responses in Alzheimer’s disease Nat. Med. 26 2020 131 142 10.1038/s41591-019-0695-9 31932797 PMC6980793 source
The Results section, “Human brain AD gene signatures are distinct from those of the 5XFAD model,” describes snRNA-seq of human dorsolateral prefrontal cortex samples and identifies their cell-type clusters. Citation 11 identifies the dataset used; the sentence presents metacell construction and network analysis as the citing authors’ own work. (LLM, conf=0.93)
plaincorrelationaln = 11- Asserted: passes — The authors put it forward as true.
- Checkable: passes — It can be checked against evidence.
- Load-bearing: passes — The paper’s conclusions depend on it.
- Based: passes — The paper gives a reason why it holds.
- Supported
Every source the paper cites for this claim was checked and supports it.
In the paper
“Using long-read scRNA-seq data from the mouse hippocampus,8 we uncovered splicing isoform co-expression networks in the radial glia lineage involved in cell fate specification.”
§ hdWGCNA identifies co-expression networks in high-dimensional transcriptomics data > Introduction
What the sources say
- Supportedcites [8] Joglekar A. Prjibelski A. Mahfouz A. Collier P. Lin S. Schlusche A.K. Marrocco J. Williams S.R. Haase B. Hayes A. A spatially resolved brain region- and cell type-specific isoform atlas of the postnatal mouse brain Nat. Commun. 12 2021 463 10.1038/s41467-020-20343-5 33469025 PMC7815907 source
The citation is attached to the long-read single-cell RNA-seq data from the mouse hippocampus, not to the citing authors’ hdWGCNA findings. The Results section, “Short read clustering of P7 hippocampus and prefrontal cortex tissue,” describes barcoded hippocampal single cells analyzed with both short and long reads. (LLM, conf=0.94)
plaincorrelational- Asserted: passes — The authors put it forward as true.
- Checkable: passes — It can be checked against evidence.
- Load-bearing: unclear — It is unclear whether the paper’s conclusions depend on it.
- Based: passes — The paper gives a reason why it holds.
- Supported
Every source the paper cites for this claim was checked and supports it.
In the paper
“We performed consensus co-expression network analysis of microglia from three Alzheimer’s disease (AD) snRNA-seq studies,10,11,12 yielding multiple gene modules corresponding to disease-associated microglia and polygenic risk of AD.”
§ hdWGCNA identifies co-expression networks in high-dimensional transcriptomics data > Introduction
What the sources say
- Supportedcites [10] Mathys H. Davila-Velderrain J. Peng Z. Gao F. Mohammadi S. Young J.Z. Menon M. He L. Abdurrob F. Jiang X. Single-cell transcriptomic analysis of Alzheimer’s disease Nature 570 2019 332 337 10.1038/s41586-019-1195-2 31042697 PMC6865822 source
The Discussion identifies this paper as a single-cell transcriptomic study of AD pathology that includes microglia (Mic). In the citing sentence, the citations identify the three studies whose data the citing authors analyzed; the consensus analysis and its resulting modules are the citing authors’ work, not findings attributed to this source. (LLM, conf=0.91)
- Supportedcites [11] Zhou Y. Song W.M. Andhey P.S. Swain A. Levy T. Miller K.R. Poliani P.L. Cominelli M. Grover S. Gilfillan S. Human and mouse single-nucleus transcriptomics reveal TREM2-dependent and TREM2-independent cellular responses in Alzheimer’s disease Nat. Med. 26 2020 131 142 10.1038/s41591-019-0695-9 31932797 PMC6980793 source
The citation identifies this paper as one of the AD snRNA-seq studies whose microglia data the citing authors analyzed. Extended Data Fig. 7 describes human snRNA-seq data including a microglia cluster and AD and control samples; the consensus network analysis and resulting modules are presented as the citing authors’ own work, not this source’s findings. (LLM, conf=0.92)
- Supportedcites [12] Morabito S. Miyoshi E. Michael N. Shahin S. Martini A.C. Head E. Silva J. Leavy K. Perez-Rosendahl M. Swarup V. Single-nucleus chromatin accessibility and transcriptomic characterization of Alzheimer’s disease Nat. Genet. 53 2021 1143 1155 10.1038/s41588-021-00894-z 34239132 PMC8766217 source
The citation identifies one of the three AD snRNA-seq studies used in the citing authors’ analysis; it does not attribute that three-study analysis to Morabito et al. The Results section (‘Multi-omic characterization of AD cellular heterogeneity’) describes this paper’s snRNA-seq analysis of microglial populations in AD. (LLM, conf=0.92)
plaincorrelational- Asserted: passes — The authors put it forward as true.
- Checkable: passes — It can be checked against evidence.
- Load-bearing: passes — The paper’s conclusions depend on it.
- Based: passes — The paper gives a reason why it holds.
- Supported
Every source the paper cites for this claim was checked and supports it.
In the paper
“Optionally, hdWGCNA can use alternative gene scoring methods such as or UCell18 or Seurat’s AddModuleScore function, and we show that these scores are correlated with MEs (Figure S3).”
§ hdWGCNA identifies co-expression networks in high-dimensional transcriptomics data > Results > Constructing co-expression networks from high-dimensional transcriptomics data
What the sources say
- Supportedcites [18] Andreatta M. Carmona S.J. UCell: robust and scalable single-cell gene signature scoring Comput. Struct. Biotechnol. J. 19 2021 3796 3798 10.1016/j.csbj.2021.06.043 34285779 PMC8271111 source
The citation identifies UCell as an alternative gene-signature scoring method. The Introduction and Results describe UCell as such a method and also discuss Seurat’s AddModuleScore. The statement that the scores correlate with module eigengenes is presented as the citing authors’ own finding (Figure S3), not as a finding attributed to this source. (LLM, conf=0.92)
plaincorrelational- Asserted: passes — The authors put it forward as true.
- Checkable: passes — It can be checked against evidence.
- Load-bearing: unclear — It is unclear whether the paper’s conclusions depend on it.
- Based: passes — The paper gives a reason why it holds.
- Supported
Every source the paper cites for this claim was checked and supports it.
In the paper
“We applied hdWGCNA to a dataset of CD34+ hematopoietic stem and progenitor stem cells16 using two additional metacell approaches14,16 and found that all approaches were suitable for downstream network analysis (Figure S2; Data S1).”
§ hdWGCNA identifies co-expression networks in high-dimensional transcriptomics data > Results > Constructing co-expression networks from high-dimensional transcriptomics data
What the sources say
- Supportedcites [14] Ben-Kiki O. Bercovich A. Lifshitz A. Tanay A. Metacell-2: a divide-and-conquer metacell algorithm for scalable scRNA-seq analysis Genome Biol. 23 2022 100 10.1186/s13059-022-02667-1 35440087 PMC9019975 source
The citation identifies Metacell-2 as one of the metacell approaches, rather than attributing the citing authors’ network-analysis finding to this paper. In Results (“MC2 is sensitive and robust”; page unavailable), the source describes applying MC2 to human bone-marrow cells and examining HSC/MPP metacells. The statement that all approaches were suitable for network analysis is presented as the citing authors’ own finding. (LLM, conf=0.88)
- Supportedcites [16] Persad S. Choo Z.-N. Dien C. Sohail N. Masilionis I. Chaligné R. Nawy T. Brown C.C. Sharma R. Pe’er I. SEACells infers transcriptional and epigenomic cellular states from single-cell genomics data Nat. Biotechnol. 2023 10.1038/s41587-023-01716-9 PMC10713451 36973557 source
The Results section (‘SEACells metacells represent accurate and robust cell states’) identifies the CD34+ hematopoietic stem and progenitor cell dataset, and the Methods section (‘Robustness of SEACells algorithm’) identifies SEACells as a metacell approach. The citation supports the dataset and approach used; the finding that all approaches were suitable for downstream network analysis is presented as the citing authors’ own result, not attributed to this source. (LLM, conf=0.90)
plain- Asserted: passes — The authors put it forward as true.
- Checkable: passes — It can be checked against evidence.
- Load-bearing: passes — The paper’s conclusions depend on it.
- Based: passes — The paper gives a reason why it holds.
- Supported
Every source the paper cites for this claim was checked and supports it.
In the paper
“Network analysis of inhibitory neurons from published single-nucleus RNA sequencing (snRNA-seq) in autism spectrum disorder (ASD) donors9 revealed modules disrupted in ASD containing key genetic risk genes such as SCN2A, TSC1, and SHANK2.”
§ hdWGCNA identifies co-expression networks in high-dimensional transcriptomics data > Introduction
What the sources say
- Supportedcites [9] Velmeshev D. Schirmer L. Jung D. Haeussler M. Perez Y. Mayer S. Bhaduri A. Goyal N. Rowitch D.H. Kriegstein A.R. Single-cell genomics identifies cell type–specific molecular changes in autism Science 364 2019 685 689 10.1126/science.aav8130 31097668 PMC7678724 source
The citation is attached to the published snRNA-seq data from ASD donors, not to the citing authors’ network analysis or its gene modules. The source describes snRNA-seq of cortical tissue from ASD patients and controls (Abstract; study description). (LLM, conf=0.93)
plaincorrelational- Asserted: passes — The authors put it forward as true.
- Checkable: passes — It can be checked against evidence.
- Load-bearing: unclear — It is unclear whether the paper’s conclusions depend on it.
- Based: passes — The paper gives a reason why it holds.
- Supported
The cited sources that could be checked couldn’t confirm or dispute this claim.
In the paper
“suggesting that, given a sufficient sample size, pseudo-bulk expression profiles are likely suitable for co-expression network analysis.”
§ hdWGCNA identifies co-expression networks in high-dimensional transcriptomics data > Results > Constructing co-expression networks from high-dimensional transcriptomics data
What the sources say
- Could not verifycites [17] Squair J.W. Gautier M. Kathe C. Anderson M.A. James N.D. Hutson T.H. Hudelle R. Qaiser T. Matson K.J.E. Barraud Q. Confronting false discoveries in single-cell differential expression Nat. Commun. 12 2021 5692 10.1038/s41467-021-25960-2 34584091 PMC8479118 sourceExperimental — accuracy not yet measured
The Results section on pseudobulk methods reports improved differential-expression analysis when cells are aggregated within biological replicates. Our copy does not address whether pseudobulk expression profiles are suitable for co-expression network analysis at a sufficient sample size; searches for co-expression networks and sample size found no such passage. (LLM, conf=0.74)
hedgedconditional- Asserted: passes — The authors put it forward as true.
- Checkable: passes — It can be checked against evidence.
- Load-bearing: unclear — It is unclear whether the paper’s conclusions depend on it.
- Based: passes — The paper gives a reason why it holds.
- Could not verify
Every source the paper cites for this claim was checked and supports it.
In the paper
“we performed module preservation analysis20 to test the reproducibility of these modules in an independent dataset12 and found that all of the ODC-specific modules were significantly preserved (Z summary preservation ≥5).”
§ hdWGCNA identifies co-expression networks in high-dimensional transcriptomics data > Results > Constructing co-expression networks from high-dimensional transcriptomics data
What the sources say
- Supportedcites [20] Langfelder P. Luo R. Oldham M.C. Horvath S. Is my network module preserved and reproducible? PLoS Comput. Biol. 7 2011 e1001057 10.1371/journal.pcbi.1001057 PMC3024255 21283776 source
Citation 20 is attached to the module preservation analysis, not to the citing authors’ finding about ODC-specific modules. The source’s Results section, “Overview of module preservation statistics,” describes the preservation statistics and their implementation in the modulePreservation function. (LLM, conf=0.93)
- Supportedcites [12] Morabito S. Miyoshi E. Michael N. Shahin S. Martini A.C. Head E. Silva J. Leavy K. Perez-Rosendahl M. Swarup V. Single-nucleus chromatin accessibility and transcriptomic characterization of Alzheimer’s disease Nat. Genet. 53 2021 1143 1155 10.1038/s41588-021-00894-z 34239132 PMC8766217 source
The citation is attached to the independent dataset used for the citing authors’ module-preservation analysis, not to their preservation result. Morabito et al.’s Methods (Data availability; page unavailable) make their multi-omics data available, and their Results describe oligodendrocyte co-expression modules. The claim that all modules met the Z-summary threshold is the citing authors’ own finding. (LLM, conf=0.88)
plaincorrelational- Asserted: passes — The authors put it forward as true.
- Checkable: passes — It can be checked against evidence.
- Load-bearing: passes — The paper’s conclusions depend on it.
- Based: passes — The paper gives a reason why it holds.
- Supported
Every source the paper cites for this claim was checked and supports it.
In the paper
“we applied Monocle336 pseudotime to 2,190 radial glia lineage cells (Figure 4B). We identified three trajectories corresponding to distinct cell fates, termed the ependymal (EPD) trajectory, astrocyte (ASC) trajectory, and the neural intermediate progenitor cell (NPC) trajectory.”
§ hdWGCNA identifies co-expression networks in high-dimensional transcriptomics data > Results > Isoform-level co-expression networks reveal cell fate decisions in the radial glia developmental lineage
What the sources say
- Supportedcites [36] Cao J. Spielmann M. Qiu X. Huang X. Ibrahim D.M. Hill A.J. Zhang F. Mundlos S. Christiansen L. Steemers F.J. The single-cell transcriptional landscape of mammalian organogenesis Nature 566 2019 496 502 10.1038/s41586-019-0969-x 30787437 PMC6434952 source
Split into 2 atoms — 2 confirmed, 0 partially supported, 0 disputed, 0 misattributed, 0 unverifiable. Expand the claim to see per-atom verdicts.
plaincorrelationalSingle case- Asserted: passes — The authors put it forward as true.
- Checkable: passes — It can be checked against evidence.
- Load-bearing: passes — The paper’s conclusions depend on it.
- Based: passes — The paper gives a reason why it holds.
- Supported
Every source the paper cites for this claim was checked and supports it.
In the paper
“Emerging long-read sequencing approaches enable us to profile cellular transcriptomes at isoform resolution,8,31,32,33 thus providing new opportunities to model the relationships between isoforms using co-expression network analysis.”
§ hdWGCNA identifies co-expression networks in high-dimensional transcriptomics data > Results > Isoform-level co-expression networks reveal cell fate decisions in the radial glia developmental lineage
What the sources say
- Supportedcites [8] Joglekar A. Prjibelski A. Mahfouz A. Collier P. Lin S. Schlusche A.K. Marrocco J. Williams S.R. Haase B. Hayes A. A spatially resolved brain region- and cell type-specific isoform atlas of the postnatal mouse brain Nat. Commun. 12 2021 463 10.1038/s41467-020-20343-5 33469025 PMC7815907 source
The Introduction explains that long-read sequencing reads transcripts without assembly and enables accurate isoform quantification. The Discussion reports that the paper’s data illuminate full-length isoform regulation across cell types, supporting the attributed claim about profiling cellular transcriptomes at isoform resolution. (LLM, conf=0.92)
- Supportedcites [31] Rebboah E. Reese F. Williams K. Balderrama-Gutierrez G. McGill C. Trout D. Rodriguez I. Liang H. Wold B.J. Mortazavi A. Mapping and modeling the genomic basis of differential RNA isoform expression at single-cell resolution with LR-Split-seq Genome Biol. 22 2021 286 10.1186/s13059-021-02505-w 34620214 PMC8495978 source
The Introduction describes long-read RNA sequencing as enabling transcript-level identification and quantification and says it has been adapted to single-cell sequencing. The Discussion reports that LR-Split-seq provides isoform-level insights from single cells. The separate proposal to use co-expression network analysis is not attributed to this source. (LLM, conf=0.93)
- Supportedcites [32] Palmer C.R. Liu C.S. Romanow W.J. Lee M.-H. Chun J. Altered cell and RNA isoform diversity in aging Down syndrome brains Proc. Natl. Acad. Sci. USA 118 2021 e2114326118 10.1073/pnas.2114326118 PMC8617492 34795060 source
The Results section, “Transcriptomic Diversity Discovered Through Long-Read Sequencing of Single-Nucleus cDNA Libraries,” explicitly says long-read sequencing enables profiling full-length RNA isoforms from single-cell cDNA libraries. The study also used cellular barcodes to associate isoform reads with cells, supporting the attributed capability. The co-expression-network opportunity is the citing authors’ inference, not a claim attributed to this source. (LLM, conf=0.94)
- Supportedcites [33] Hardwick S.A. Hu W. Joglekar A. Fan L. Collier P.G. Foord C. Balacco J. Lanjewar S. Sampson M.M. Koopmans F. Single-nuclei isoform RNA sequencing unlocks barcoded exon connectivity in frozen brain tissue Nat. Biotechnol. 40 2022 1082 1092 10.1038/s41587-022-01231-3 35256815 PMC9287170 source
The Introduction states that long-read approaches enabled complete-isoform analysis and were subsequently used to analyze thousands of single cells. It also describes SnISOr-Seq sequencing barcoded molecules to detect multiple splicing events, supporting the attributed claim about cellular transcriptomes at isoform resolution. (LLM, conf=0.93)
plaindirect- Asserted: passes — The authors put it forward as true.
- Checkable: passes — It can be checked against evidence.
- Load-bearing: passes — The paper’s conclusions depend on it.
- Based: passes — The paper gives a reason why it holds.
- Supported
- Probably not a substantial claim. 71
- It may state two separate claims as one. 35
Every source the paper cites for this claim was checked and supports it.
In the paper
“Co-expression networks are based on transformed pairwise correlations of input features, resulting in a quantitative measure of relatedness between genes.1,2”
§ hdWGCNA identifies co-expression networks in high-dimensional transcriptomics data > Introduction
What the sources say
- Supportedcites [1] Langfelder P. Horvath S. WGCNA: an R package for weighted correlation network analysis BMC Bioinf. 9 2008 559 10.1186/1471-2105-9-559 PMC2631488 19114008 source
The Background glossary defines co-expression networks as weighted gene networks whose edges are determined by pairwise correlations of gene-expression profiles. In Results, “Category 1: Functions for network construction” explains that correlation-based similarity is transformed into adjacency, a continuous measure of connection strength between genes. (LLM, conf=0.94)
- Supportedcites [2] Yip A.M. Horvath S. Gene network interconnectedness and the generalized topological overlap measure BMC Bioinf. 8 2007 22 10.1186/1471-2105-8-22 PMC1797055 17250769 source
The Methods section (‘Yeast gene co-expression network construction’) says the authors calculated pairwise Pearson correlations between genes and thresholded their absolute values to construct the network. The Results section (‘Comparing GTOMm to the correlation coefficient’) also defines a quantitative, correlation-based gene-pair dissimilarity measure. Together, these support the attributed description of transformed correlations as a measure of relatedness. (LLM, conf=0.88)
plaindirect- Asserted: passes — The authors put it forward as true.
- Checkable: passes — It can be checked against evidence.
- Load-bearing: passes — The paper’s conclusions depend on it.
- Based: passes — The paper gives a reason why it holds.
Probably not a substantial claim.
- Supported
The cited sources support only part of this claim — read each source’s verdict below.
In the paper
“Hierarchical clustering on the network structure allows us to uncover functional modules of genes whose expression profiles are tightly intertwined,3,4 which typically correspond to specific biological processes and disease states.”
§ hdWGCNA identifies co-expression networks in high-dimensional transcriptomics data > Introduction
What the sources say
- Not checked — no full text of the sourcecites [3] Langfelder P. Zhang B. Horvath S. Defining clusters from a hierarchical cluster tree: the Dynamic Tree Cut package for R Bioinformatics 24 2008 719 720 10.1093/bioinformatics/btm563 18024473 source
- Partly supportedcites [4] Dong J. Horvath S. Understanding network concepts in modules BMC Syst. Biol. 1 2007 24 10.1186/1752-0509-1-24 17547772 PMC3238286 sourceExperimental — accuracy not yet measured
The Background section describes defining modules as branches of a hierarchical-clustering dendrogram, and the Results section applies this method to gene co-expression networks. The Results also report that most modules are enriched for known gene ontologies, supporting a link to biological functions. The paper does not establish that these modules typically correspond to disease states. (LLM, conf=0.87)
plaindirect- Asserted: passes — The authors put it forward as true.
- Checkable: passes — It can be checked against evidence.
- Load-bearing: passes — The paper’s conclusions depend on it.
- Based: passes — The paper gives a reason why it holds.
Probably not a substantial claim. It may state two separate claims as one.
The cited sources support only part of this claim — read each source’s verdict below.
In the paper
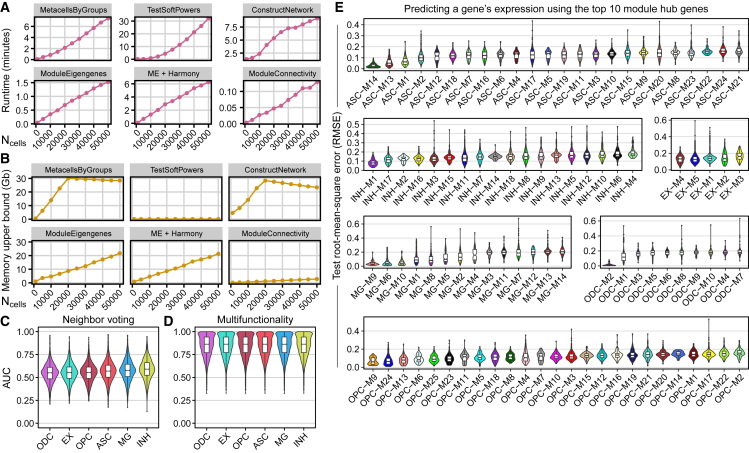
“Optionally, ModuleEigengenes can employ the harmony22 algorithm following SVD, which increases runtime but not memory usage.”
§ hdWGCNA identifies co-expression networks in high-dimensional transcriptomics data > Results > Runtime, memory usage, and evaluation of hdWGCNA
What the sources say
- Partly supportedcites [22] Korsunsky I. Millard N. Fan J. Slowikowski K. Zhang F. Wei K. Baglaenko Y. Brenner M. Loh P.-r. Raychaudhuri S. Fast, sensitive and accurate integration of single-cell data with Harmony Nat. Methods 16 2019 1289 1296 10.1038/s41592-019-0619-0 31740819 PMC6884693 sourceExperimental — accuracy not yet measured
The Online Methods > Harmony section (page not provided) describes Harmony operating on a PCA embedding, supporting its use after dimensionality reduction. The Results > Harmony Scales to Large Data section reports Harmony’s runtime and memory usage, but does not assess its use in ModuleEigengenes or show that adding it increases runtime without increasing memory usage. (LLM, conf=0.85)
plaindirect- Asserted: passes — The authors put it forward as true.
- Checkable: passes — It can be checked against evidence.
- Load-bearing: fails — The paper’s conclusions may not depend on it.
- Based: passes — The paper gives a reason why it holds.
Probably not a substantial claim. The paper’s conclusions may not depend on it. It may state two separate claims as one.
- Partly supported
Every source the paper cites for this claim was checked and supports it.
In the paper
“the hdWGCNA R package extends the data structures and functionality of the widely used Seurat package,5,6,7”
§ hdWGCNA identifies co-expression networks in high-dimensional transcriptomics data > Introduction
What the sources say
- Supportedcites [5] Butler A. Hoffman P. Smibert P. Papalexi E. Satija R. Integrating single-cell transcriptomic data across different conditions, technologies, and species Nat. Biotechnol. 36 2018 411 420 10.1038/nbt.4096 29608179 PMC6700744 source
The citations follow “Seurat package,” so this source is used to identify Seurat, not to establish what hdWGCNA extends. The Results section (Overview of Seurat alignment workflow; page unavailable) describes Seurat’s workflow and functionality, supporting that identification. (LLM, conf=0.89)
- Supportedcites [6] Stuart T. Butler A. Hoffman P. Hafemeister C. Papalexi E. Mauck W.M. Hao Y. Stoeckius M. Smibert P. Satija R. Comprehensive integration of single-cell data Cell 177 2019 1888 1902.e21 10.1016/j.cell.2019.05.031 31178118 PMC6687398 source
The citation identifies Seurat, the package named in the citing sentence. The paper’s Data and software availability section identifies Seurat v3 as a CRAN package, and its Method details describes Seurat’s functions. The statement about what hdWGCNA extends is the citing authors’ description of their own package. (LLM, conf=0.88)
- Supportedcites [7] Hao Y. Hao S. Andersen-Nissen E. Mauck W.M. Zheng S. Butler A. Lee M.J. Wilk A.J. Darby C. Integrated analysis of multimodal single-cell data Cell 184 2021 3573 3587.e29 10.1016/j.cell.2021.04.048 34062119 PMC8238499 source
The citation is attached to the identification of Seurat, rather than to the citing authors’ statement about what hdWGCNA extends. The STAR★Methods key resources table lists Seurat v4 as software from this paper, and Method details identify it as an R package used for single-cell analysis. The source need not describe hdWGCNA to support this identification. (LLM, conf=0.90)
plaindirect- Asserted: passes — The authors put it forward as true.
- Checkable: passes — It can be checked against evidence.
- Load-bearing: fails — The paper’s conclusions may not depend on it.
- Based: passes — The paper gives a reason why it holds.
Probably not a substantial claim. The paper’s conclusions may not depend on it.
- Supported
Every source the paper cites for this claim was checked and supports it.
In the paper
“To maximize usability among the genomics community, the hdWGCNA R package extends the data structures and functionality of the widely used Seurat package,5,6,7 and we developed an extensive documentation website for hdWGCNA demonstrating its use on new datasets.”
§ hdWGCNA identifies co-expression networks in high-dimensional transcriptomics data > Introduction
What the sources say
- Supportedcites [5] Butler A. Hoffman P. Smibert P. Papalexi E. Satija R. Integrating single-cell transcriptomic data across different conditions, technologies, and species Nat. Biotechnol. 36 2018 411 420 10.1038/nbt.4096 29608179 PMC6700744 source
The citation is attached to “Seurat package,” not to the citing authors’ statements about developing hdWGCNA or its documentation. The Discussion (page unavailable in our copy) identifies Seurat as an R toolkit in which the paper’s procedure was implemented, supporting the identification of the package. (LLM, conf=0.91)
- Supportedcites [6] Stuart T. Butler A. Hoffman P. Hafemeister C. Papalexi E. Mauck W.M. Hao Y. Stoeckius M. Smibert P. Satija R. Comprehensive integration of single-cell data Cell 177 2019 1888 1902.e21 10.1016/j.cell.2019.05.031 31178118 PMC6687398 source
The citation is attached to the Seurat package, not to the citing authors’ statements about developing hdWGCNA or its documentation website. The cited paper’s STAR Methods (Data and software availability) identify Seurat v3 as the package implementing its methods and give its CRAN and GitHub locations. (LLM, conf=0.91)
- Supportedcites [7] Hao Y. Hao S. Andersen-Nissen E. Mauck W.M. Zheng S. Butler A. Lee M.J. Wilk A.J. Darby C. Integrated analysis of multimodal single-cell data Cell 184 2021 3573 3587.e29 10.1016/j.cell.2021.04.048 34062119 PMC8238499 source
The citations are attached to the identification of Seurat, not to the citing authors’ statements about developing hdWGCNA or its website. The Introduction describes Seurat as an open-source R toolkit, and the STAR Methods key resources table lists Seurat v4 as software from this paper (page not provided). (LLM, conf=0.90)
boosted- Asserted: passes — The authors put it forward as true.
- Checkable: passes — It can be checked against evidence.
- Load-bearing: fails — The paper’s conclusions may not depend on it.
- Based: passes — The paper gives a reason why it holds.
Probably not a substantial claim. The paper’s conclusions may not depend on it. It may state two separate claims as one.
- Supported
Every source the paper cites for this claim was checked and supports it.
In the paper
“Cd9 encodes a transmembrane protein and is a known glioblastoma biomarker,40”
§ hdWGCNA identifies co-expression networks in high-dimensional transcriptomics data > Results > Isoform-level co-expression networks reveal cell fate decisions in the radial glia developmental lineage
What the sources say
- Supportedcites [40] Podergajs N. Motaln H. Rajčević U. Verbovšek U. Koršič M. Obad N. Espedal H. Vittori M. Herold-Mende C. Miletic H. Transmembrane protein CD9 is glioblastoma biomarker, relevant for maintenance of glioblastoma stem cells Oncotarget 7 2016 593 609 10.18632/oncotarget.5477 26573230 PMC4808020 source
The Abstract states that CD9 encodes a transmembrane protein and reports its up-regulation in glioblastoma tissue. The Introduction describes CD9 as a biomarker evaluated for glioblastoma stem cells, supporting the citing sentence's characterization. (LLM, conf=0.92)
boosted- Asserted: passes — The authors put it forward as true.
- Checkable: passes — It can be checked against evidence.
- Load-bearing: fails — The paper’s conclusions may not depend on it.
- Based: passes — The paper gives a reason why it holds.
Probably not a substantial claim. The paper’s conclusions may not depend on it. It may state two separate claims as one.
- Supported
The cited sources support only part of this claim — read each source’s verdict below.
In the paper
“Radial glia, which share transcriptomic similarities with mature astrocytes, are progenitor cells that give rise to numerous distinct cell fates, including neuronal cells, astrocytes, oligodendrocytes, and ependymal cells.34,35”
§ hdWGCNA identifies co-expression networks in high-dimensional transcriptomics data > Results > Isoform-level co-expression networks reveal cell fate decisions in the radial glia developmental lineage
What the sources say
- Partly supportedcites [34] Pollen A.A. Nowakowski T.J. Chen J. Retallack H. Sandoval-Espinosa C. Nicholas C.R. Shuga J. Liu S.J. Oldham M.C. Diaz A. Molecular identity of human outer radial glia during cortical development Cell 163 2015 55 67 10.1016/j.cell.2015.09.004 26406371 PMC4583716 sourceExperimental — accuracy not yet measured
The Results section, “Extensive Neurogenic Capacity of oRG Cells” (page unavailable), reports that outer radial glia share some genes with later astrocytes and that single cells produced neuronal and glial daughters. It does not establish broad transcriptomic similarity to mature astrocytes or identify astrocytes, oligodendrocytes, and ependymal cells as distinct daughter-cell fates. (LLM, conf=0.87)
- Partly supportedcites [35] Eze U.C. Bhaduri A. Haeussler M. Nowakowski T.J. Kriegstein A.R. Single-cell atlas of early human brain development highlights heterogeneity of human neuroepithelial cells and early radial glia Nat. Neurosci. 24 2021 584 594 10.1038/s41593-020-00794-1 33723434 PMC8012207 sourceExperimental — accuracy not yet measured
The Results (RNA-Velocity Analysis of Lineage; page unavailable) describe radial glia giving rise to neurons, and the Discussion (page unavailable) describes progenitors giving rise to neuronal and glial diversity. Our copy does not establish transcriptomic similarity between radial glia and mature astrocytes or identify astrocytes, oligodendrocytes, and ependymal cells as the specific fates claimed. (LLM, conf=0.85)
plaindirect- Asserted: passes — The authors put it forward as true.
- Checkable: passes — It can be checked against evidence.
- Load-bearing: fails — The paper’s conclusions may not depend on it.
- Based: passes — The paper gives a reason why it holds.
Probably not a substantial claim. The paper’s conclusions may not depend on it. It may state two separate claims as one.
- Partly supported
The sources with a verdict support this claim; the rest weren’t checked yet, have no full text we could read, or their verdicts aren’t rated yet.
In the paper
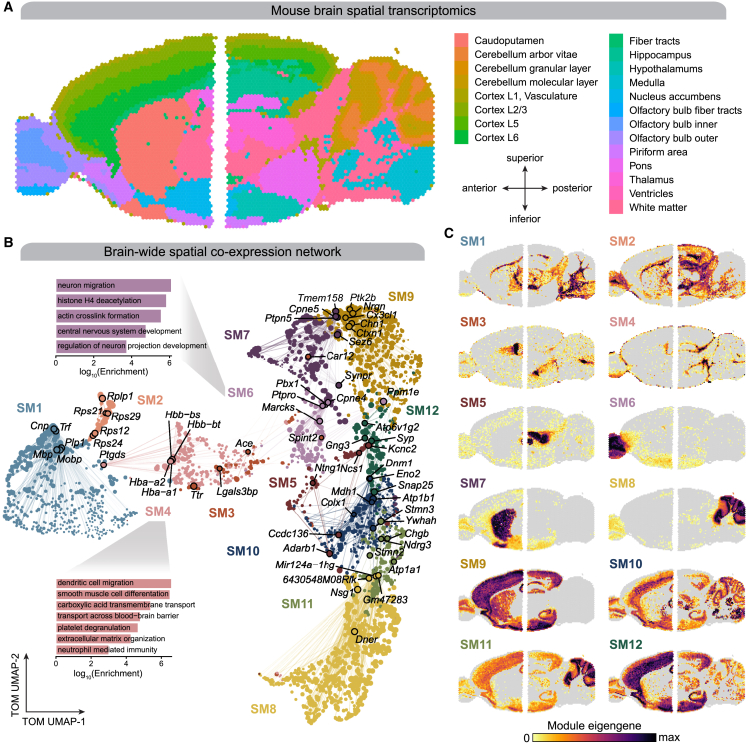
“ST enables the investigation of biological patterns that might otherwise be hidden in other -omics technologies, such as scRNA-seq or bulk RNA-seq.26,27”
§ hdWGCNA identifies co-expression networks in high-dimensional transcriptomics data > Results > Spatial co-expression networks represent regional expression patterns in the mouse brain
What the sources say
- Supportedcites [26] Moses L. Pachter L. Museum of Spatial Transcriptomics Preprint at bioRxiv 2021 10.1101/2021.05.11.443152 35273392 source
The Data analysis section says spatial transcriptomics enables identification of spatially variable genes and inference of cell–cell interactions. The Upstream section explains that spatial information enables analysis of neighboring cells and spatial gene patterns, supporting the claim that these patterns may be missed without spatial measurements. No page numbers are available in our copy. (LLM, conf=0.87)
- Not checked — no full text of the sourcecites [27] Moffitt J.R. Lundberg E. Heyn H. The emerging landscape of spatial profiling technologies Nat. Rev. Genet. 23 2022 741 759 10.1038/s41576-022-00515-3 35859028 source
hedgeddirect- Asserted: passes — The authors put it forward as true.
- Checkable: passes — It can be checked against evidence.
- Load-bearing: passes — The paper’s conclusions depend on it.
- Based: passes — The paper gives a reason why it holds.
Probably not a substantial claim.
- Supported
The cited sources support only part of this claim — read each source’s verdict below.
In the paper
“One of the INH-M13 hub genes is CHD2, whose de novo variants have been identified in individuals with ASD.42,43”
§ hdWGCNA identifies co-expression networks in high-dimensional transcriptomics data > Results > Co-expression network analysis of inhibitory neurons in ASD
What the sources say
- Supportedcites [42] Carvill G.L. Heavin S.B. Yendle S.C. McMahon J.M. O’Roak B.J. Cook J. Khan A. Dorschner M.O. Weaver M. Calvert S. Targeted resequencing in epileptic encephalopathies identifies de novo mutations in CHD2 and SYNGAP1 Nat. Genet. 45 2013 825 830 10.1038/ng.2646 23708187 PMC3704157 source
The Introductory section states that a de novo CHD2 missense mutation was reported in an individual with autism spectrum disorder. The paper presents this earlier finding as evidence that CHD2 mutations occur across neurodevelopmental disorders; the claim does not attribute that identification to this paper's own cohort. (LLM, conf=0.92)
- Could not verifycites [43] Neale B.M. Kou Y. Liu L. Ma’ayan A. Samocha K.E. Sabo A. Lin C.-F. Stevens C. Wang L.-S. Makarov V. Patterns and rates of exonic de novo mutations in autism spectrum disorders Nature 485 2012 242 245 10.1038/nature11011 22495311 PMC3613847 sourceExperimental — accuracy not yet measured
The Abstract (page unavailable) reports de novo variants in ASD cases and highlights CHD8, but it does not identify a CHD2 variant. Searches of our copy for “CHD2” and “chromodomain helicase DNA binding protein 2” found no passage establishing the gene-specific claim. (LLM, conf=0.73)
plain- Asserted: passes — The authors put it forward as true.
- Checkable: passes — It can be checked against evidence.
- Load-bearing: fails — The paper’s conclusions may not depend on it.
- Based: passes — The paper gives a reason why it holds.
Probably not a substantial claim. The paper’s conclusions may not depend on it.
- Supported
The cited sources support only part of this claim — read each source’s verdict below.
In the paper
“Microglia, the resident immune cells of the brain, are implicated in the pathology and genetic risk of several CNS diseases, including AD.46,47,48,49”
§ hdWGCNA identifies co-expression networks in high-dimensional transcriptomics data > Results > Consensus network analysis of microglia in AD
What the sources say
- Partly supportedcites [46] Jansen I.E. Savage J.E. Watanabe K. Bryois J. Williams D.M. Steinberg S. Sealock J. Karlsson I.K. Hägg S. Athanasiu L. Genome-wide meta-analysis identifies new loci and functional pathways influencing Alzheimer’s disease risk Nat. Genet. 51 2019 404 413 10.1038/s41588-018-0311-9 30617256 PMC6836675 sourceExperimental — accuracy not yet measured
The Results section (no page provided) reports suggestive associations between microglial gene expression and Alzheimer’s disease risk, and the Discussion links microglia to a hypothesis about AD pathogenesis. The study does not establish the same implication for several other CNS diseases; its microglia associations also did not survive the stringent Bonferroni correction. (LLM, conf=0.85)
- Partly supportedcites [47] Kunkle B.W. Grenier-Boley B. Sims R. Bis J.C. Damotte V. Naj A.C. Boland A. Vronskaya M. van der Lee S.J. Amlie-Wolf A. Genetic meta-analysis of diagnosed Alzheimer’s disease identifies new risk loci and implicates A, tau, immunity and lipid processing Nat. Genet. 51 2019 414 430 10.1038/s41588-019-0358-2 30820047 PMC6463297 sourceExperimental — accuracy not yet measured
The Results section (Candidate gene prioritization at genome-wide loci; page unavailable) links microglial gene expression to Alzheimer’s disease risk loci and describes microglia as involved in the pathological immune response in late-onset Alzheimer’s disease. The paper does not establish the same link for several CNS diseases, so the claim is supported for Alzheimer’s disease but not for the broader group. (LLM, conf=0.87)
- Partly supportedcites [48] Schwartzentruber J. Cooper S. Liu J.Z. Barrio-Hernandez I. Bello E. Kumasaka N. Young A.M.H. Franklin R.J.M. Johnson T. Estrada K. Genome-wide meta-analysis, fine-mapping and integrative prioritization implicate new Alzheimer’s disease risk genes Nat. Genet. 53 2021 392 402 10.1038/s41588-020-00776-w 33589840 PMC7610386 sourceExperimental — accuracy not yet measured
The Results section (‘AD risk is enriched near genes with high microglial gene expression’; page not provided) reports enrichment of Alzheimer’s disease risk near genes highly expressed in microglia. The paper also discusses a possible role for microglial activation in AD, but the passages do not extend that finding to several CNS diseases. (LLM, conf=0.88)
plaincorrelational- Asserted: passes — The authors put it forward as true.
- Checkable: passes — It can be checked against evidence.
- Load-bearing: fails — The paper’s conclusions may not depend on it.
- Based: passes — The paper gives a reason why it holds.
Probably not a substantial claim. The paper’s conclusions may not depend on it.
- Partly supported
Every source the paper cites for this claim was checked and supports it.
In the paper
“Similarly, rare loss-of-function mutations have been reported in the SCN2A gene, a hub gene of the INH-M11 module.44”
§ hdWGCNA identifies co-expression networks in high-dimensional transcriptomics data > Results > Co-expression network analysis of inhibitory neurons in ASD
What the sources say
- Supportedcites [44] Carroll L.S. Woolf R. Ibrahim Y. Williams H.J. Dwyer S. Walters J. Kirov G. O’Donovan M.C. Owen M.J. Mutation screening of SCN2A in schizophrenia and identification of a novel loss-of-function mutation Psychiatr. Genet. 26 2016 60 65 10.1097/ypg.0000000000000110 26555645 PMC4756433 source
The Results (Primary Analysis) identify a novel nonsense variant in SCN2A, and the Abstract (Conclusion) describes very rare loss-of-function mutations at this gene. These passages support the attributed claim that rare SCN2A loss-of-function mutations have been reported. (LLM, conf=0.94)
plain- Asserted: passes — The authors put it forward as true.
- Checkable: passes — It can be checked against evidence.
- Load-bearing: fails — The paper’s conclusions may not depend on it.
- Based: passes — The paper gives a reason why it holds.
Probably not a substantial claim. The paper’s conclusions may not depend on it.
- Supported
The cited sources support only part of this claim — read each source’s verdict below.
In the paper
“Transcriptomic and epigenomic studies in human tissue and AD mouse models have identified multiple cell states of microglia, representing a spectrum between homeostatic and disease-associated microglia (DAMs).12,50,51”
§ hdWGCNA identifies co-expression networks in high-dimensional transcriptomics data > Results > Consensus network analysis of microglia in AD
What the sources say
- Supportedcites [12] Morabito S. Miyoshi E. Michael N. Shahin S. Martini A.C. Head E. Silva J. Leavy K. Perez-Rosendahl M. Swarup V. Single-nucleus chromatin accessibility and transcriptomic characterization of Alzheimer’s disease Nat. Genet. 53 2021 1143 1155 10.1038/s41588-021-00894-z 34239132 PMC8766217 source
The Results section, “Microglia trajectory to define disease-associated microglia,” describes a trajectory with decreasing homeostatic and increasing stage 1 disease-associated signatures. It explicitly interprets that trajectory as a transition from a homeostatic to a disease-associated cell state. (LLM, conf=0.93)
- Supportedcites [50] Keren-Shaul H. Spinrad A. Weiner A. Matcovitch-Natan O. Dvir-Szternfeld R. Ulland T.K. David E. Baruch K. Lara-Astaiso D. Toth B. A unique microglia type associated with restricting development of Alzheimer’s disease Cell 169 2017 1276 1290.e17 10.1016/j.cell.2017.05.018 28602351 source
The Results describe homeostatic microglia and disease-associated microglia (DAM) at opposite ends of a graph, with intermediate cells connecting them. The paper also reports a transition between these states as disease progresses in an AD mouse model. (LLM, conf=0.93)
- Partly supportedcites [51] Sala Frigerio C. Wolfs L. Fattorelli N. Thrupp N. Voytyuk I. Schmidt I. Mancuso R. Chen W.-T. Woodbury M.E. Srivastava G. The major risk factors for Alzheimer’s disease: age, sex, and genes modulate the microglia response to A plaques Cell Rep. 27 2019 1293 1306.e6 10.1016/j.celrep.2019.03.099 31018141 PMC7340153 sourceExperimental — accuracy not yet measured
The Discussion (page not provided) describes multiple microglial states on a continuous spectrum from homeostatic cells along two response branches. It says the ARMs response overlaps with DAMs, but cautions that calling these cells “disease-associated” is misleading because they also occur in healthy mice. The paper supports the spectrum claim, but not a simple homeostatic-to-DAM continuum. (LLM, conf=0.86)
plaincorrelational- Asserted: passes — The authors put it forward as true.
- Checkable: passes — It can be checked against evidence.
- Load-bearing: passes — The paper’s conclusions depend on it.
- Based: passes — The paper gives a reason why it holds.
Probably not a substantial claim.
- Supported
The cited sources support only part of this claim — read each source’s verdict below.
In the paper
“CD163, a hub gene of MG-M4, is known to be involved in the breakdown of the blood-brain barrier.53,54”
§ hdWGCNA identifies co-expression networks in high-dimensional transcriptomics data > Results > Consensus network analysis of microglia in AD
What the sources say
- Partly supportedcites [53] Borda J.T. Alvarez X. Mohan M. Hasegawa A. Bernardino A. Jean S. Aye P. Lackner A.A. CD163, a marker of perivascular macrophages, is up-regulated by microglia in simian immunodeficiency virus encephalitis after haptoglobin-hemoglobin complex stimulation and is suggestive of breakdown of the blood-brain barrier Am. J. Pathol. 172 2008 725 737 10.2353/ajpath.2008.070848 18276779 PMC2258269 sourceExperimental — accuracy not yet measured
The section “Co-Localization of CD163 Expression and Its Ligand Hp-Hb Complex” reports that blood-brain barrier breakdown was associated with microglial CD163 expression in encephalitic macaque brain. It proposes that barrier damage leads to CD163 up-regulation, not that CD163 causes or contributes to the breakdown; the claim overstates that relationship. (LLM, conf=0.86)
- Partly supportedcites [54] Pey P. Pearce R.K.B. Kalaitzakis M.E. Griffin W.S.T. Gentleman S.M. Phenotypic profile of alternative activation marker CD163 is different in Alzheimer’s and Parkinson’s disease Acta Neuropathol. Commun. 2 2014 21 10.1186/2051-5960-2-21 24528486 PMC3940003 sourceExperimental — accuracy not yet measured
The Discussion (page not supplied) reports that some CD163-positive microglia coincided with fibrinogen leakage, an indication of blood–brain barrier breakdown. It suggests that vascular compromise might allow CD163-positive macrophages to enter the brain, but does not establish that CD163 itself contributes to the breakdown or that such a role is known. (LLM, conf=0.86)
boostedcorrelational- Asserted: passes — The authors put it forward as true.
- Checkable: passes — It can be checked against evidence.
- Load-bearing: fails — The paper’s conclusions may not depend on it.
- Based: passes — The paper gives a reason why it holds.
Probably not a substantial claim. The paper’s conclusions may not depend on it.
- Partly supported
Every source the paper cites for this claim was checked and supports it.
In the paper
“Our previous study defined a set of transcription factors, genes, and cis-regulatory elements involved in the shift between homeostatic and DAM cell states in human AD, identifying shared and distinct signatures compared with the DAM signature from 5xFAD mice.12”
§ hdWGCNA identifies co-expression networks in high-dimensional transcriptomics data > Results > Consensus network analysis of microglia in AD
What the sources say
- Supportedcites [12] Morabito S. Miyoshi E. Michael N. Shahin S. Martini A.C. Head E. Silva J. Leavy K. Perez-Rosendahl M. Swarup V. Single-nucleus chromatin accessibility and transcriptomic characterization of Alzheimer’s disease Nat. Genet. 53 2021 1143 1155 10.1038/s41588-021-00894-z 34239132 PMC8766217 source
Split into 2 atoms — 2 confirmed, 0 partially supported, 0 disputed, 0 misattributed, 0 unverifiable. Expand the claim to see per-atom verdicts.
plaincorrelational- Asserted: passes — The authors put it forward as true.
- Checkable: passes — It can be checked against evidence.
- Load-bearing: passes — The paper’s conclusions depend on it.
- Based: passes — The paper gives a reason why it holds.
Probably not a substantial claim.
- Supported
Every source the paper cites for this claim was checked and supports it.
In the paper
“Co-expression networks have been successful for analyzing bulk proteomics datasets in human disease samples,67,68”
§ hdWGCNA identifies co-expression networks in high-dimensional transcriptomics data > Discussion
What the sources say
- Supportedcites [67] Swarup V. Chang T.S. Duong D.M. Dammer E.B. Dai J. Lah J.J. Johnson E.C.B. Seyfried N.T. Levey A.I. Geschwind D.H. Identification of conserved proteomic networks in neurodegenerative dementia Cell Rep. 31 2020 107807 10.1016/j.celrep.2020.107807 PMC8221021 32579933 source
The Results section reports using co-expression network analysis on proteomic data from five human brain-bank cohorts and identifying modules associated with Alzheimer’s disease. The Discussion describes these as robust disease-associated proteomic networks, supporting the broad claim that the approach has been successful for human disease proteomics datasets. (LLM, conf=0.92)
- Supportedcites [68] Johnson E.C.B. Dammer E.B. Duong D.M. Ping L. Zhou M. Yin L. Higginbotham L.A. Guajardo A. White B. Troncoso J.C. Large-scale proteomic analysis of Alzheimer’s disease brain and cerebrospinal fluid reveals early changes in energy metabolism associated with microglia and astrocyte activation Nat. Med. 26 2020 769 780 10.1038/s41591-020-0815-6 32284590 PMC7405761 source
The Results section, “Construction and Validation of a Consensus AD Protein Co-Expression Network” (page not provided), reports a robust network built from mass spectrometry proteomics of more than 450 human brain tissues. Its modules were preserved in an independent cohort, and many correlated with Alzheimer’s disease pathology and cognitive function. This supports the broad claim that co-expression networks have been successful in analyzing bulk proteomics data from human disease samples. (LLM, conf=0.93)
plaincorrelational- Asserted: passes — The authors put it forward as true.
- Checkable: passes — It can be checked against evidence.
- Load-bearing: fails — The paper’s conclusions may not depend on it.
- Based: passes — The paper gives a reason why it holds.
Probably not a substantial claim. The paper’s conclusions may not depend on it.
- Supported
The cited sources support only part of this claim — read each source’s verdict below.
In the paper
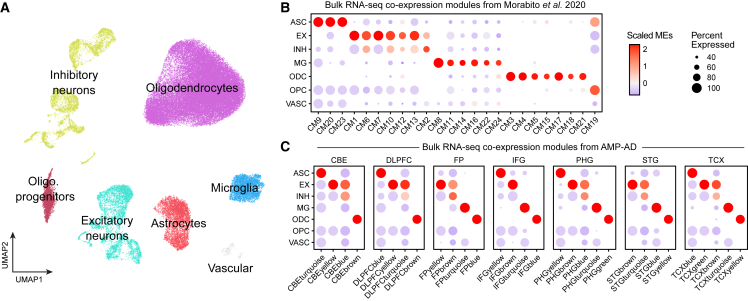
“These studies both used AD samples and controls from the same patient cohorts (Religious Orders Study and Memory and Aging Project, Mayo Clinic, Mount Sinai School of Medicine),64,65,66 but they took unique approaches for co-expression network analysis.”
§ hdWGCNA identifies co-expression networks in high-dimensional transcriptomics data > Results > Projecting network modules from bulk RNA-seq cohorts into relevant single-cell datasets
What the sources say
- Partly supportedcites [64] Mostafavi S. Gaiteri C. Sullivan S.E. White C.C. Tasaki S. Xu J. Taga M. Klein H.-U. Patrick E. Komashko V. A molecular network of the aging human brain provides insights into the pathology and cognitive decline of Alzheimer’s disease Nat. Neurosci. 21 2018 811 819 10.1038/s41593-018-0154-9 29802388 PMC6599633 sourceExperimental — accuracy not yet measured
The Results section, “Data origin and phenotypes” (page unavailable), identifies this study’s participants as coming from the Religious Orders Study and Rush Memory and Aging Project; the RNA-Seq results describe analysis of 478 participants. The Introduction and “Constructing the nodes of our module-trait network” describe its co-expression network approach and how it differs from prior approaches. Our copy does not establish that both studies used the same cohorts, including Mayo Clinic and Mount Sinai, so that comparison is not supported by this source. (LLM, conf=0.86)
- Supportedcites [65] Allen M. Carrasquillo M.M. Funk C. Heavner B.D. Zou F. Younkin C.S. Burgess J.D. Chai H.-S. Crook J. Eddy J.A. Human whole genome genotype and transcriptome data for Alzheimer’s and other neurodegenerative diseases Sci. Data 3 2016 160089 10.1038/sdata.2016.89 PMC5058336 27727239 source
The citation follows the cohort list; this paper supports the Mayo Clinic portion of that list. Methods > Study Populations reports RNA-seq samples from people with AD and controls in the Mayo cohort. The sentence’s comparison of co-expression approaches is outside the portion supported by this citation. (LLM, conf=0.89)
- Supportedcites [66] Wang M. Beckmann N.D. Roussos P. Wang E. Zhou X. Wang Q. Ming C. Neff R. Ma W. Fullard J.F. The Mount Sinai cohort of large-scale genomic, transcriptomic and proteomic data in Alzheimer’s disease Sci. Data 5 2018 180185 10.1038/sdata.2018.185 PMC6132187 30204156 source
The citation is attached to the list of patient cohorts, including Mount Sinai, rather than to the comparison of co-expression methods. The Background & Summary identifies this source as RNA-seq data from postmortem control and AD brains, and Methods identifies the Mount Sinai brain-bank cohort. No page numbers are provided in our copy. (LLM, conf=0.90)
plain- Asserted: passes — The authors put it forward as true.
- Checkable: passes — It can be checked against evidence.
- Load-bearing: unclear — It is unclear whether the paper’s conclusions depend on it.
- Based: passes — The paper gives a reason why it holds.
It may state two separate claims as one.
- Partly supported
Every source the paper cites for this claim was checked and supports it.
In the paper
“and in another study we showed that scWGCNA was suitable for network analysis using scRNA-seq alone.28”
§ hdWGCNA identifies co-expression networks in high-dimensional transcriptomics data > STAR★Methods > Method details
What the sources say
- Supportedcites [28] Kiani Shabestari S. Morabito S. Danhash E.P. McQuade A. Sanchez J.R. Miyoshi E. Chadarevian J.P. Claes C. Coburn M.A. Hasselmann J. Absence of microglia promotes diverse pathologies and early lethality in Alzheimer’s disease mice Cell Rep. 39 2022 110961 10.1016/j.celrep.2022.110961 PMC9285116 35705056 source
The STAR★METHODS Quantification and Statistical Analysis section reports that the authors performed scWGCNA on gene-expression profiles from individual nuclei, constructed co-expression networks, and identified modules. The Method Details section identifies the input as single-nucleus RNA-sequencing data. This demonstrates network analysis using sequencing-derived expression data alone, although the experiment used nuclei rather than whole cells; page numbers were not available in our copy. (LLM, conf=0.86)
plain- Asserted: passes — The authors put it forward as true.
- Checkable: passes — It can be checked against evidence.
- Load-bearing: fails — The paper’s conclusions may not depend on it.
- Based: passes — The paper gives a reason why it holds.
Probably not a substantial claim. The paper’s conclusions may not depend on it.
- Supported
Every source the paper cites for this claim was checked and supports it.
In the paper
“Contrasting the hdWGCNA package, the implementation of scWGCNA was an R package containing a single function for metacell construction, and a single tutorial to cover the basics of network analysis using the WGCNA package1 with the metacell matrix.”
§ hdWGCNA identifies co-expression networks in high-dimensional transcriptomics data > STAR★Methods > Method details
What the sources say
- Supportedcites [1] Langfelder P. Horvath S. WGCNA: an R package for weighted correlation network analysis BMC Bioinf. 9 2008 559 10.1186/1471-2105-9-559 PMC2631488 19114008 source
The citation is attached to “the WGCNA package,” not to the description of scWGCNA’s implementation. The Results section (“Overview of functions included in the WGCNA package”) identifies WGCNA as an R package for correlation network analysis, which supports that identification. (LLM, conf=0.91)
plain- Asserted: passes — The authors put it forward as true.
- Checkable: passes — It can be checked against evidence.
- Load-bearing: fails — The paper’s conclusions may not depend on it.
- Based: passes — The paper gives a reason why it holds.
Probably not a substantial claim. The paper’s conclusions may not depend on it.
- Supported
Every source the paper cites for this claim was checked and supports it.
In the paper
“Unlike other network analysis pipelines such as single-cell regulatory network inference and clustering (SCENIC)70 or CellChat,71 hdWGCNA is a purely unsupervised approach and does not require prior knowledge or databases in the inference procedure.”
§ hdWGCNA identifies co-expression networks in high-dimensional transcriptomics data > Discussion
What the sources say
- Supportedcites [70] Aibar S. González-Blas C.B. Moerman T. Huynh-Thu V.A. Imrichova H. Hulselmans G. Rambow F. Marine J.-C. Geurts P. Aerts J. SCENIC: single-cell regulatory network inference and clustering Nat. Methods 14 2017 1083 1086 10.1038/nmeth.4463 28991892 PMC5937676 source
The citation to SCENIC supports the contrast with hdWGCNA, not the claim about hdWGCNA itself. SCENIC’s Online Methods (RcisTarget; page unavailable) state that its inference workflow uses a database of motif rankings and identify the motif databases used in the paper. (LLM, conf=0.92)
- Supportedcites [71] Jin S. Guerrero-Juarez C.F. Zhang L. Chang I. Ramos R. Kuan C.-H. Myung P. Plikus M.V. Nie Q. Inference and analysis of cell-cell communication using CellChat Nat. Commun. 12 2021 1088 10.1038/s41467-021-21246-9 33597522 PMC7889871 source
The citation is attached to CellChat as a contrasting example, not to the claim about hdWGCNA itself. The Results (Overview of CellChat; page unavailable) describe CellChatDB as a literature-supported database of known ligand–receptor interactions used to predict intercellular communication. This supports the attributed contrast: CellChat’s inference uses prior biological knowledge rather than being purely unsupervised. (LLM, conf=0.91)
plain- Asserted: passes — The authors put it forward as true.
- Checkable: passes — It can be checked against evidence.
- Load-bearing: unclear — It is unclear whether the paper’s conclusions depend on it.
- Based: passes — The paper gives a reason why it holds.
It may state two separate claims as one.
- Supported
Every source the paper cites for this claim was checked and supports it.
In the paper
“The AMP-AD study from Wan et al.63 performed network analysis separately from each brain region, while, in our previous study,56 we performed consensus network analysis across the different brain regions.”
§ hdWGCNA identifies co-expression networks in high-dimensional transcriptomics data > Results > Projecting network modules from bulk RNA-seq cohorts into relevant single-cell datasets
What the sources say
- Supportedcites [63] Wan Y.-W. Al-Ouran R. Mangleburg C.G. Perumal T.M. Lee T.V. Allison K. Swarup V. Funk C.C. Gaiteri C. Allen M. Wang M. Meta-analysis of the Alzheimer’s disease human brain transcriptome and functional dissection in mouse models Cell Rep. 32 2020 107908 10.1016/j.celrep.2020.107908 PMC7428328 32668255 source
The STAR Methods (Network Inference and Module Identification) state that network module identification methods were applied to each of seven tissue-specific datasets. The Results (A Consensus Atlas of AD-Associated Transcriptional Modules from Human Brain) report brain region-specific coexpression and consensus modules. The paper also compares modules across regions later, but that does not change how the initial network analyses were performed. (LLM, conf=0.94)
plain- Asserted: passes — The authors put it forward as true.
- Checkable: passes — It can be checked against evidence.
- Load-bearing: fails — The paper’s conclusions may not depend on it.
- Based: passes — The paper gives a reason why it holds.
Probably not a substantial claim. The paper’s conclusions may not depend on it.
- Supported
Every source the paper cites for this claim was checked and supports it.
In the paper
“hdWGCNA greatly extends upon scWGCNA,12 our previous method for co-expression network analysis in single-cell transcriptomics data.”
§ hdWGCNA identifies co-expression networks in high-dimensional transcriptomics data > STAR★Methods > Method details
What the sources say
- Supportedcites [12] Morabito S. Miyoshi E. Michael N. Shahin S. Martini A.C. Head E. Silva J. Leavy K. Perez-Rosendahl M. Swarup V. Single-nucleus chromatin accessibility and transcriptomic characterization of Alzheimer’s disease Nat. Genet. 53 2021 1143 1155 10.1038/s41588-021-00894-z 34239132 PMC8766217 source
The Methods section says the authors developed scWGCNA as a co-expression network analysis approach for single-cell data. The Discussion likewise describes it as a method they introduced for cell population-specific co-expression networks. The citation identifies the earlier method; the claim that hdWGCNA extends it is the citing authors’ own comparison. (LLM, conf=0.93)
boosteddirect- Asserted: passes — The authors put it forward as true.
- Checkable: passes — It can be checked against evidence.
- Load-bearing: passes — The paper’s conclusions depend on it.
- Based: passes — The paper gives a reason why it holds.
Probably not a substantial claim.
- Supported
Every source the paper cites for this claim was checked and supports it.
In the paper
“The AMP-AD study from Wan et al.63 performed network analysis separately from each brain region, while, in our previous study,56 we performed consensus network analysis across the different brain regions.”
§ hdWGCNA identifies co-expression networks in high-dimensional transcriptomics data > Results > Projecting network modules from bulk RNA-seq cohorts into relevant single-cell datasets
What the sources say
- Supportedcites [56] Morabito S. Miyoshi E. Michael N. Swarup V. Integrative genomics approach identifies conserved transcriptomic networks in Alzheimer’s disease Hum. Mol. Genet. 29 2020 2899 2919 10.1093/hmg/ddaa182 32803238 PMC7566321 source
The Results (Figure 1) describe consensus weighted gene co-expression network analysis using datasets from several brain regions. The Materials and Methods section, “Consensus WGCNA,” confirms that the study performed this analysis across the ROSMAP, Mayo, and MSSM datasets. (LLM, conf=0.94)
plain- Asserted: passes — The authors put it forward as true.
- Checkable: passes — It can be checked against evidence.
- Load-bearing: fails — The paper’s conclusions may not depend on it.
- Based: passes — The paper gives a reason why it holds.
Probably not a substantial claim. The paper’s conclusions may not depend on it.
- Supported
Every source the paper cites for this claim was checked and supports it.
In the paper
“scWGCNA was originally used to identify co-expression networks using bulk and single-cell RNA-seq together,12”
§ hdWGCNA identifies co-expression networks in high-dimensional transcriptomics data > STAR★Methods > Method details
What the sources say
- Supportedcites [12] Morabito S. Miyoshi E. Michael N. Shahin S. Martini A.C. Head E. Silva J. Leavy K. Perez-Rosendahl M. Swarup V. Single-nucleus chromatin accessibility and transcriptomic characterization of Alzheimer’s disease Nat. Genet. 53 2021 1143 1155 10.1038/s41588-021-00894-z 34239132 PMC8766217 source
The Methods section says the authors developed scWGCNA by integrating single-nucleus and bulk-tissue RNA-seq datasets. The Results section says they used it to jointly form co-expression networks from those datasets. Single-nucleus RNA-seq is the specific form of single-cell data used here. (LLM, conf=0.94)
plaindirect- Asserted: passes — The authors put it forward as true.
- Checkable: passes — It can be checked against evidence.
- Load-bearing: fails — The paper’s conclusions may not depend on it.
- Based: passes — The paper gives a reason why it holds.
Probably not a substantial claim. The paper’s conclusions may not depend on it.
- Supported
Every source the paper cites for this claim was checked and supports it.
In the paper
“Connected genes in biological networks are potentially involved in the same processes, and EGAD evaluates this network property given a set of gene-process annotations.”
§ hdWGCNA identifies co-expression networks in high-dimensional transcriptomics data > STAR★Methods > Quantification and statistical analysis
What the sources say
- Supportedcites [23] Ballouz S. Weber M. Pavlidis P. Gillis J. EGAD: ultra-fast functional analysis of gene networks Bioinformatics 33 2017 612 614 10.1093/bioinformatics/btw695 27993773 PMC6041978 source
The “Neighbor-voting for network analysis and gene function prediction” section states the guilt-by-association principle that genes with shared functions are preferentially connected. It also says EGAD takes a gene network and gene annotations as input and measures how well connected genes align with an annotated functional group. (LLM, conf=0.94)
hedgedcorrelational- Asserted: passes — The authors put it forward as true.
- Checkable: passes — It can be checked against evidence.
- Load-bearing: passes — The paper’s conclusions depend on it.
- Based: passes — The paper gives a reason why it holds.
Probably not a substantial claim.
- Supported
Every source the paper cites for this claim was checked and supports it.
In the paper
“Connected genes in biological networks are potentially involved in the same processes, and EGAD evaluates this network property given a set of gene-process annotations.”
§ hdWGCNA identifies co-expression networks in high-dimensional transcriptomics data > STAR★Methods > Quantification and statistical analysis
What the sources say
- Supportedcites [23] Ballouz S. Weber M. Pavlidis P. Gillis J. EGAD: ultra-fast functional analysis of gene networks Bioinformatics 33 2017 612 614 10.1093/bioinformatics/btw695 27993773 PMC6041978 source
The Abstract says EGAD assesses how well a gene network groups known sets of genes. The “Gene networks and gene annotation sets” section defines those sets as functional groups, including biological processes, represented by gene–group annotations. Together, these passages support the description of EGAD as evaluating functional coherence using gene-process annotations; page numbers were not provided. (LLM, conf=0.92)
plain- Asserted: passes — The authors put it forward as true.
- Checkable: passes — It can be checked against evidence.
- Load-bearing: passes — The paper’s conclusions depend on it.
- Based: passes — The paper gives a reason why it holds.
Probably not a substantial claim.
- Supported
Every source the paper cites for this claim was checked and supports it.
In the paper
“among which a gene set by Jansen et al.46 provided the set of genes associated with AD.”
§ hdWGCNA identifies co-expression networks in high-dimensional transcriptomics data > STAR★Methods > Quantification and statistical analysis
What the sources say
- Supportedcites Jansen et al.46 Jansen I.E. Savage J.E. Watanabe K. Bryois J. Williams D.M. Steinberg S. Sealock J. Karlsson I.K. Hägg S. Athanasiu L. Genome-wide meta-analysis identifies new loci and functional pathways influencing Alzheimer’s disease risk Nat. Genet. 51 2019 404 413 10.1038/s41588-018-0311-9 30617256 PMC6836675 source
The Results section (‘Implicated genes’) reports 192 uniquely mapped genes linked to AD-associated variants. The Results section (‘Gene-sets implicated in AD and AD-by-proxy’) also identifies gene-sets significantly associated with AD risk. These passages support citing Jansen et al. as a source of AD-associated genes. (LLM, conf=0.90)
plaincorrelational- Asserted: passes — The authors put it forward as true.
- Checkable: passes — It can be checked against evidence.
- Load-bearing: passes — The paper’s conclusions depend on it.
- Based: passes — The paper gives a reason why it holds.
Probably not a substantial claim.
- Supported
The cited sources support only part of this claim — read each source’s verdict below.
In the paper
“Notably, SEACells and Metacell2 do not account for cell labels in their aggregation procedures, which may result in a number of metacells containing transcriptomes from differently labeled cells.”
§ hdWGCNA identifies co-expression networks in high-dimensional transcriptomics data > STAR★Methods > Quantification and statistical analysis
What the sources say
- Partly supportedcites [14] Ben-Kiki O. Bercovich A. Lifshitz A. Tanay A. Metacell-2: a divide-and-conquer metacell algorithm for scalable scRNA-seq analysis Genome Biol. 23 2022 100 10.1186/s13059-022-02667-1 35440087 PMC9019975 sourceExperimental — accuracy not yet measured
The Methods sections on graph construction and the divide-and-conquer algorithm describe forming Metacell-2 metacells from gene-expression correlations and graph partitions, without using cell labels. That supports the Metacell-2 portion and makes mixed-label metacells a plausible possibility, but the paper does not establish how many such metacells occur or address SEACells. (LLM, conf=0.83)
- Supportedcites [16] Persad S. Choo Z.-N. Dien C. Sohail N. Masilionis I. Chaligné R. Nawy T. Brown C.C. Sharma R. Pe’er I. SEACells infers transcriptional and epigenomic cellular states from single-cell genomics data Nat. Biotechnol. 2023 10.1038/s41587-023-01716-9 PMC10713451 36973557 source
The Methods (SEACells algorithm; no page given) describe assigning cells to metacells by archetypal analysis of a cell-similarity matrix, then annotating the resulting metacells by their most frequent cell type. The Methods (Robustness of SEACells algorithm; no page given) assess cell-type purity for both SEACells and MetaCell-2 metacells, consistent with metacells being able to contain differently labeled cells. (LLM, conf=0.86)
hedgedconditional- Asserted: passes — The authors put it forward as true.
- Checkable: passes — It can be checked against evidence.
- Load-bearing: passes — The paper’s conclusions depend on it.
- Based: passes — The paper gives a reason why it holds.
It may state two separate claims as one.
- Partly supported
The cited sources support only part of this claim — read each source’s verdict below.
In the paper
“Of the 121,451 cells in this dataset, 20,249 were labeled as inhibitory neurons based on marker gene expression profiles.”
§ hdWGCNA identifies co-expression networks in high-dimensional transcriptomics data > STAR★Methods > Quantification and statistical analysis
What the sources say
- Partly supportedcites Velmeshev et al.9 Velmeshev D. Schirmer L. Jung D. Haeussler M. Perez Y. Mayer S. Bhaduri A. Goyal N. Rowitch D.H. Kriegstein A.R. Single-cell genomics identifies cell type–specific molecular changes in autism Science 364 2019 685 689 10.1126/science.aav8130 31097668 PMC7678724 sourceExperimental — accuracy not yet measured
The paper’s clustering passage (section labeled Abstract; page unavailable) says it annotated cell types, including interneurons, using known cell-type markers. Its sequencing passage reports 104,559 ASD-and-control nuclei plus 21,984 additional epilepsy-and-control profiles; our copy does not establish the claimed total of 121,451 cells or the count of 20,249 inhibitory neurons. (LLM, conf=0.85)
plain- Asserted: passes — The authors put it forward as true.
- Checkable: passes — It can be checked against evidence.
- Load-bearing: passes — The paper’s conclusions depend on it.
- Based: passes — The paper gives a reason why it holds.
Probably not a substantial claim.
- Partly supported
The paper states this without a source or data behind it here, so there is nothing to check it against. The quote shows it is in the paper.
In the paper
“Beyond conventional single-cell RNA-seq, hdWGCNA is capable of performing isoform-level network analysis using long-read single-cell data.”
§ hdWGCNA identifies co-expression networks in high-dimensional transcriptomics data > Abstract
plaindirect- Asserted: passes — The authors put it forward as true.
- Checkable: passes — It can be checked against evidence.
- Load-bearing: fails — The paper’s conclusions may not depend on it.
- Based: fails — The paper may give no reason why it holds.
Probably not a substantial claim. The paper’s conclusions may not depend on it. The paper may give no reason why it holds.
The paper states this without a source or data behind it here, so there is nothing to check it against. The quote shows it is in the paper.
In the paper
“hdWGCNA is directly compatible with Seurat, a widely used R package for single-cell and spatial transcriptomics analysis”
§ hdWGCNA identifies co-expression networks in high-dimensional transcriptomics data > Abstract
plaincorrelational- Asserted: passes — The authors put it forward as true.
- Checkable: passes — It can be checked against evidence.
- Load-bearing: fails — The paper’s conclusions may not depend on it.
- Based: fails — The paper may give no reason why it holds.
Probably not a substantial claim. The paper’s conclusions may not depend on it. The paper may give no reason why it holds.
The paper states this without a source or data behind it here, so there is nothing to check it against. The quote shows it is in the paper.
In the paper
“hdWGCNA provides functions for network inference, gene module identification, gene enrichment analysis, statistical tests, and data visualization.”
§ hdWGCNA identifies co-expression networks in high-dimensional transcriptomics data > Abstract
plain- Asserted: passes — The authors put it forward as true.
- Checkable: passes — It can be checked against evidence.
- Load-bearing: passes — The paper’s conclusions depend on it.
- Based: passes — The paper gives a reason why it holds.
Probably not a substantial claim. It may state two separate claims as one.
None of the sources cited for this claim have been checked yet.
In the paper
“hdWGCNA computes MEs using specific accommodations for high-dimensional data, allowing for batch correction and regression of continuous covariates (STAR Methods, Algorithm 2).”
§ hdWGCNA identifies co-expression networks in high-dimensional transcriptomics data > Results > Constructing co-expression networks from high-dimensional transcriptomics data
plaindirect- Asserted: passes — The authors put it forward as true.
- Checkable: passes — It can be checked against evidence.
- Load-bearing: passes — The paper’s conclusions depend on it.
- Based: passes — The paper gives a reason why it holds.
It may state two separate claims as one.
The paper states this without a source or data behind it here, so there is nothing to check it against. The quote shows it is in the paper.
In the paper
“The runtime of the MetacellsByGroups function increased steadily with the number of cells, but the memory usage plateaus.”
§ hdWGCNA identifies co-expression networks in high-dimensional transcriptomics data > Results > Runtime, memory usage, and evaluation of hdWGCNA
plaindirectn = 54- Asserted: passes — The authors put it forward as true.
- Checkable: passes — It can be checked against evidence.
- Load-bearing: unclear — It is unclear whether the paper’s conclusions depend on it.
- Based: passes — The paper gives a reason why it holds.
It may state two separate claims as one.
A result the paper reports from its own data — it cites no other source for it, so there is none to check. The quote shows it is in the paper.
In the paper
“we used hdWGCNA to analyze a single-cell RNA sequencing (scRNA-seq) dataset consisting of 1 million cells, showcasing the scalability of hdWGCNA in large datasets.”
§ hdWGCNA identifies co-expression networks in high-dimensional transcriptomics data > Introduction
plaindirectSingle case- Asserted: passes — The authors put it forward as true.
- Checkable: passes — It can be checked against evidence.
- Load-bearing: passes — The paper’s conclusions depend on it.
- Based: passes — The paper gives a reason why it holds.
It may state two separate claims as one.
A result the paper reports from its own data — it cites no other source for it, so there is none to check. The quote shows it is in the paper.
In the paper
“The inhibitory neuron network performed the best for functional coherence with a median neighbor-voting AUC of 0.592, while the lowest-performing network was from the oligodendrocytes with a median AUC of 0.549.”
§ hdWGCNA identifies co-expression networks in high-dimensional transcriptomics data > Results > Runtime, memory usage, and evaluation of hdWGCNA
plaincorrelational- Asserted: passes — The authors put it forward as true.
- Checkable: passes — It can be checked against evidence.
- Load-bearing: unclear — It is unclear whether the paper’s conclusions depend on it.
- Based: passes — The paper gives a reason why it holds.
It may state two separate claims as one.
- The authors state this as an assumption: Co-expressed genes are involved in similar biological processes, so co-expression network structures should be predictive of biological pathway membership.
The paper states this without a source or data behind it here, so there is nothing to check it against. The quote shows it is in the paper.
In the paper
“we designed hdWGCNA to facilitate multi-scale analysis of cellular and spatial hierarchies.”
§ hdWGCNA identifies co-expression networks in high-dimensional transcriptomics data > Introduction
plaindirect- Asserted: passes — The authors put it forward as true.
- Checkable: passes — It can be checked against evidence.
- Load-bearing: passes — The paper’s conclusions depend on it.
- Based: passes — The paper gives a reason why it holds.
Probably not a substantial claim.
A result the paper reports from its own data — it cites no other source for it, so there is none to check. The quote shows it is in the paper.
In the paper
“While TestSoftPowers generally had a low memory footprint, it was the slowest individual function based on these tests.”
§ hdWGCNA identifies co-expression networks in high-dimensional transcriptomics data > Results > Runtime, memory usage, and evaluation of hdWGCNA
plain- Asserted: passes — The authors put it forward as true.
- Checkable: passes — It can be checked against evidence.
- Load-bearing: fails — The paper’s conclusions may not depend on it.
- Based: passes — The paper gives a reason why it holds.
Probably not a substantial claim. The paper’s conclusions may not depend on it. It may state two separate claims as one.
The paper states this without a source or data behind it here, so there is nothing to check it against. The quote shows it is in the paper.
In the paper
“The efficiency of ConstructNetwork varies both with the number of input cells and features, where this calculation will slow down as more cells and features are included.”
§ hdWGCNA identifies co-expression networks in high-dimensional transcriptomics data > Results > Runtime, memory usage, and evaluation of hdWGCNA
plaindirect- Asserted: passes — The authors put it forward as true.
- Checkable: passes — It can be checked against evidence.
- Load-bearing: fails — The paper’s conclusions may not depend on it.
- Based: passes — The paper gives a reason why it holds.
Probably not a substantial claim. The paper’s conclusions may not depend on it.
The paper states this without a source or data behind it here, so there is nothing to check it against. The quote shows it is in the paper.
In the paper
“Finally, ModuleConnectivity computes eigengene-based connectivity as product-moment correlation coefficients between the sparse gene expression matrix and the MEs matrix, which resulted in fast calculations with low memory usage.”
§ hdWGCNA identifies co-expression networks in high-dimensional transcriptomics data > Results > Runtime, memory usage, and evaluation of hdWGCNA
plaindirect- Asserted: passes — The authors put it forward as true.
- Checkable: passes — It can be checked against evidence.
- Load-bearing: passes — The paper’s conclusions depend on it.
- Based: passes — The paper gives a reason why it holds.
It may state two separate claims as one.
A result the paper reports from its own data — it cites no other source for it, so there is none to check. The quote shows it is in the paper.
In the paper
“we used hdWGCNA to project gene modules from two bulk RNA-seq studies of AD patients into an snRNA-seq dataset of the AD brain, showing that our approach allows for interrogation of gene modules and networks that have been previously identified.”
§ hdWGCNA identifies co-expression networks in high-dimensional transcriptomics data > Introduction
plaindirect- Asserted: passes — The authors put it forward as true.
- Checkable: passes — It can be checked against evidence.
- Load-bearing: passes — The paper’s conclusions depend on it.
- Based: passes — The paper gives a reason why it holds.
It may state two separate claims as one.
A result the paper reports from its own data — it cites no other source for it, so there is none to check. The quote shows it is in the paper.
In the paper
“we performed a similar iterative network analysis on a peripheral blood mononuclear cell (PBMC) scRNA-seq dataset of nearly 1M cells, highlighting the scalability of hdWGCNA in large datasets (Figure S5; Data S1).”
§ hdWGCNA identifies co-expression networks in high-dimensional transcriptomics data > Results > Constructing co-expression networks from high-dimensional transcriptomics data
plaincorrelational- Asserted: passes — The authors put it forward as true.
- Checkable: passes — It can be checked against evidence.
- Load-bearing: passes — The paper’s conclusions depend on it.
- Based: passes — The paper gives a reason why it holds.
It may state two separate claims as one.
The paper states this without a source or data behind it here, so there is nothing to check it against. The quote shows it is in the paper.
In the paper
“Further, the efficiency of this function varies with the number of co-expression modules detected and with the number of features in each modules.”
§ hdWGCNA identifies co-expression networks in high-dimensional transcriptomics data > Results > Runtime, memory usage, and evaluation of hdWGCNA
plaincorrelational- Asserted: passes — The authors put it forward as true.
- Checkable: passes — It can be checked against evidence.
- Load-bearing: fails — The paper’s conclusions may not depend on it.
- Based: passes — The paper gives a reason why it holds.
Probably not a substantial claim. The paper’s conclusions may not depend on it. It may state two separate claims as one.
A result the paper reports from its own data — it cites no other source for it, so there is none to check. The quote shows it is in the paper.
In the paper
“we performed a pairwise gene set overlap analysis of the 96 co-expression modules, and, while we did find that some modules had significant overlaps across the different cell types, the gene sets comprising these modules were overall quite distinct, with a maximum Jaccard index between two modules of 0.297 and a median of 0.005”
§ hdWGCNA identifies co-expression networks in high-dimensional transcriptomics data > Results > Constructing co-expression networks from high-dimensional transcriptomics data
plain- Asserted: passes — The authors put it forward as true.
- Checkable: passes — It can be checked against evidence.
- Load-bearing: unclear — It is unclear whether the paper’s conclusions depend on it.
- Based: passes — The paper gives a reason why it holds.
It may state two separate claims as one.
A result the paper reports from its own data — it cites no other source for it, so there is none to check. The quote shows it is in the paper.
In the paper
“Overall, we found that module hub gene expression was generally predictive of module member gene expression across all modules in the six cell-type co-expression networks, where the module with the best performance had an average test set RMSE of 0.0159 and the module with the worst performance had an average test set RMSE of 0.209 (Figure 2E).”
§ hdWGCNA identifies co-expression networks in high-dimensional transcriptomics data > Results > Runtime, memory usage, and evaluation of hdWGCNA
plaincorrelational- Asserted: passes — The authors put it forward as true.
- Checkable: passes — It can be checked against evidence.
- Load-bearing: passes — The paper’s conclusions depend on it.
- Based: passes — The paper gives a reason why it holds.
It may state two separate claims as one.
- The authors state this as an assumption: Genes within the same co-expression modules derived from specific cell types should be functionally related or co-regulated.
The paper states this without a source or data behind it here, so there is nothing to check it against. The quote shows it is in the paper.
In the paper
“hdWGCNA provides a rich suite of functions for data analysis and visualization, providing biological context for co-expression networks by leveraging a variety of biological knowledge databases.”
§ hdWGCNA identifies co-expression networks in high-dimensional transcriptomics data > Introduction
plaindirect- Asserted: passes — The authors put it forward as true.
- Checkable: passes — It can be checked against evidence.
- Load-bearing: fails — The paper’s conclusions may not depend on it.
- Based: passes — The paper gives a reason why it holds.
Probably not a substantial claim. The paper’s conclusions may not depend on it. It may state two separate claims as one.
The paper states this without a source or data behind it here, so there is nothing to check it against. The quote shows it is in the paper.
In the paper
“hdWGCNA is capable of processing any number of ST samples in the same co-expression network analysis by constructing metaspots separately for each sample.”
§ hdWGCNA identifies co-expression networks in high-dimensional transcriptomics data > Results > Spatial co-expression networks represent regional expression patterns in the mouse brain
plaindirect- Asserted: passes — The authors put it forward as true.
- Checkable: passes — It can be checked against evidence.
- Load-bearing: fails — The paper’s conclusions may not depend on it.
- Based: fails — The paper may give no reason why it holds.
Probably not a substantial claim. The paper’s conclusions may not depend on it. The paper may give no reason why it holds.
A result the paper reports from its own data — it cites no other source for it, so there is none to check. The quote shows it is in the paper.
In the paper
“Further, the hub genes of SM4 include hemoglobin subunits (Hba-a1, Hba-a2, Hbb-bt), and we show that SM4 was enriched for biological processes associated with brain vasculature (Figures 3B and S7C).”
§ hdWGCNA identifies co-expression networks in high-dimensional transcriptomics data > Results > Spatial co-expression networks represent regional expression patterns in the mouse brain
plaincorrelational- Asserted: passes — The authors put it forward as true.
- Checkable: passes — It can be checked against evidence.
- Load-bearing: unclear — It is unclear whether the paper’s conclusions depend on it.
- Based: passes — The paper gives a reason why it holds.
It may state two separate claims as one.
A result the paper reports from its own data — it cites no other source for it, so there is none to check. The quote shows it is in the paper.
In the paper
“Different isoforms of the histone H3.3 subunit gene H3f3b were hubs for modules RGL-M1 and RGL-M11, which were associated with ependymal and neuronal cell fates respectively, suggesting that alternative TES usage in H3f3b plays a role in regulating epigenetic factors in murine hippocampal development (Figure 4F).”
§ hdWGCNA identifies co-expression networks in high-dimensional transcriptomics data > Results > Isoform-level co-expression networks reveal cell fate decisions in the radial glia developmental lineage
plaincorrelational- Asserted: passes — The authors put it forward as true.
- Checkable: passes — It can be checked against evidence.
- Load-bearing: passes — The paper’s conclusions depend on it.
- Based: passes — The paper gives a reason why it holds.
It may state two separate claims as one.
The paper states this without a source or data behind it here, so there is nothing to check it against. The quote shows it is in the paper.
In the paper
“the module eigengene algorithm in hdWGCNA (Algorithm 2) accounts for batch effects and additional covariates in the input dataset”
§ hdWGCNA identifies co-expression networks in high-dimensional transcriptomics data > STAR★Methods > Method details
plaindirect- Asserted: passes — The authors put it forward as true.
- Checkable: passes — It can be checked against evidence.
- Load-bearing: fails — The paper’s conclusions may not depend on it.
- Based: passes — The paper gives a reason why it holds.
Probably not a substantial claim. The paper’s conclusions may not depend on it.
A result the paper reports from its own data — it cites no other source for it, so there is none to check. The quote shows it is in the paper.
In the paper
“We show that expression of these modules was significantly correlated with AD genetic risk (Pearson correlation p <0.05), with the strongest correlation in alternative activation module MG-M4 (Figure 6I).”
§ hdWGCNA identifies co-expression networks in high-dimensional transcriptomics data > Results > Consensus network analysis of microglia in AD
plaincorrelational- Asserted: passes — The authors put it forward as true.
- Checkable: passes — It can be checked against evidence.
- Load-bearing: passes — The paper’s conclusions depend on it.
- Based: passes — The paper gives a reason why it holds.
It may state two separate claims as one.
The paper states this without a source or data behind it here, so there is nothing to check it against. The quote shows it is in the paper.
In the paper
“hdWGNCA is completely technology agnostic, and can be adapted to handle high dimensional counts matrices from any single-cell or spatial transcriptomics platform.”
§ hdWGCNA identifies co-expression networks in high-dimensional transcriptomics data > STAR★Methods > Method details
plain- Asserted: passes — The authors put it forward as true.
- Checkable: passes — It can be checked against evidence.
- Load-bearing: fails — The paper’s conclusions may not depend on it.
- Based: fails — The paper may give no reason why it holds.
Probably not a substantial claim. The paper’s conclusions may not depend on it. The paper may give no reason why it holds. It may state two separate claims as one.
The paper states this without a source or data behind it here, so there is nothing to check it against. The quote shows it is in the paper.
In the paper
“and hdWGCNA contains functions to handle spatial transcriptomics datasets.”
§ hdWGCNA identifies co-expression networks in high-dimensional transcriptomics data > STAR★Methods > Method details
plain- Asserted: passes — The authors put it forward as true.
- Checkable: passes — It can be checked against evidence.
- Load-bearing: fails — The paper’s conclusions may not depend on it.
- Based: passes — The paper gives a reason why it holds.
Probably not a substantial claim. The paper’s conclusions may not depend on it.
The paper states this without a source or data behind it here, so there is nothing to check it against. The quote shows it is in the paper.
In the paper
“In this study, we demonstrated that hdWGCNA is compatible with single-cell and ST datasets and can be easily adapted for novel transcriptomics approaches such as ScISOrSeq.”
§ hdWGCNA identifies co-expression networks in high-dimensional transcriptomics data > Discussion
boostedcorrelational- Asserted: passes — The authors put it forward as true.
- Checkable: passes — It can be checked against evidence.
- Load-bearing: unclear — It is unclear whether the paper’s conclusions depend on it.
- Based: passes — The paper gives a reason why it holds.
It may state two separate claims as one.
The paper states this without a source or data behind it here, so there is nothing to check it against. The quote shows it is in the paper.
In the paper
“Unlike scWGCNA, the metacell construction algorithm (Algorithm 1) in hdWGCNA includes new parameters to avoid redundant metacells”
§ hdWGCNA identifies co-expression networks in high-dimensional transcriptomics data > STAR★Methods > Method details
plaindirect- Asserted: passes — The authors put it forward as true.
- Checkable: passes — It can be checked against evidence.
- Load-bearing: fails — The paper’s conclusions may not depend on it.
- Based: passes — The paper gives a reason why it holds.
Probably not a substantial claim. The paper’s conclusions may not depend on it.
The paper states this without a source or data behind it here, so there is nothing to check it against. The quote shows it is in the paper.
In the paper
“The individually processed datasets were merged into a single Seurat object comprising 189,127 nuclei”
§ hdWGCNA identifies co-expression networks in high-dimensional transcriptomics data > STAR★Methods > Quantification and statistical analysis
plain- Asserted: passes — The authors put it forward as true.
- Checkable: passes — It can be checked against evidence.
- Load-bearing: passes — The paper’s conclusions depend on it.
- Based: passes — The paper gives a reason why it holds.
Probably not a substantial claim.
A result the paper reports from its own data — it cites no other source for it, so there is none to check. The quote shows it is in the paper.
In the paper
“The major cell compartments recovered in this analysis were similar to those reported by Parse Biosciences in their analysis, including as T-cells, B-cells, monocytes, dendritic cells, basophils, and plasmablasts.”
§ hdWGCNA identifies co-expression networks in high-dimensional transcriptomics data > STAR★Methods > Quantification and statistical analysis
plainn = 12- Asserted: passes — The authors put it forward as true.
- Checkable: passes — It can be checked against evidence.
- Load-bearing: fails — The paper’s conclusions may not depend on it.
- Based: passes — The paper gives a reason why it holds.
Probably not a substantial claim. The paper’s conclusions may not depend on it.
The paper states this without a source or data behind it here, so there is nothing to check it against. The quote shows it is in the paper.
In the paper
“genes expressed in at least 5% of microglia from any of the three studies were retained (7,900 genes).”
§ hdWGCNA identifies co-expression networks in high-dimensional transcriptomics data > STAR★Methods > Quantification and statistical analysis
plain- Asserted: passes — The authors put it forward as true.
- Checkable: passes — It can be checked against evidence.
- Load-bearing: passes — The paper’s conclusions depend on it.
- Based: passes — The paper gives a reason why it holds.
Probably not a substantial claim.
A result the paper reports from its own data — it cites no other source for it, so there is none to check. The quote shows it is in the paper.
In the paper
“The metacell aggregation step had a runtime of 85 min and 59 s.”
§ hdWGCNA identifies co-expression networks in high-dimensional transcriptomics data > STAR★Methods > Quantification and statistical analysis
plain- Asserted: passes — The authors put it forward as true.
- Checkable: passes — It can be checked against evidence.
- Load-bearing: fails — The paper’s conclusions may not depend on it.
- Based: passes — The paper gives a reason why it holds.
Probably not a substantial claim. The paper’s conclusions may not depend on it.
A result the paper reports from its own data — it cites no other source for it, so there is none to check. The quote shows it is in the paper.
In the paper
“We retained all nuclei labeled microglia for network analysis based on expression of canonical marker genes such as CSF1R (9,904 nuclei)”
§ hdWGCNA identifies co-expression networks in high-dimensional transcriptomics data > STAR★Methods > Quantification and statistical analysis
plain- Asserted: passes — The authors put it forward as true.
- Checkable: passes — It can be checked against evidence.
- Load-bearing: passes — The paper’s conclusions depend on it.
- Based: passes — The paper gives a reason why it holds.
Probably not a substantial claim.
The paper states this without a source or data behind it here, so there is nothing to check it against. The quote shows it is in the paper.
In the paper
“As shown throughout this manuscript, hdWGCNA includes functions for projecting co-expression networks into a variety of external datasets.”
§ hdWGCNA identifies co-expression networks in high-dimensional transcriptomics data > STAR★Methods > Method details
plain- Asserted: passes — The authors put it forward as true.
- Checkable: passes — It can be checked against evidence.
- Load-bearing: fails — The paper’s conclusions may not depend on it.
- Based: passes — The paper gives a reason why it holds.
Probably not a substantial claim. The paper’s conclusions may not depend on it.
The paper states this without a source or data behind it here, so there is nothing to check it against. The quote shows it is in the paper.
In the paper
“While ST spots were clustered based on transcriptomic information alone, we were able to annotate them based on anatomical features.”
§ hdWGCNA identifies co-expression networks in high-dimensional transcriptomics data > STAR★Methods > Quantification and statistical analysis
plain- Asserted: passes — The authors put it forward as true.
- Checkable: passes — It can be checked against evidence.
- Load-bearing: fails — The paper’s conclusions may not depend on it.
- Based: passes — The paper gives a reason why it holds.
Probably not a substantial claim. The paper’s conclusions may not depend on it. It may state two separate claims as one.
A result the paper reports from its own data — it cites no other source for it, so there is none to check. The quote shows it is in the paper.
In the paper
“We note that for the largest cell population (T-cells, 555,417 cells), the runtime for the network construction step was 186 s.”
§ hdWGCNA identifies co-expression networks in high-dimensional transcriptomics data > STAR★Methods > Quantification and statistical analysis
plainSingle case- Asserted: passes — The authors put it forward as true.
- Checkable: passes — It can be checked against evidence.
- Load-bearing: fails — The paper’s conclusions may not depend on it.
- Based: passes — The paper gives a reason why it holds.
Probably not a substantial claim. The paper’s conclusions may not depend on it.
The paper states this without a source or data behind it here, so there is nothing to check it against. The quote shows it is in the paper.
In the paper
“Importantly, the number of input genes and other network analysis parameters also have an effect on runtime and memory usage.”
§ hdWGCNA identifies co-expression networks in high-dimensional transcriptomics data > STAR★Methods > Quantification and statistical analysis
plaincorrelational- Asserted: passes — The authors put it forward as true.
- Checkable: passes — It can be checked against evidence.
- Load-bearing: fails — The paper’s conclusions may not depend on it.
- Based: fails — The paper may give no reason why it holds.
Probably not a substantial claim. The paper’s conclusions may not depend on it. The paper may give no reason why it holds.
A conclusion the paper draws from its own results — it cites no other source for it, so there is none to check. The quote shows it is in the paper.
In the paper
“This function attempts to construct a target number of metacells within each biological replicate and each cell population, and the algorithm terminates early if this target is reached, thus explaining the plateau in the memory usage graph.”
§ hdWGCNA identifies co-expression networks in high-dimensional transcriptomics data > Results > Runtime, memory usage, and evaluation of hdWGCNA
plaindirect- Asserted: passes — The authors put it forward as true.
- Checkable: passes — It can be checked against evidence.
- Load-bearing: unclear — It is unclear whether the paper’s conclusions depend on it.
- Based: passes — The paper gives a reason why it holds.
It may state two separate claims as one.
A conclusion the paper draws from its own results — it cites no other source for it, so there is none to check. The quote shows it is in the paper.
In the paper
“Here we describe hdWGCNA, a comprehensive framework for constructing and analyzing co-expression networks in high-dimensional transcriptomic data (Figure 1A).”
§ hdWGCNA identifies co-expression networks in high-dimensional transcriptomics data > Results > Constructing co-expression networks from high-dimensional transcriptomics data
plain- Asserted: passes — The authors put it forward as true.
- Checkable: passes — It can be checked against evidence.
- Load-bearing: passes — The paper’s conclusions depend on it.
- Based: passes — The paper gives a reason why it holds.
Probably not a substantial claim.
What the paper did — it cites no source for this, so there is none to check. The quote shows it is in the paper.
In the paper
“A typical hdWGCNA workflow in scRNA-seq data accounts for these considerations by collapsing highly similar cells into “metacells” to reduce sparsity while retaining cellular heterogeneity and by allowing for a modular design to perform separate network analyses in specified cell populations.”
§ hdWGCNA identifies co-expression networks in high-dimensional transcriptomics data > Results > Constructing co-expression networks from high-dimensional transcriptomics data
plaindirect- Asserted: passes — The authors put it forward as true.
- Checkable: passes — It can be checked against evidence.
- Load-bearing: passes — The paper’s conclusions depend on it.
- Based: passes — The paper gives a reason why it holds.
Probably not a substantial claim. It may state two separate claims as one.
- Rests on an assumption: Sparsity and noise inherent in single-cell data can lead to spurious gene-gene correlations, thereby complicating co-expression network analysis.
- Rests on an assumption: The correlation structure of single-cell or spatial transcriptomic data varies greatly for different subsets (cell types, cell states, anatomical regions).
What the paper did — it cites no source for this, so there is none to check. The quote shows it is in the paper.
In the paper
“For example, the hdWGCNA metacell algorithm requires a dimensional reduction of the input expression matrix, but these reductions often contain technical artifacts. The choice of dimensionality reduction method and handling of technical artifacts would then influence the effectiveness of metacell construction.”
§ hdWGCNA identifies co-expression networks in high-dimensional transcriptomics data > Results > Constructing co-expression networks from high-dimensional transcriptomics data
hedgedconditional- Asserted: passes — The authors put it forward as true.
- Checkable: passes — It can be checked against evidence.
- Load-bearing: fails — The paper’s conclusions may not depend on it.
- Based: passes — The paper gives a reason why it holds.
Probably not a substantial claim. The paper’s conclusions may not depend on it. It may state two separate claims as one.
In the paper
“Gfap encodes a key intermediate filament protein in astrocytes that is involved in astrocytic reactivity during central nervous system (CNS) injuries or neurodegeneration,39”
§ hdWGCNA identifies co-expression networks in high-dimensional transcriptomics data > Results > Isoform-level co-expression networks reveal cell fate decisions in the radial glia developmental lineage
What the sources say
- Not checked — no full text of the sourcecites [39] Hol E.M. Pekny M. Glial fibrillary acidic protein (GFAP) and the astrocyte intermediate filament system in diseases of the central nervous system Curr. Opin. Cell Biol. 32 2015 121 130 10.1016/j.ceb.2015.02.004 25726916 source
plaincorrelational- Asserted: passes — The authors put it forward as true.
- Checkable: passes — It can be checked against evidence.
- Load-bearing: fails — The paper’s conclusions may not depend on it.
- Based: passes — The paper gives a reason why it holds.
Probably not a substantial claim. The paper’s conclusions may not depend on it. It may state two separate claims as one.
A conclusion the paper draws from its own results — it cites no other source for it, so there is none to check. The quote shows it is in the paper.
In the paper
“Further, the optimal number of cells to merge together to form a single metacell may differ across cell types and tissues, attempting to balance between increasing information content of the aggregated group while avoiding merging of dissimilar cells.”
§ hdWGCNA identifies co-expression networks in high-dimensional transcriptomics data > Results > Constructing co-expression networks from high-dimensional transcriptomics data
hedgedconditional- Asserted: passes — The authors put it forward as true.
- Checkable: passes — It can be checked against evidence.
- Load-bearing: fails — The paper’s conclusions may not depend on it.
- Based: passes — The paper gives a reason why it holds.
Probably not a substantial claim. The paper’s conclusions may not depend on it.
A conclusion the paper draws from its own results — it cites no other source for it, so there is none to check. The quote shows it is in the paper.
In the paper
“We also find enrichment of several ASD-associated genes such as TSC1 (INH-M8), SMARCA4 (INH-M8), SHANK2 (INH-M4), and CPEB4 (INH-M1), highlighting that these modules are functional and provide new insights into the role of inhibitory neurons in ASD.”
§ hdWGCNA identifies co-expression networks in high-dimensional transcriptomics data > Results > Co-expression network analysis of inhibitory neurons in ASD
plaincorrelational- Asserted: passes — The authors put it forward as true.
- Checkable: passes — It can be checked against evidence.
- Load-bearing: passes — The paper’s conclusions depend on it.
- Based: passes — The paper gives a reason why it holds.
It may state two separate claims as one.
A conclusion the paper draws from its own results — it cites no other source for it, so there is none to check. The quote shows it is in the paper.
In the paper
“The hdWGCNA R package directly extends the familiar Seurat pipeline and the SeuratObject data structure, enabling researchers to rapidly incorporate network analysis into their own workflows, going beyond cell clustering and differential gene expression analysis toward systems-level insights.”
§ hdWGCNA identifies co-expression networks in high-dimensional transcriptomics data > Discussion
plaindirect- Asserted: passes — The authors put it forward as true.
- Checkable: passes — It can be checked against evidence.
- Load-bearing: passes — The paper’s conclusions depend on it.
- Based: passes — The paper gives a reason why it holds.
Probably not a substantial claim.
A conclusion the paper draws from its own results — it cites no other source for it, so there is none to check. The quote shows it is in the paper.
In the paper
“This metacell bagging algorithm is implemented as part of the hdWGCNA R package in the ConstructMetacells function, and the pseudocode for this algorithm is defined in Algorithm 1.”
§ hdWGCNA identifies co-expression networks in high-dimensional transcriptomics data > STAR★Methods > Method details
plain- Asserted: passes — The authors put it forward as true.
- Checkable: passes — It can be checked against evidence.
- Load-bearing: fails — The paper’s conclusions may not depend on it.
- Based: passes — The paper gives a reason why it holds.
Probably not a substantial claim. The paper’s conclusions may not depend on it.
A conclusion the paper draws from its own results — it cites no other source for it, so there is none to check. The quote shows it is in the paper.
In the paper
“We designed hdWGCNA to be highly modular, allowing for multi-scale analyses of different cellular or spatial hierarchies in a technology-agnostic manner.”
§ hdWGCNA identifies co-expression networks in high-dimensional transcriptomics data > Discussion
plaindirect- Asserted: passes — The authors put it forward as true.
- Checkable: passes — It can be checked against evidence.
- Load-bearing: passes — The paper’s conclusions depend on it.
- Based: fails — The paper may give no reason why it holds.
Probably not a substantial claim. The paper may give no reason why it holds. It may state two separate claims as one.
The paper states this without a source or data behind it here, so there is nothing to check it against. The quote shows it is in the paper.
In the paper
“Contrasting the hdWGCNA package, the implementation of scWGCNA was an R package containing a single function for metacell construction, and a single tutorial to cover the basics of network analysis using the WGCNA package1 with the metacell matrix.”
§ hdWGCNA identifies co-expression networks in high-dimensional transcriptomics data > STAR★Methods > Method details
plain- Asserted: passes — The authors put it forward as true.
- Checkable: passes — It can be checked against evidence.
- Load-bearing: fails — The paper’s conclusions may not depend on it.
- Based: passes — The paper gives a reason why it holds.
Probably not a substantial claim. The paper’s conclusions may not depend on it.
A conclusion the paper draws from its own results — it cites no other source for it, so there is none to check. The quote shows it is in the paper.
In the paper
“In the signed TOM, negative correlations serve to negatively reinforce the network connection, which is not the case in the unsigned TOM.”
§ hdWGCNA identifies co-expression networks in high-dimensional transcriptomics data > STAR★Methods > Method details
plaindirect- Asserted: passes — The authors put it forward as true.
- Checkable: passes — It can be checked against evidence.
- Load-bearing: fails — The paper’s conclusions may not depend on it.
- Based: passes — The paper gives a reason why it holds.
Probably not a substantial claim. The paper’s conclusions may not depend on it.
A conclusion the paper draws from its own results — it cites no other source for it, so there is none to check. The quote shows it is in the paper.
In the paper
“The hdWGCNA R package directly extends the familiar Seurat pipeline and the SeuratObject data structure, enabling researchers to rapidly incorporate network analysis into their own workflows, going beyond cell clustering and differential gene expression analysis toward systems-level insights.”
§ hdWGCNA identifies co-expression networks in high-dimensional transcriptomics data > Discussion
plaindirect- Asserted: passes — The authors put it forward as true.
- Checkable: passes — It can be checked against evidence.
- Load-bearing: fails — The paper’s conclusions may not depend on it.
- Based: fails — The paper may give no reason why it holds.
Probably not a substantial claim. The paper’s conclusions may not depend on it. The paper may give no reason why it holds.
A conclusion the paper draws from its own results — it cites no other source for it, so there is none to check. The quote shows it is in the paper.
In the paper
“By projecting co-expression modules derived from bulk RNA-seq patient cohorts into single-cell datasets, we can layer disease-related information onto the single-cell dataset and attribute cell-state-specific expression patterns to the bulk RNA-seq data.”
§ hdWGCNA identifies co-expression networks in high-dimensional transcriptomics data > Results > Projecting network modules from bulk RNA-seq cohorts into relevant single-cell datasets
plaindirectn = 11- Asserted: passes — The authors put it forward as true.
- Checkable: passes — It can be checked against evidence.
- Load-bearing: passes — The paper’s conclusions depend on it.
- Based: passes — The paper gives a reason why it holds.
It may state two separate claims as one.
- Rests on an assumption: It remains cost-prohibitive for most researchers to perform high-dimensional -omics studies of large patient cohorts.
A conclusion the paper draws from its own results — it cites no other source for it, so there is none to check. The quote shows it is in the paper.
In the paper
“We developed hdWGCNA to provide a succinct methodology for investigating systems-level changes in the transcriptome in single-cell or ST datasets.”
§ hdWGCNA identifies co-expression networks in high-dimensional transcriptomics data > Discussion
plain- Asserted: passes — The authors put it forward as true.
- Checkable: passes — It can be checked against evidence.
- Load-bearing: passes — The paper’s conclusions depend on it.
- Based: passes — The paper gives a reason why it holds.
Probably not a substantial claim.
A conclusion the paper draws from its own results — it cites no other source for it, so there is none to check. The quote shows it is in the paper.
In the paper
“hdWGCNA includes built-in functions to leverage external biological knowledge sources to provide insight for co-expression networks, for example by comparing gene modules with functional gene sets such as disease-associated genes from GWAS expression quantitative trait loci (eQTLs), or transcription factor target genes.”
§ hdWGCNA identifies co-expression networks in high-dimensional transcriptomics data > Discussion
plain- Asserted: passes — The authors put it forward as true.
- Checkable: passes — It can be checked against evidence.
- Load-bearing: fails — The paper’s conclusions may not depend on it.
- Based: passes — The paper gives a reason why it holds.
Probably not a substantial claim. The paper’s conclusions may not depend on it.
A conclusion the paper draws from its own results — it cites no other source for it, so there is none to check. The quote shows it is in the paper.
In the paper
“The co-expression information computed by hdWGCNA can be easily retrieved from the Seurat object to facilitate custom downstream analyses beyond the hdWGCNA package.”
§ hdWGCNA identifies co-expression networks in high-dimensional transcriptomics data > Discussion
plain- Asserted: passes — The authors put it forward as true.
- Checkable: passes — It can be checked against evidence.
- Load-bearing: fails — The paper’s conclusions may not depend on it.
- Based: fails — The paper may give no reason why it holds.
Probably not a substantial claim. The paper’s conclusions may not depend on it. The paper may give no reason why it holds.
What the paper did — it cites no source for this, so there is none to check. The quote shows it is in the paper.
In the paper
“we applied Harmony22 to correct MEs based on the dataset of origin.”
§ hdWGCNA identifies co-expression networks in high-dimensional transcriptomics data > STAR★Methods > Quantification and statistical analysis
plaindirect- Asserted: passes — The authors put it forward as true.
- Checkable: passes — It can be checked against evidence.
- Load-bearing: passes — The paper’s conclusions depend on it.
- Based: passes — The paper gives a reason why it holds.
Probably not a substantial claim.
What the paper did — it cites no source for this, so there is none to check. The quote shows it is in the paper.
In the paper
“Module eigengenes were computed for each of these bulk RNA-seq modules in the snRNA-seq dataset using the hdWGCNA function ProjectModules, using Harmony to correct MEs based on sequencing batch.”
§ hdWGCNA identifies co-expression networks in high-dimensional transcriptomics data > STAR★Methods > Quantification and statistical analysis
plaindirect- Asserted: passes — The authors put it forward as true.
- Checkable: passes — It can be checked against evidence.
- Load-bearing: passes — The paper’s conclusions depend on it.
- Based: passes — The paper gives a reason why it holds.
Probably not a substantial claim. It may state two separate claims as one.
In the paper
“the set of modules from Morabito et al. 202056 was based on a consensus network analysis across six brain regions”
§ hdWGCNA identifies co-expression networks in high-dimensional transcriptomics data > STAR★Methods > Quantification and statistical analysis
What the sources say
- Not matchedcites Morabito et al. 202056
Couldn’t be matched to a paper in Crossref, so it can’t be checked.
plainn = 6- Asserted: passes — The authors put it forward as true.
- Checkable: passes — It can be checked against evidence.
- Load-bearing: fails — The paper’s conclusions may not depend on it.
- Based: passes — The paper gives a reason why it holds.
Probably not a substantial claim. The paper’s conclusions may not depend on it.
- Not matched
What the paper did — it cites no source for this, so there is none to check. The quote shows it is in the paper.
In the paper
“We performed a separate parameter sweep for the three expression matrices using the hdWGCNA function TestSoftPowerConsensus, ensuring that we used an appropriate β value for each dataset (Mathys et al.: β=6, Zhou et al.: β=8, Morabito & Miyoshi et al.: β=6).”
§ hdWGCNA identifies co-expression networks in high-dimensional transcriptomics data > STAR★Methods > Quantification and statistical analysis
plain- Asserted: passes — The authors put it forward as true.
- Checkable: passes — It can be checked against evidence.
- Load-bearing: passes — The paper’s conclusions depend on it.
- Based: passes — The paper gives a reason why it holds.
Probably not a substantial claim.
What the paper did — it cites no source for this, so there is none to check. The quote shows it is in the paper.
In the paper
“the datasets were integrated into a common dimensionally-reduced space using PCA and Harmony.”
§ hdWGCNA identifies co-expression networks in high-dimensional transcriptomics data > STAR★Methods > Quantification and statistical analysis
plaindirect- Asserted: passes — The authors put it forward as true.
- Checkable: passes — It can be checked against evidence.
- Load-bearing: passes — The paper’s conclusions depend on it.
- Based: passes — The paper gives a reason why it holds.
Probably not a substantial claim.
What the paper did — it cites no source for this, so there is none to check. The quote shows it is in the paper.
In the paper
“we applied Harmony22 to correct MEs based on sequencing batch.”
§ hdWGCNA identifies co-expression networks in high-dimensional transcriptomics data > STAR★Methods > Quantification and statistical analysis
plaindirect- Asserted: passes — The authors put it forward as true.
- Checkable: passes — It can be checked against evidence.
- Load-bearing: passes — The paper’s conclusions depend on it.
- Based: passes — The paper gives a reason why it holds.
Probably not a substantial claim.
In the paper
“the other set of modules from the AMP-AD study63 were constructed separately for seven different brain regions.”
§ hdWGCNA identifies co-expression networks in high-dimensional transcriptomics data > STAR★Methods > Quantification and statistical analysis
What the sources say
- Not matchedcites AMP-AD study63
Couldn’t be matched to a paper in Crossref, so it can’t be checked.
plain- Asserted: passes — The authors put it forward as true.
- Checkable: passes — It can be checked against evidence.
- Load-bearing: fails — The paper’s conclusions may not depend on it.
- Based: passes — The paper gives a reason why it holds.
Probably not a substantial claim. The paper’s conclusions may not depend on it.
- Not matched
What the paper did — it cites no source for this, so there is none to check. The quote shows it is in the paper.
In the paper
“We selected a soft-power threshold β=9 based on the parameter sweep performed with the TestSoftPowers function.”
§ hdWGCNA identifies co-expression networks in high-dimensional transcriptomics data > STAR★Methods > Quantification and statistical analysis
plain- Asserted: passes — The authors put it forward as true.
- Checkable: passes — It can be checked against evidence.
- Load-bearing: fails — The paper’s conclusions may not depend on it.
- Based: passes — The paper gives a reason why it holds.
Probably not a substantial claim. The paper’s conclusions may not depend on it.
What the paper did — it cites no source for this, so there is none to check. The quote shows it is in the paper.
In the paper
“We oriented the start of pseudotime based on the expression of homeostatic microglia marker genes, such as P2RY12, CX3CR1, and CSF1R.”
§ hdWGCNA identifies co-expression networks in high-dimensional transcriptomics data > STAR★Methods > Quantification and statistical analysis
plaindirect- Asserted: passes — The authors put it forward as true.
- Checkable: passes — It can be checked against evidence.
- Load-bearing: passes — The paper’s conclusions depend on it.
- Based: passes — The paper gives a reason why it holds.
Probably not a substantial claim.
What the paper did — it cites no source for this, so there is none to check. The quote shows it is in the paper.
In the paper
“Individual TOMs were computed for each dataset, and they were scaled based on the 80th percentile in order to alleviate different statistical properties specific to each dataset rather than the underlying biology.”
§ hdWGCNA identifies co-expression networks in high-dimensional transcriptomics data > STAR★Methods > Quantification and statistical analysis
plaindirect- Asserted: passes — The authors put it forward as true.
- Checkable: passes — It can be checked against evidence.
- Load-bearing: passes — The paper’s conclusions depend on it.
- Based: passes — The paper gives a reason why it holds.
Probably not a substantial claim.
The paper relies on this without support.
Popular bioinformatic tools do not support systems-level analysis.
“While experimental methods enable transcriptome-wide measurements across millions of cells, popular bioinformatic tools do not support systems-level analysis.”
The paper relies on this without support.
Sparsity and noise inherent in single-cell data can lead to spurious gene-gene correlations, thereby complicating co-expression network analysis.
“The sparsity and noise inherent in single-cell data can lead to spurious gene-gene correlations, thereby complicating co-expression network analysis.”
The paper relies on this without support.
The correlation structure of single-cell or spatial transcriptomic data varies greatly for different subsets (cell types, cell states, anatomical regions).
“Additionally, the correlation structure of single-cell or spatial transcriptomic data varies greatly for different subsets (cell types, cell states, anatomical regions).”
The paper relies on this without support.
Data sparsity is inherent to the current generation of sequencing-based spatial transcriptomics technologies.
“Data sparsity is also inherent to the current generation of these technologies, therefore we propose a metaspot aggregation approach prior to network analysis (Figure S6).”
The authors state this as an assumption.
Co-expressed genes are involved in similar biological processes, so co-expression network structures should be predictive of biological pathway membership.
“In principle, we expect that co-expressed genes are involved in similar biological processes, and therefore co-expression network structures should be predictive of biological pathway membership.”
The authors state this as an assumption.
Genes within the same co-expression modules derived from specific cell types should be functionally related or co-regulated.
“In principle, genes within the same co-expression modules derived from specific cell types should be functionally related or co-regulated.”
The paper relies on this without support.
Co-expression networks behave as functional biological units.
“Co-expression networks behave as functional biological units; therefore, we reason that the hub genes and other members of MG-M1 represent candidates for an expanded set of human DAM genes including ACTB, TPT1, and EEF1A1.”
The paper relies on this without support.
It remains cost-prohibitive for most researchers to perform high-dimensional -omics studies of large patient cohorts.
“To date, it remains cost-prohibitive for most researchers to perform high-dimensional -omics studies of large patient cohorts, but there are numerous large-scale disease-relevant bulk RNA-seq datasets containing thousands of samples from consortia such as the Encyclopedia of DNA Elements (ENCODE),60 the Genotype-Tissue Expression (GTEx) project,61 and The Cancer Genome Atlas (TCGA).62”
The paper relies on this without support.
Classical bioinformatic approaches such as differential gene expression do not provide information about the broader context of genes in specific pathways or regulatory regimes.
“Classical bioinformatic approaches for transcriptomics analysis such as differential gene expression are useful for finding individual genes that are altered in a particular disease or condition of interest, but they do not provide information about the broader context of these genes in specific pathways or regulatory regimes.”
The paper relies on this without support.
Biological processes such as development or regeneration require coordination of distinct sets of genes in certain cell types with spatial specificity.
“For example, biological processes such as development or regeneration require coordination of distinct sets of genes in certain cell types with spatial specificity.”
The paper relies on this without support.
Single-cell gene expression datasets typically contain many more zero-valued entries than non-zero-valued entries, meaning that these datasets are sparse.
“Single-cell gene expression datasets typically contain many more zero valued entries than non-zero valued entries, meaning that these datasets are sparse.”
The paper relies on this without support.
Conventional single-cell gene expression assays yield sparse gene expression matrices.
“Conventional single-cell gene expression assays yield sparse gene expression matrices.”
The paper relies on this without support.
Correlations of sparse vectors may lead to downstream conclusions that are not robust or reproducible.
“In general, correlations of sparse vectors may lead to downstream conclusions that are not robust or reproducible.”
The paper relies on this without support.
Transcriptomic measurements of single cells are generally noisy, imposing challenges and limitations in the analysis of these datasets.
“Transcriptomic measurements of single cells are generally noisy, imposing challenges and limitations in the analysis of these datasets.”
The paper relies on this without support.
Technical noise may arise from dropout events or from various steps in the experimental protocols, potentially making downstream data analysis and interpretation more difficult.
“Technical noise may arise from dropout events or from various steps in the experimental protocols, potentially making downstream data analysis and interpretation more difficult.”
The paper relies on this without support.
Sequencing-based spatial transcriptomics approaches such as 10x Genomics Visium yield sparse transcriptomic profiles, introducing the same potential pitfalls as single-cell data for co-expression network analysis.
“Sequencing-based ST approaches such as the 10× Genomics Visium platform also yield sparse transcriptomic profiles, thus introducing the same potential pitfalls as single-cell data for co-expression network analysis.”
The paper relies on this without support.
The widespread adoption of single-cell genomics has led to many biologists running their own computational analysis.
“The widespread adoption of single-cell genomics has led to many biologists running their own computational analysis, and we designed the hdWGCNA R package with these individuals in mind through our various step-by-step tutorials and detailed documentation.”
Claims other papers make about this one
Each is checked against this paper’s own text: does it say what the citing paper says it does?
The cited source says what the claim attributes to it.
In the citing paper
“Using high‐dimensional weighted gene co‐expression network analysis (hdWGCNA), 23 we identified synaptic, immune, and lipid‐metabolism modules that demonstrated the most pronounced alterations in the combined 5XFAD;PS19 model.”
From Unique transcriptomic alterations in 5XFAD;PS19 mouse model identify glial lipid dysregulation and coordinated microglial–oligodendrocyte responses (2026) · cites this paper as [23]
The check wasn’t confident either way, so it gives no verdict — never disputed.
In the citing paper
“For cells collected at 6 hrs and longer after replacing the medium, their transcriptional states are distinct from control cells: the affected genes are enriched in hippo signaling and cAMP-related pathways46 (Fig. 1d, and Extended Data Fig. 2d–f).”
From Single-cell parallel analysis of DNA damage and transcriptome reveals selective genome vulnerability (2025) · cites this paper as [46]
Experimental — accuracy not yet measured
Self-check
Percentages, sums and reported differences re-computed from the paper’s own numbers.
Each contradiction between two passages listed here was confirmed by an independent check.
Rated minor: it would not touch a result — a value no result rests on, a p-value that stays on the same side of the significance level, or a conflict that is clerical, resolved elsewhere in the paper, or outside its own findings.
In the paper
§ hdWGCNA identifies co-expression networks in high-dimensional transcriptomics data > Results > Co-expression network analysis of inhibitory neurons in ASD
“Furthermore, DME analysis revealed significant differences between MEs in ASD and control samples for all modules except INH-M4 in at least one INH subpopulation (Figure 5D; Data S3; Wilcoxon rank-sum test Bonferroni-adjusted p <0.05).”
§ hdWGCNA identifies co-expression networks in high-dimensional transcriptomics data > Results > Co-expression network analysis of inhibitory neurons in ASD
“(D) snRNA-seq UMAP plots as in (A) colored by MEs for INH co-expression modules. (E) Violin plots showing MEs in each INH cluster. Two-sided Wilcoxon test was used to compare ASD versus control samples.”
Rated minor: it would not touch a result — a value no result rests on, a p-value that stays on the same side of the significance level, or a conflict that is clerical, resolved elsewhere in the paper, or outside its own findings.
In the paper
§ hdWGCNA identifies co-expression networks in high-dimensional transcriptomics data > Results > Consensus network analysis of microglia in AD
“Additionally, we projected these modules into an snATAC-seq dataset of the PFC in human AD,12 using gene activity59 as a proxy for gene expression from chromatin accessibility data.”
§ hdWGCNA identifies co-expression networks in high-dimensional transcriptomics data > Results > Consensus network analysis of microglia in AD
“(H) Top: microglia UMAP colored by AD single-cell disease relevance score (scDRS)52Z score. Bottom: scDRS Z score as a function of pseudotime, points are averaged scDRS Z scores in 50 pseudotime bins of equal size.”
Rated minor: it would not touch a result — a value no result rests on, a p-value that stays on the same side of the significance level, or a conflict that is clerical, resolved elsewhere in the paper, or outside its own findings.
In the paper
§ hdWGCNA identifies co-expression networks in high-dimensional transcriptomics data > Results > Co-expression network analysis of inhibitory neurons in ASD
“Furthermore, three co-expression modules (INH-M11, INH-M13, and INH-M3) were significantly enriched in ASD-associated genes from the SFARI database and the latest genome-wide association study (GWAS) of ASD41 (Figure 5E)”
§ hdWGCNA identifies co-expression networks in high-dimensional transcriptomics data > Results > Co-expression network analysis of inhibitory neurons in ASD
“(E) Violin plots showing MEs in each INH cluster. Two-sided Wilcoxon test was used to compare ASD versus control samples.”
Rated minor: it would not touch a result — a value no result rests on, a p-value that stays on the same side of the significance level, or a conflict that is clerical, resolved elsewhere in the paper, or outside its own findings.
In the paper
§ hdWGCNA identifies co-expression networks in high-dimensional transcriptomics data > STAR★Methods > Method details
“No←max(‖Kc∗∪Kj∗‖∀j∈S) ⊳ the maximum number of overlapping neighbors betweenc and barcodes inS”
§ hdWGCNA identifies co-expression networks in high-dimensional transcriptomics data > STAR★Methods > Method details
“Inherently, there is overlap between these Nc sets of k neighboring cells, and we include a parameter m to control for the maximum allowable overlap.”
Rated minor: it would not touch a result — a value no result rests on, a p-value that stays on the same side of the significance level, or a conflict that is clerical, resolved elsewhere in the paper, or outside its own findings.
In the paper
§ hdWGCNA identifies co-expression networks in high-dimensional transcriptomics data > Results > Co-expression network analysis of inhibitory neurons in ASD
“The MEs showed that some modules were primarily confined to a single INH cluster (INH-M3, INH-M1) while others were spread across multiple neuronal groups (Figure 5C).”
§ hdWGCNA identifies co-expression networks in high-dimensional transcriptomics data > Results > Co-expression network analysis of inhibitory neurons in ASD
“(C) Gene overlap analysis comparing ASD-associated genes from SFARI and INH co-expression modules, using Fisher’s exact test.”
Citations
Cites
XGBoost: A Scalable Tree Boosting System
Chen, T., & Guestrin, C. (2016) · Proceedings of the 22nd ACM SIGKDD International Conference on Knowledge Discovery and Data Mining · doi:10.1145/2939672.2939785 · Cited by 54,569
WGCNA: an R package for weighted correlation network analysis
Langfelder, P., & Horvath, S. (2008) · BMC Bioinformatics · doi:10.1186/1471-2105-9-559 · Cited by 27,252
Fast unfolding of communities in large networks
Blondel, V. D., Guillaume, J.-L., Lambiotte, R., & Lefebvre, E. (2008) · Journal of Statistical Mechanics: Theory and Experiment · doi:10.1088/1742-5468/2008/10/p10008 · Cited by 21,424
Integrated analysis of multimodal single-cell data
Hao, Y., Hao, S., Andersen-Nissen, E., Mauck, W. M., Zheng, S., Butler, A., Lee, M. J., Wilk, A. J., Darby, C., Zagar, M., et al. (2020) · doi:10.1101/2020.10.12.335331 · Cited by 15,508
Comprehensive Integration of Single-Cell Data
Stuart, T., Butler, A., Hoffman, P., Hafemeister, C., Papalexi, E., Mauck, W. M., Hao, Y., Stoeckius, M., Smibert, P., & Satija, R. (2019) · Cell · doi:10.1016/j.cell.2019.05.031 · Cited by 15,453
Integrating single-cell transcriptomic data across different conditions, technologies, and species
Butler, A., Hoffman, P., Smibert, P., Papalexi, E., & Satija, R. (2018) · Nature Biotechnology · doi:10.1038/nbt.4096 · Cited by 13,174
Fast, sensitive and accurate integration of single-cell data with Harmony
Korsunsky, I., Millard, N., Fan, J., Slowikowski, K., Zhang, F., Wei, K., Baglaenko, Y., Brenner, M., Loh, P.-R., & Raychaudhuri, S. (2019) · Nature Methods · doi:10.1038/s41592-019-0619-0 · Cited by 10,488
UMAP: Uniform Manifold Approximation and Projection
McInnes, L., Healy, J., Saul, N., & Großberger, L. (2018) · Journal of Open Source Software · doi:10.21105/joss.00861 · Cited by 9,826
SCANPY: large-scale single-cell gene expression data analysis
Wolf, F. A., Angerer, P., & Theis, F. J. (2018) · Genome Biology · doi:10.1186/s13059-017-1382-0 · Cited by 8,881
Inference and analysis of cell-cell communication using CellChat
Jin, S., Guerrero-Juarez, C. F., Zhang, L., Chang, I., Ramos, R., Kuan, C.-H., Myung, P., Plikus, M. V., & Nie, Q. (2021) · Nature Communications · doi:10.1038/s41467-021-21246-9 · Cited by 8,409
Research works printed but not linked: 1
- Fleming, 2019, CellBender remove-background: a deep generative model for unsupervised removal of background noise from scRNA-seq datasets, bioRxiv
Cited by
Sorted by citations
Profiling cell identity and tissue architecture with single-cell and spatial transcriptomics
Gulati, G. S., D'Silva, J. P., Liu, Y., Wang, L., & Newman, A. M. (2024) · Nature Reviews Molecular Cell Biology · doi:10.1038/s41580-024-00768-2 · Cited by 347
Metformin decelerates aging clock in male monkeys
Yang, Y., Lu, X., Liu, N., Ma, S., Zhang, H., Zhang, Z., Yang, K., Jiang, M., Zheng, Z., Qiao, Y., et al. (2024) · Cell · doi:10.1016/j.cell.2024.08.021 · Cited by 227
Miyoshi, E., Morabito, S., Henningfield, C. M., Das, S., Rahimzadeh, N., Shabestari, S. K., Michael, N., Emerson, N., Reese, F., Shi, Z., et al. (2024) · Nature Genetics · doi:10.1038/s41588-024-01961-x · Cited by 115
Self-citationSziraki, A., Lu, Z., Lee, J., Banyai, G., Anderson, S., Abdulraouf, A., Metzner, E., Liao, A., Banfelder, J., Epstein, A., et al. (2023) · Nature Genetics · doi:10.1038/s41588-023-01572-y · Cited by 92
Spatially resolved transcriptomic analysis of the germinating barley grain
Peirats‐Llobet, M., Yi, C., Liew, L. C., Berkowitz, O., Narsai, R., Lewsey, M. G., & Whelan, J. (2023) · Nucleic Acids Research · doi:10.1093/nar/gkad521 · Cited by 77
CD200+ fibroblasts form a pro-resolving mesenchymal network in arthritis
Rauber, S., Mohammadian, H., Schmidkonz, C., Atzinger, A., Soare, A., Treutlein, C., Kemble, S., Mahony, C. B., Geisthoff, M., Angeli, M. R., et al. (2024) · Nature Immunology · doi:10.1038/s41590-024-01774-4 · Cited by 83
Senescence-resistant human mesenchymal progenitor cells counter aging in primates
Lei, J., Xin, Z., Liu, N., Ning, T., Jing, Y., Qiao, Y., He, Z., Jiang, M., Yang, Y., Zhang, Z., et al. (2025) · Cell · doi:10.1016/j.cell.2025.05.021 · Cited by 85
Androvic, P., Schifferer, M., Perez Anderson, K., Cantuti-Castelvetri, L., Jiang, H., Ji, H., Liu, L., Gouna, G., Berghoff, S. A., Besson-Girard, S., et al. (2023) · Nature Communications · doi:10.1038/s41467-023-39447-9 · Cited by 67
A single-cell multi-omics atlas of rice
Wang, X., Huang, H., Jiang, S., Kang, J., Li, D., Wang, K., Xie, S. B., Cheng, T., Liu, C., Hu, G., et al. (2025) · Nature · doi:10.1038/s41586-025-09251-0 · Cited by 83
The single-cell transcriptome program of nodule development cellular lineages in Medicago truncatula
Pereira, W. J., Boyd, J., Conde, D., Triozzi, P. M., Balmant, K. M., Dervinis, C., Schmidt, H. W., Novaes, C. R. D. B., Chakraborty, S., Knaack, S., et al. (2024) · Cell Reports · doi:10.1016/j.celrep.2024.113747 · Cited by 61
Yu, W., Biyik‐Sit, R., Uzun, Y., Chen, C.-H., Thadi, A., Sussman, J., Pang, M., Wu, C.-Y., Grossmann, L. D., Gao, P., et al. (2025) · Nature Genetics · doi:10.1038/s41588-025-02158-6 · Cited by 62
Dai, L., Fan, G., Xie, T., Li, L., Tang, L. M., Chen, H., Shi, Y., & Xiao-hong, H. (2024) · Biomarker Research · doi:10.1186/s40364-024-00605-w · Cited by 56
Drought recovery in plants triggers a cell-state-specific immune activation
Illouz‐Eliaz, N., Yu, J., Swift, J., Lande, K., Jow, B., Partida-Garcia, L., Tuang, Z. K., Lee, T. A., Yaaran, A., Castanon, R., et al. (2025) · Nature Communications · doi:10.1038/s41467-025-63467-2 · Cited by 54
Sinner, P., Peckert-Maier, K., Mohammadian, H., Kuhnt, C., Draßner, C., Panagiotakopoulou, V., Rauber, S., Linnerbauer, M., Haimon, Z., Royzman, D., et al. (2023) · Nature Communications · doi:10.1038/s41467-023-40370-2 · Cited by 45
Abedini, A., Sánchez-Navaro, A., Wu, J., Klötzer, K. A., Ma, Z., Poudel, B., Doke, T., Balzer, M. S., Frederick, J., Černecká, H., et al. (2023) · Journal of Clinical Investigation · doi:10.1172/jci157165 · Cited by 45
Stereo-seq of the prefrontal cortex in aging and Alzheimer’s disease
Gong, Y., Haeri, M., Zhang, X., Li, Y., Liu, A., Wu, D., Zhang, Q., Jazwinski, S. M., Zhou, X., Wang, X., et al. (2025) · Nature Communications · doi:10.1038/s41467-024-54715-y · Cited by 52
Koskeridis, F., Fancy, N. N., Tan, P. F., Meena, D., Εvangelou, Ε., Elliott, P., Wang, D. Y. Q., Matthews, P. M., Dehghan, A., & Tzoulaki, I. (2024) · Nature Communications · doi:10.1038/s41467-024-53452-6 · Cited by 46
Deng, X., Huang, Y., Zhang, J., Chen, Y., Jiang, F., Zhang, Z., Li, T., Hou, L., Tan, W., & Li, F. (2025) · International Immunopharmacology · doi:10.1016/j.intimp.2025.114119 · Cited by 49
Ross, J. L., Vallcorba, M. P., Piñero, G., Soni, N., Thomason, W., DeSisto, J. A., Angione, A., Tsankova, N. M., Castro, M. G., Schniederjan, M., et al. (2024) · Immunity · doi:10.1016/j.immuni.2024.09.007 · Cited by 46
Beltran, J. V. B., Lin, F., Chang, C., & Ko, T. (2023) · Circulation · doi:10.1161/circulationaha.123.064734 · Cited by 39
Aging atlas reveals cell-type-specific effects of pro-longevity strategies
Gao, S. M., Qi, Y., Zhang, Q., Guan, Y., Lee, Y.-T., Ding, L., Wang, L., Mohammed, A., Li, H., Fu, Y., et al. (2024) · Nature Aging · doi:10.1038/s43587-024-00631-1 · Cited by 62
Opportunities and Challenges in Advancing Plant Research with Single-cell Omics
Rhaman, M. S., Ali, M., Ye, W., & Li, B. (2024) · Genomics Proteomics & Bioinformatics · doi:10.1093/gpbjnl/qzae026 · Cited by 45
Zhou, J., Abedini, A., Balzer, M. S., Shrestha, R., Dhillon, P., Liu, H., Hu, H., & Suszták, K. (2023) · Journal of the American Society of Nephrology · doi:10.1681/asn.0000000000000217 · Cited by 37
scImmOmics: a manually curated resource of single-cell multi-omics immune data
Li, Y., Zhou, L., Qian, F., Fang, Q.-L., Yu, Z., Cui, T., Dong, F.-J., Cai, F.-H., Yu, T., Li, L., et al. (2024) · Nucleic Acids Research · doi:10.1093/nar/gkae985 · Cited by 35
Bonev, B., Castelo‐Branco, G., Chen, F., Codeluppi, S., Corces, M. R., Fan, J., Heiman, M., Harris, K., Inoue, F., Kellis, M., et al. (2024) · Nature Neuroscience · doi:10.1038/s41593-024-01806-0 · Cited by 44
Integrated Multi-Omics Analyses Reveal Lipid Metabolic Signature in Osteoarthritis
Wang, Y., Zeng, T., Tang, D., Cui, H., Wan, Y., & Tang, H. (2024) · Journal of Molecular Biology · doi:10.1016/j.jmb.2024.168888 · Cited by 38
Albertini, G., Zielonka, M., Cuypers, M., Snellinx, A., Xu, C., Poovathingal, S. K., Wojno, M., Davie, K., van Lieshout, V., Craessaerts, K., et al. (2025) · Nature Neuroscience · doi:10.1038/s41593-025-02125-8 · Cited by 47
Protracted neuronal recruitment in the temporal lobes of young children
Nascimento, M. A., Biagiotti, S. W., Herranz‐Pérez, V., Santiago, S., Bueno, R., Ye, C., Abel, T. J., Zhang, Z., Rubio-Moll, J. S., Kriegstein, A. R., et al. (2023) · Nature · doi:10.1038/s41586-023-06981-x · Cited by 38
GFAP-isoforms in the nervous system: Understanding the need for diversity
de Reus, A. J. E. M., Başak, O., Dykstra, W., van Asperen, J. V., van Bodegraven, E. J., & Hol, E. M. (2024) · Current Opinion in Cell Biology · doi:10.1016/j.ceb.2024.102340 · Cited by 35
Cell-type brain-region specific changes in prefrontal cortex of a mouse model of alcohol dependence
Salem, N. A., Manzano, L. A., Keist, M. W., Ponomareva, O. Y., Roberts, A. J., Roberto, M., & Mayfield, R. D. (2023) · Neurobiology of Disease · doi:10.1016/j.nbd.2023.106361 · Cited by 33
Sun, Y., Wu, J., Zhang, Q., Wang, P., Zhang, J., & Yuan, Y. (2024) · Journal of Translational Medicine · doi:10.1186/s12967-024-05421-2 · Cited by 34
Xia, P., Ouyang, S., Shen, R., et al. (2023) · International Journal of Molecular Sciences · doi:10.3390/ijms24108819 · Cited by 31
Gene networks and systems biology in Alzheimer's disease: Insights from multi‐omics approaches
Rahimzadeh, N., Srinivasan, S. S., Zhang, J., & Swarup, V. (2024) · Alzheimer s & Dementia · doi:10.1002/alz.13790 · Cited by 39
Self-citationXu, W., Zhang, W., Zhao, D., Wang, Q., Zhang, M., Li, Q., Zhu, W., & Xu, C. (2023) · Frontiers in Immunology · doi:10.3389/fimmu.2023.1242909 · Cited by 31
Lai, G., Xie, B., Zhang, C., Zhong, X., Deng, J., Li, K., Liu, H., Zhang, Y., Liu, A., Liu, Y., et al. (2024) · Genes & Diseases · doi:10.1016/j.gendis.2024.101471 · Cited by 35
Hao, R.-H., Zhang, T.-P., Jiang, F., Liu, J.-H., Dong, S., Li, M., Guo, Y., & Yang, T. (2024) · Nature Communications · doi:10.1038/s41467-024-49263-4 · Cited by 30
Han, E., Geng, Z., Qin, Y., Wang, Y., & Ma, S. (2024) · Plant Communications · doi:10.1016/j.xplc.2024.100978 · Cited by 26
Chen, X., Ma, L., Bo, Y., Xia, B., Guo, Y., Shang, Y., Yan, F., Huang, E., Shi, W., Ding, R., et al. (2025) · Forensic Science International · doi:10.1016/j.forsciint.2025.112646 · Cited by 26
Single-cell and spatial transcriptomics: Bridging current technologies with long-read sequencing
Yuan, C. U., Quah, F. X., & Hemberg, M. (2024) · Molecular Aspects of Medicine · doi:10.1016/j.mam.2024.101255 · Cited by 30
Kim, G. D., Shin, S.-I., Sun, P., Lee, J. E., Chung, C., Kang, Y. E., Kang, D. H., & Park, J. (2025) · Journal for ImmunoTherapy of Cancer · doi:10.1136/jitc-2025-011636 · Cited by 27
Hong, S. E., Mun, S. J., Lee, Y. J., Yoo, T., Suh, K., Kang, K. W., Son, M. J., Kim, W. K., & Choi, M. (2025) · Nature Genetics · doi:10.1038/s41588-025-02237-8 · Cited by 33
Lin, Q., Ma, W., Xu, M., Xu, Z., Wang, J., Liang, Z., Zhu, L., Wu, M., Luo, J., Liu, H., et al. (2024) · Heliyon · doi:10.1016/j.heliyon.2024.e36898 · Cited by 24
Ginkgolide B increases healthspan and lifespan of female mice
Lee, C., Wang, B. Y., Wong, S. H., Chen, Y., Cao, Q., Hsiao, A. W., Fung, S.-H., Chen, Y.-F., Wu, H.-H., Cheng, P.-Y., et al. (2025) · Nature Aging · doi:10.1038/s43587-024-00802-0 · Cited by 26
PPARγ attenuates cellular senescence of alveolar macrophages in asthma-COPD overlap
Wan, R., Srikaram, P., Xie, S., Chen, Q., Hu, C., Wan, M., Li, Y., & Gao, P. (2024) · Respiratory Research · doi:10.1186/s12931-024-02790-6 · Cited by 22
Changes in border-associated macrophages after stroke: Single-cell sequencing analysis
Yu, N., Zhao, Y., Wang, P., Zhang, F., Wen, C., & Wang, S.-L. (2025) · Neural Regeneration Research · doi:10.4103/nrr.nrr-d-24-01092 · Cited by 24
Immune perturbations in human pancreas lymphatic tissues prior to and after type 1 diabetes onset
Golden, G. J., Wu, V. H., Hamilton, J. T., Amses, K. R., Shapiro, M. R., Japp, A. S., Liu, C., Pampena, M. B., Kuri-Cervantes, L., Knox, J. J., et al. (2025) · Nature Communications · doi:10.1038/s41467-025-59626-0 · Cited by 27
Salmani, B. Y., Lahti, L., Gillberg, L., Jacobsen, J. K., Mantas, I., Svenningsson, P., & Perlmann, T. (2023) · eLife · doi:10.7554/elife.89482 · Cited by 46
Hu, C., Sameshima, J., Yokomizo, S., Sueyoshi, T., Nagano, H., Miyahara, Y., Sakamoto, T., Fujii, S., Kiyoshima, T., Guy, T. V., et al. (2023) · Frontiers in Immunology · doi:10.3389/fimmu.2023.1305783 · Cited by 23
Hou, J., Yang, Y., & Han, X. (2023) · International Journal of Molecular Sciences · doi:10.3390/ijms25010094 · Cited by 22
Artificial Intelligence in battling infectious diseases: A transformative role
Li, C., Ye, G., Jiang, Y., Wang, Z., Yu, H., & Yang, M. (2024) · Journal of Medical Virology · doi:10.1002/jmv.29355 · Cited by 24
Zhang, M., Li, M., An, Y., Liu, C., Zhao, Q., Zhang, D., Pan, B., & Tan, H. (2025) · Nature Communications · doi:10.1038/s41467-025-63770-y · Cited by 24
Song, Z., Li, S. C., Shang, Z., Lv, W., Cheng, X., Xin, M., Chen, R., Zhang, S., & Zhang, R. (2023) · Briefings in Functional Genomics · doi:10.1093/bfgp/elad052 · Cited by 20
Liu, Q., Niu, Y., Pei, Z., Yang, Y., Xie, Y., Wang, M., Wang, J., Wu, M., Zheng, J., Yang, P., et al. (2024) · Journal of Hazardous Materials · doi:10.1016/j.jhazmat.2024.134786 · Cited by 20
Zhang, Y., Wu, Y., Li, M., Mijiti, A., & Cheng, L.-F. (2024) · Journal of Translational Medicine · doi:10.1186/s12967-024-05624-7 · Cited by 19
Brain-wide alterations revealed by spatial transcriptomics and proteomics in COVID-19 infection
Zhang, T., Li, Y., Pan, L., Sha, J., Bailey, M., Faure-Kumar, E., Williams, C. K., Wohlschlegel, J., Magaki, S., Niu, C., et al. (2024) · Nature Aging · doi:10.1038/s43587-024-00730-z · Cited by 20
Yang, Y., Liu, Z., Wei, Y., He, S., Gu, A., Li, Z., Li, J., Xu, Z., & Cen, B. (2024) · Cell & Bioscience · doi:10.1186/s13578-024-01332-3 · Cited by 22
Multiplexed transcriptomic analyzes of the plant embryonic hourglass
Wu, H., Zhang, R., Niklas, K. J., & Scanlon, M. J. (2025) · Nature Communications · doi:10.1038/s41467-024-55803-9 · Cited by 28
Xu, W., Jiang, T., Shen, K., Zhao, D., Zhang, M., Zhu, W., Liu, Y., & Xu, C. (2023) · Frontiers in Endocrinology · doi:10.3389/fendo.2023.1224832 · Cited by 19
Integrated Single-Cell Transcriptomic Atlas of Human Kidney Endothelial Cells
Zhang, K., Kan, H., Mao, A., Yu, F., Li, G., Zhou, T., Feng, L., & Ma, X. (2024) · Journal of the American Society of Nephrology · doi:10.1681/asn.0000000000000320 · Cited by 20
Molecular signatures of resilience to Alzheimer’s disease in neocortical layer 4 neurons
Dharshini, S. A. P., Sanz‐Ros, J., Pan, J., Tang, W., Vallejo, K., Liu, Y. C., Otero‐García, M., & Cobos, I. (2026) · Nature Communications · doi:10.1038/s41467-026-68920-4 · Cited by 23
Liu, X., Shen, H., Yu, J., Luo, F., Li, T., Li, Q., Yuan, X., Sun, Y., & Zhou, Z. (2024) · Clinical and Translational Medicine · doi:10.1002/ctm2.1581 · Cited by 17
Relapse to cocaine seeking is regulated by medial habenula NR4A2/NURR1 in mice
Childs, J. E., Morabito, S., Das, S., Santelli, C., Pham, V., Kusche, K. M., Vera, V. A., Reese, F., Campbell, R. R., Matheos, D. P., et al. (2024) · Cell Reports · doi:10.1016/j.celrep.2024.113956 · Cited by 21
Self-citationBuilding and analyzing metacells in single-cell genomics data
Bilous, M., Hérault, L., Gabriel, A. A., Teleman, M., & Gfeller, D. (2024) · Molecular Systems Biology · doi:10.1038/s44320-024-00045-6 · Cited by 18
Genome-wide enhancer-associated tandem repeats are expanded in cardiomyopathy
Mitina, A., Khan, M., Lesurf, R., Yin, Y., Engchuan, W., Hamdan, O., Pellecchia, G., Trost, B., Backstrom, I., Guo, K., et al. (2024) · EBioMedicine · doi:10.1016/j.ebiom.2024.105027 · Cited by 16
Single Cell Transcriptome of Stress Vulnerability Network in mouse Prefrontal Cortex
Hing, B. W. Q., Mitchell, S. B., Filali, Y., Eberle, M., Hultman, I., Matkovich, M., Kasturirangan, M., Johnson, M., Wyche, W., Jimenez, A., et al. (2023) · Biological Psychiatry · doi:10.1016/j.biopsych.2024.05.023 · Cited by 21
Chen, L.-X., Zhang, M.-D., Xu, H., Ye, H.-Q., Chen, D.-F., Wang, P., Bao, Z.-W., Zou, S.-M., Lv, Y.-T., Wu, Z., et al. (2024) · Research · doi:10.34133/research.0548 · Cited by 22
UCell and pyUCell: single-cell gene signature scoring for R and Python
Andreatta, M., & Carmona, S. J. (2026) · Bioinformatics · doi:10.1093/bioinformatics/btag055 · Cited by 21
Lee, U., Zhang, Y., Zhu, Y., Luo, A. C., Gong, L., Tremmel, D. M., Kim, Y., Villarreal, V. S., Wang, X., Lin, R., et al. (2024) · Nature Communications · doi:10.1038/s41467-024-52678-8 · Cited by 18
Sex-specific single cell-level transcriptomic signatures of Rett syndrome disease progression
Sharifi, O., Haghani, V., Neier, K. E., Fraga, K. J., Korf, I. F., Hakam, S. M., Quon, G., Johansen, N., Yasui, D. H., & LaSalle, J. M. (2024) · Communications Biology · doi:10.1038/s42003-024-06990-0 · Cited by 17
Single-cell parallel analysis of DNA damage and transcriptome reveals selective genome vulnerability
Bai, D., Cao, Z., Attada, N., Song, J., & Zhu, C. (2025) · Nature Methods · doi:10.1038/s41592-025-02632-3 · Cited by 16
Zhang, B., Pei, Z., Tian, A., He, W., Sun, C., Hao, T., Ariben, J., Li, S., Wu, L., Yang, X., et al. (2024) · Orthopaedic Surgery · doi:10.1111/os.14172 · Cited by 15
Liu, Z., Ke, S.-R., Shi, Z., Zhou, M. S., Sun, L., Sun, Q., Xiao, B., Wang, D., Huang, Y., Lin, J. E., et al. (2024) · JCI Insight · doi:10.1172/jci.insight.181488 · Cited by 15
Zhao, S., Yu, H., Li, Z., Chen, W., Liu, K., Dai, H., Wang, G., Zhang, Z., Xie, J., He, Y., et al. (2025) · Biology Direct · doi:10.1186/s13062-025-00628-9 · Cited by 16
Vitamin C conveys geroprotection on primate ovaries
Jing, Y., Lu, H., Li, J., He, Z., Zhao, L., Zhang, C., Huang, Z., Liu, L., Sun, S., Ma, S., et al. (2025) · Cell stem cell · doi:10.1016/j.stem.2025.09.008 · Cited by 20
Song, B., Zhu, Y., Zhao, Y., Wang, K., Peng, Y., Chen, L., Yu, Z., & Song, B. (2023) · International Wound Journal · doi:10.1111/iwj.14481 · Cited by 17
Xu, P., Tao, Z., & Zhang, C. (2024) · Frontiers in Immunology · doi:10.3389/fimmu.2024.1377817 · Cited by 15
Tian, G., Bartas, K., Hui, M., Chen, L., Vasquez, J. J., Azouz, G., Derdeyn, P., Manville, R. W., Ho, E. L., Fang, A. S., et al. (2024) · Neuron · doi:10.1016/j.neuron.2024.07.018 · Cited by 22
Zhang, C., Gou, X., Lai, G., Li, K., Zhu, X., Liu, N., Kuang, Y., Ren, K., Xie, Y., Xu, Y., et al. (2024) · Cancer Letters · doi:10.1016/j.canlet.2024.217259 · Cited by 17
Schmidt, H. W., Conde, D., Pereira, W. J., Triozzi, P. M., Balmant, K. M., Dervinis, C., & Kirst, M. (2025) · Genome biology · doi:10.1186/s13059-025-03728-x · Cited by 19
McCrimmon, C. M., Toker, D., Pahos, M., Cao, Q., Lozano, K., Lin, J. J., Parent, J. M., Tidball, A. M., Zheng, J., Molnár, L., et al. (2025) · Cell Reports · doi:10.1016/j.celrep.2025.116217 · Cited by 17
Hu, Y., Schaefer, R., Rendleman, M. C., Slattery, A., Cramer, A., Nahiyan, A., Breitweiser, L. A., Shah, M., Kaehler, E., Yao, C., et al. (2025) · Frontiers in Plant Science · doi:10.3389/fpls.2025.1637176 · Cited by 18
Zhang, H., Yang, Y., Cao, Y., & Guan, J. (2024) · Respiratory Research · doi:10.1186/s12931-024-02845-8 · Cited by 16
Aging Atlas Reveals Cell-Type-Specific Regulation of Pro-longevity StrategiesPreprint
Gao, S. M., Qi, Y., Zhang, Q., Mohammed, A. S., Lee, Y.-T., Guan, Y., Li, H., Fu, Y., & Wang, M. C. (2023) · bioRxiv (Cold Spring Harbor Laboratory) · doi:10.1101/2023.02.28.530490 · Cited by 14
Autism Spectrum Disorder: The Cerebellum, Genes, and Pathways
D’Mello, S. R. (2025) · Neurology International · doi:10.3390/neurolint17100173 · Cited by 15
Yoon, H., Dean, L. S., Jiyarom, B., Khadka, V. S., Deng, Y., Nerurkar, V. R., Chow, D. C., Shikuma, C. M., Devendra, G., Koh, Y., et al. (2024) · Frontiers in Immunology · doi:10.3389/fimmu.2023.1268510 · Cited by 15
Ding, B., Ye, Z., Yin, H., Hong, X., Feng, S., Xu, J., & Shen, Y. (2024) · Heliyon · doi:10.1016/j.heliyon.2024.e27873 · Cited by 13
Liu, L., Liu, E., Hu, Y., Li, S., Zhang, S., Chao, H., Hu, Y., Zhu, Y., Chen, Y., Xie, L., et al. (2024) · Nucleic Acids Research · doi:10.1093/nar/gkae1017 · Cited by 13
Qin, J., Hu, S., Chen, Y., et al. (2025) · Molecular Carcinogenesis · doi:10.1002/mc.23882 · Cited by 13
Multi‐Omics and ‐Organ Insights into Energy Metabolic Adaptations in Early Sepsis Onset
Xu, L., Zhou, Z., Schäuble, S., Vivas, W., Dlubatz, K., Bauer, M. W., Weis, S., Singer, M., Lukaszewski, R. A., & Panagiotou, G. (2025) · Advanced Science · doi:10.1002/advs.202504418 · Cited by 13
He, Y., Li, J. F., Chen, S., Ye, R., Fei, Y.-R., Tong, S., Song, Y., Wang, C., Zhang, L., Fang, J., et al. (2025) · BMC Pregnancy and Childbirth · doi:10.1186/s12884-025-07742-6 · Cited by 13
Swaro, A., Bristow, B. N., Anwer, M., Zhang, A. A., Kraus, L., Gandhi, R. K., Erwin, S. R., Stach, T. R., Sullivan, K. E., Fan, J., et al. (2025) · Cell Reports · doi:10.1016/j.celrep.2025.115795 · Cited by 13
Molecular and cellular processes disrupted in the early postnatal Down syndrome prefrontal cortex
Risgaard, R. D., Hanthanan Arachchilage, K., Knaack, S. A., Hosseini, M., Chen, R. J., Kumarage, P., Schmidt, D. K., Huang, X., Sheng, J., Wang, C. J., et al. (2026) · Science · doi:10.1126/science.aea1549 · Cited by 12
Vuong, C. K., Weber, A., Seong, P., Matoba, N., Chen, Y.-J., Peyer, J., Younesi, S., Salinda, A., Gomez, D., Rivas, G., et al. (2026) · Science · doi:10.1126/science.aea1259 · Cited by 18
Almeida‐Silva, F., & de Peer, Y. V. (2025) · The Plant Cell · doi:10.1093/plcell/koaf243 · Cited by 13
AP-1/c-Fos supports SIV and HIV-1 latency in CD4 T cells infected in vivo
Jiménez, V. C., Geretz, A., Tokarev, A., Ehrenberg, P. K., Deletsu, S. D., Machmach, K., Mudvari, P., Howard, J. N., Zelkoski, A. E., Paquin‐Proulx, D., et al. (2023) · iScience · doi:10.1016/j.isci.2023.108015 · Cited by 12
Warden, A. S., Salem, N. A., Brenner, E. A., Sutherland, G. T., Stevens, J., Kapoor, M., Goate, A., & Mayfield, R. D. (2025) · Biological Psychiatry · doi:10.1016/j.biopsych.2025.02.895 · Cited by 15
Perez, Y., Velmeshev, D., Wang, L., White, M. L., Siebert, C., Baltazar, J., Zuo, G., Moriano, J., Chen, S., Steffen, D. M., et al. (2025) · Nature Communications · doi:10.1038/s41467-025-61184-4 · Cited by 12
Kriukov, E., Soucy, J. R., Labrecque, E., & Baranov, P. Y. (2025) · Developmental Biology · doi:10.1016/j.ydbio.2025.08.025 · Cited by 13
Sim, H., Park, H. J., Park, G., Kim, Y. J., Park, W., Lee, S., & Choi, M. (2024) · eLife · doi:10.7554/elife.96951 · Cited by 12
Cheng, J. Y., Cheng, M., Sinha, S. K., Cely, I., Charugundla, S., Han, M., Zhang, G., Zhou, Z., Gladkikh, S., Ahn, I. S., et al. (2025) · Arteriosclerosis Thrombosis and Vascular Biology · doi:10.1161/atvbaha.125.323047 · Cited by 13
Metadata
- Authors
- Morabito, S., Reese, F., Rahimzadeh, N., Miyoshi, E., & Swarup, V.
- Affiliations
- University of California, Irvine (US)
- Corresponding author
- Swarup, Vivek
- Venue
- Cell Reports Methods
- Publisher
- Elsevier BV
- Published
- 2023-06
- Volume
- 3
- Issue
- 6
- Pages
- 100498
- ISSN
- 2667-2375 (ISSN-L)
- PMC
- PMC10326379
- OpenAlex
- W4380370818
- Cited by
- 773
- References
- 92
- Citations by year
- 2026: 267 · 2025: 285 · 2024: 180 · 2023: 40
- FWCI
- 58.73
- Type
- journal article
- Language
- en
- Open access
- gold
- doi.org
- Licence
- Locations
- Cell Reports Methods (publishedVersion, cc-by)
- bioRxiv (Cold Spring Harbor Laboratory) (acceptedVersion, cc-by-nc-nd)
- PubMed (publishedVersion)
- PubMed Central (submittedVersion, cc-by)
- eScholarship (California Digital Library) (submittedVersion, cc-by)
- Funders
- Uganda Cancer Institute
- NIDA (1U01DA053826)
- National Institute on Aging (1RF1AG071683, 3U19AG068054-02S, U54 AG054349-06)
- NINDS (P01NS084974- 06A1)
- Dr. Miriam and Sheldon G. Adelson Medical Research Foundation
- University of California, Irvine
- Topics
- Life Sciences › Biochemistry, Genetics and Molecular Biology › Molecular Biology › Single-cell and spatial transcriptomics
- Life Sciences › Biochemistry, Genetics and Molecular Biology › Molecular Biology › Bioinformatics and Genomic Networks
- Life Sciences › Biochemistry, Genetics and Molecular Biology › Molecular Biology › Gene expression and cancer classification
- Keywords
- co-expression network, single-cell RNA sequencing, spatial transcriptomics, autism spectrum disorder, Alzheimer's disease, brain transcriptomics
- MeSH terms
- Autism Spectrum Disorder, Alzheimer Disease, Humans, Gene Expression Profiling, Gene Regulatory Networks, Transcriptome
About these checks
Registry, retraction, Cites and statistics results are computed, not judged, with one exception: a printed reference that no index lists is read once by a model before it counts as a citation error. Claims are extracted by a model and kept only when their quote appears verbatim in the text; each cited source is then checked, with a model’s help, for whether it says what the claim relies on. Those verdicts can be wrong — read the claim’s quote and the cited source before relying on one.
A language model drew the claims from the paper on 2026-10-13, under version 3 of the claim definition (model deepseek-v4.1-flash, prompt extract-v3).
A second model labelled each claim on 2026-10-13 (model jev-1.13-20260917, definition revision gold-guideline-v0.2).
Cited sources are checked with a language model’s help (gpt-6-sol).
Statistics and arithmetic are recomputed, not judged.
Confidence bands are shown only for fields calibrated on our annotated test set. None is calibrated yet, so no band is shown.
What counts as a claim ›How we measure confidence ›How we check this ›
Are you an author, or do you see a problem with this page? Request a review
