

The DOI matches its Crossref record; 58 of the 60 references it cites were found in a registry or an index.
IL-4 Receptor Alpha Signaling through Macrophages Differentially Regulates Liver Fibrosis Progression and Reversal
Open accessAbstract
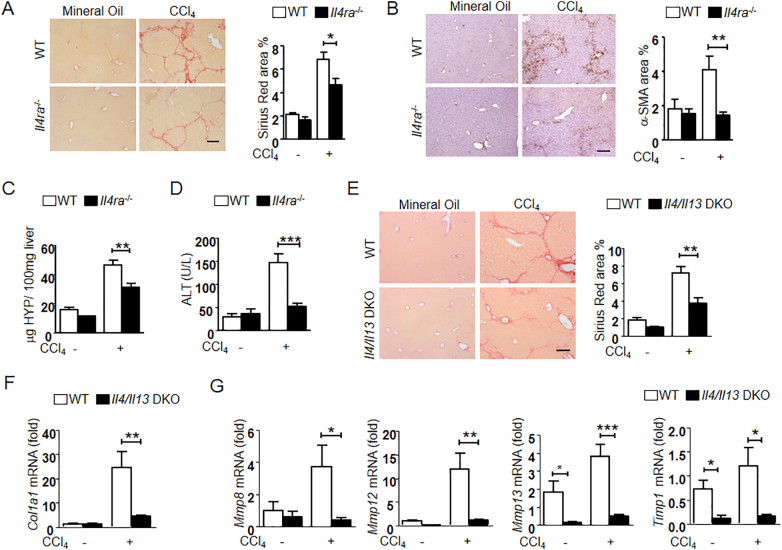
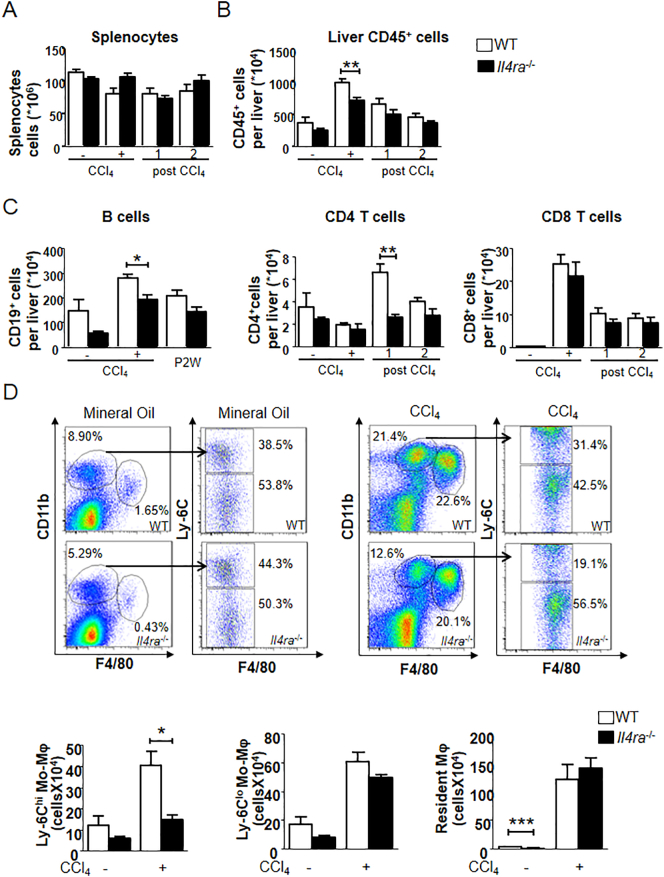
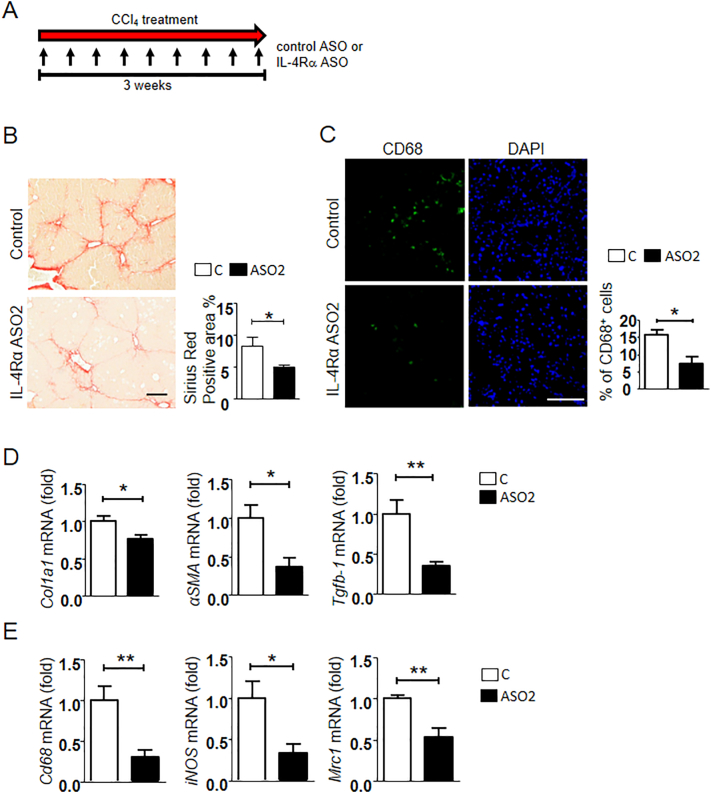
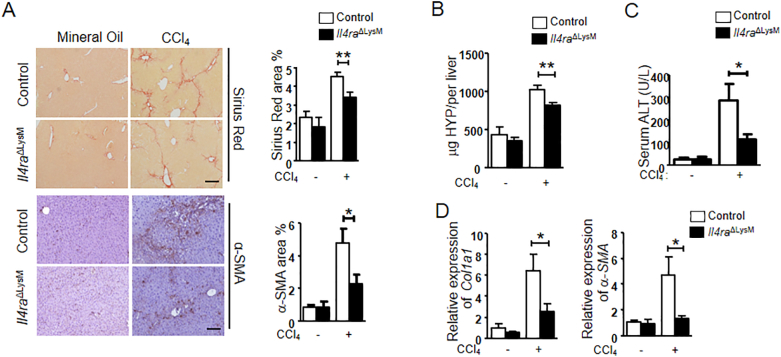
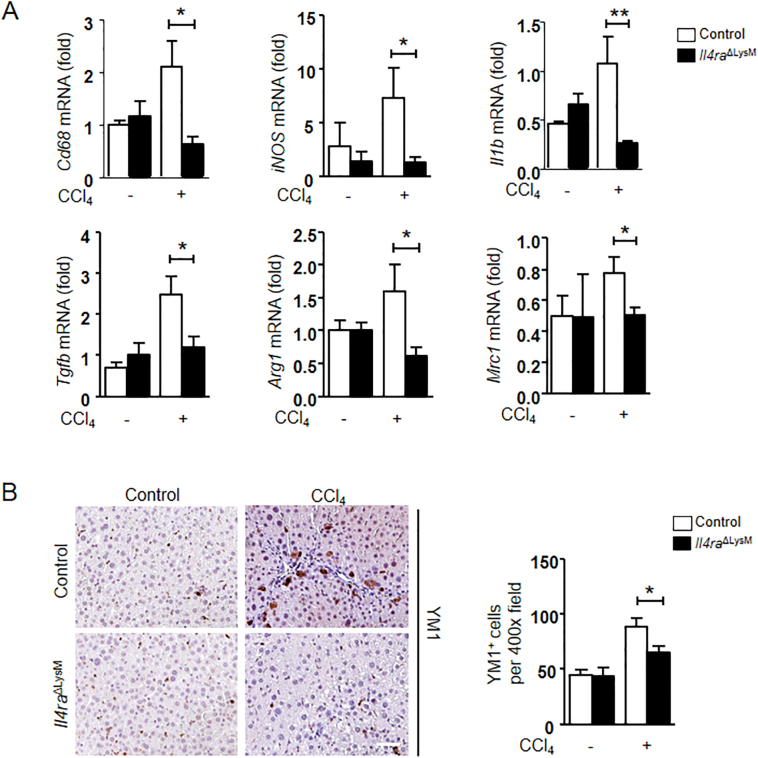
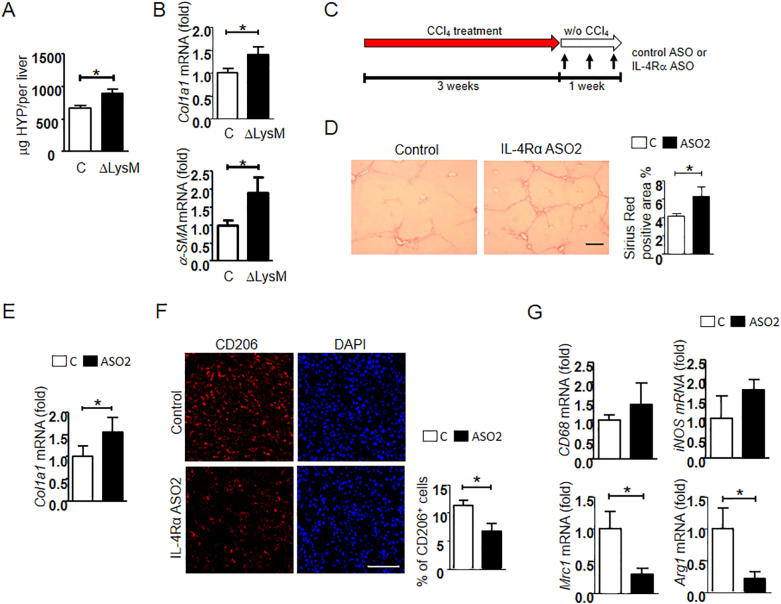
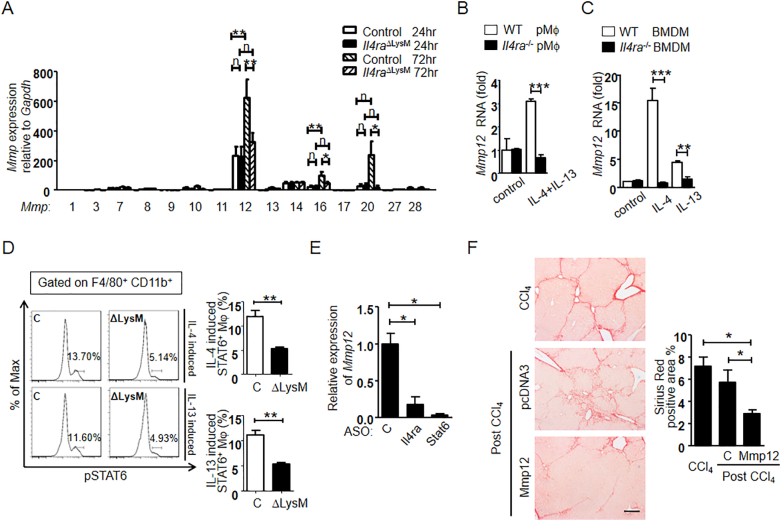
Chronic hepatitis leads to liver fibrosis and cirrhosis. Cirrhosis is a major cause of worldwide morbidity and mortality. Macrophages play a key role in fibrosis progression and reversal. However, the signals that determine fibrogenic vs fibrolytic macrophage function remain ill defined. We studied the role of interleukin-4 receptor α (IL-4Rα), a potential central switch of macrophage polarization, in liver fibrosis progression and reversal. We demonstrate that inflammatory monocyte infiltration and liver fibrogenesis were suppressed in general IL-4Rα −/− as well as in macrophage-specific IL-4Rα −/− (IL-4Rα ΔLysM ) mice. However, with deletion of IL-4Rα ΔLysM spontaneous fibrosis reversal was retarded. Results were replicated by pharmacological intervention using IL-4Rα-specific antisense oligonucleotides. Retarded resolution was linked to the loss of M2-type resident macrophages, which secreted MMP-12 through IL-4 and IL-13-mediated phospho-STAT6 activation. We conclude that IL-4Rα signaling regulates macrophage functional polarization in a context-dependent manner. Pharmacological targeting of macrophage polarization therefore requires disease stage-specific treatment strategies. Research in Context Alternative (M2-type) macrophage activation through IL-4Rα promotes liver inflammation and fibrosis progression but speeds up fibrosis reversal. This demonstrates context dependent, opposing roles of M2-type macrophages. During reversal IL-4Rα induces fibrolytic MMPs, especially MMP-12, through STAT6. Liver-specific antisense oligonucleotides efficiently block IL-4Rα expression and attenuate fibrosis progression.
Overview
The claims and statistics of this paper haven’t been checked yet.
Run the check — free, no account needed. It reads the open-access text and checks the sources it cites.
Integrity signals
Registry
Cites
Statistics
Figures
Verification
Claims the paper makes
The claims and statistics of this paper haven’t been checked yet.
Run the check — free, no account needed. It reads the open-access text and checks the sources it cites.
Claims other papers make about this one
Each is checked against this paper’s own text: does it say what the citing paper says it does?
The cited source doesn’t support the claim as written.
In the citing paper
“As shown by Weng et al. (65), IL-4Rα deficiency -despite its role in monocyte-to-resolutive macrophage differentiation- can paradoxically exacerbate fibrosis when present during active fibrogenesis, emphasizing the stage- and context-dependent nature of macrophage reprogramming.”
From Strategies to promote liver fibrosis amelioration with involvement of restorative macrophages (2026) · cites this paper as [65]
Checked by a reasoning model — may be wrong.
Experimental — accuracy not yet measuredThe cited source says what the claim attributes to it.
In the citing paper
“Mechanistically, IL-4 and IL-13 were shown to activate STAT6 in macrophages, leading to overexpression of the fibrolytic enzyme MMP-12 (65).”
From Strategies to promote liver fibrosis amelioration with involvement of restorative macrophages (2026) · cites this paper as [65]
The cited source says what the claim attributes to it.
In the citing paper
“Notably, disruption of IL-4Rα signaling has yielded context-dependent effects: while genetic deletion reduces macrophage populations and ameliorates fibrosis, antisense-mediated inhibition during regression impairs restorative polarization and delays fibrosis resolution (65).”
From Strategies to promote liver fibrosis amelioration with involvement of restorative macrophages (2026) · cites this paper as [65]
Self-check
Percentages, sums and reported differences re-computed from the paper’s own numbers.
The self-check needs the paper’s full text.
Citations
Cites
Macrophage activation and polarization: nomenclature and experimental guidelines
Murray, P. J., Allen, J. E., Biswas, S. K., Fisher, E. A., Gilroy, D. W., Goerdt, S., Gordon, S., Hamilton, J. A., Ivashkiv, L. B., Lawrence, T., et al. (2014) · Immunity · doi:10.1016/j.immuni.2014.06.008 · Cited by 6,337
Alternative activation of macrophages: mechanism and functions
Gordon, S., & Martinez, F. O. (2010) · Immunity · doi:10.1016/j.immuni.2010.05.007 · Cited by 4,197
Schuppan, D., & Afdhal, N. H. (2008) · The Lancet · doi:10.1016/s0140-6736(08)60383-9 · Cited by 2,089
Self-citationStein, M., Keshav, S., Harris, N., & Gordon, S. (1992) · The Journal of experimental medicine · doi:10.1084/jem.176.1.287 · Cited by 1,960
Marcellin, P., Gane, E., Buti, M., Afdhal, N., Sievert, W., Jacobson, I. M., Washington, M. K., Germanidis, G., Flaherty, J. F., Schall, R. A., et al. (2013) · The Lancet · doi:10.1016/s0140-6736(12)61425-1 · Cited by 1,788
Macrophage heterogeneity in liver injury and fibrosis
Tacke, F., & Zimmermann, H. W. (2014) · Journal of Hepatology · doi:10.1016/j.jhep.2013.12.025 · Cited by 1,061
Ramachandran, P., Pellicoro, A., Vernon, M. A., Boulter, L., Aucott, R. L., Ali, A., Hartland, S. N., Snowdon, V. K., Cappon, A., Gordon-Walker, T. T., et al. (2012) · Proceedings of the National Academy of Sciences · doi:10.1073/pnas.1119964109 · Cited by 1,001
Chang, T., Liaw, Y., Wu, S., Schiff, E. R., Han, K., Lai, C., Safadi, R., Lee, S. S., Halota, W., Goodman, Z. D., et al. (2010) · Hepatology · doi:10.1002/hep.23785 · Cited by 973
Fichtner‐Feigl, S., Strober, W., Kawakami, K., Puri, R. K., & Kitani, A. (2005) · Nature Medicine · doi:10.1038/nm1332 · Cited by 905
Arginase-1–Expressing Macrophages Suppress Th2 Cytokine–Driven Inflammation and Fibrosis
Pesce, J. T., Ramalingam, T. R., Mentink-Kane, M. M., Wilson, M. S., El Kasmi, K. C., Smith, A. M., Thompson, R. W., Cheever, A. W., Murray, P. J., & Wynn, T. A. (2009) · PLoS Pathogens · doi:10.1371/journal.ppat.1000371 · Cited by 816
Cited by
Sorted by citations
The role of macrophages in nonalcoholic fatty liver disease and nonalcoholic steatohepatitis
Kazankov, K., Jørgensen, S. M. D., Thomsen, K. L., Møller, H. J., Vilstrup, H., George, J., Schuppan, D., & Grønbæk, H. (2019) · Nature Reviews Gastroenterology & Hepatology · doi:10.1038/s41575-018-0082-x · Cited by 941
Self-citationShared and distinct mechanisms of fibrosis
Distler, J. H. W., Györfi, A., Ramanujam, M., Whitfield, M. L., Königshoff, M., & Lafyatis, R. (2019) · Nature Reviews Rheumatology · doi:10.1038/s41584-019-0322-7 · Cited by 674
Macrophage Polarization and Its Role in Liver Disease
Wang, C., Ma, C., Gong, L., Guo, Y., Fu, K., Zhang, Y., Zhou, H., & Li, Y. (2021) · Frontiers in Immunology · doi:10.3389/fimmu.2021.803037 · Cited by 591
Macrophages in wound healing: activation and plasticity
Kim, S. Y., & Nair, M. G. (2019) · Immunology and Cell Biology · doi:10.1111/imcb.12236 · Cited by 536
Liver fibrosis: Direct antifibrotic agents and targeted therapies
Schuppan, D., Ashfaq–Khan, M., Yang, A. T., & Kim, Y. O. (2018) · Matrix Biology · doi:10.1016/j.matbio.2018.04.006 · Cited by 451
Self-citationMacrophage and Fibroblast Interactions in Biomaterial‐Mediated Fibrosis
Witherel, C. E., Abebayehu, D., Barker, T. H., & Spiller, K. L. (2019) · Advanced Healthcare Materials · doi:10.1002/adhm.201801451 · Cited by 374
Martin, K. E., & Garcı́a, A. J. (2021) · Acta Biomaterialia · doi:10.1016/j.actbio.2021.03.038 · Cited by 384
Major pathways involved in macrophage polarization in cancer
Kerneur, C., Cano, C. E., & Olive, D. (2022) · Frontiers in Immunology · doi:10.3389/fimmu.2022.1026954 · Cited by 363
Cellular and Molecular Mechanisms Underlying Liver Fibrosis Regression
Caligiuri, A., Gentilini, A., Pastore, M., Gitto, S., & Marra, F. (2021) · Cells · doi:10.3390/cells10102759 · Cited by 283
The IL-4/IL-13 axis in skin fibrosis and scarring: mechanistic concepts and therapeutic targets
Nguyen, J. K., Austin, E., Huang, A., Mamalis, A., & Jagdeo, J. R. (2019) · Archives of Dermatological Research · doi:10.1007/s00403-019-01972-3 · Cited by 243
Anti-inflammatory cytokines in endometriosis
Zhou, W., Yang, H., Shao, J., Mei, J., Chang, K., Zhu, R., & Li, M. (2019) · Cellular and Molecular Life Sciences · doi:10.1007/s00018-019-03056-x · Cited by 198
Hepatic macrophages: Key players in the development and progression of liver fibrosis
Cheng, D., Chai, J., Wang, H., Fu, L., Peng, S., & Ni, X. (2021) · Liver International · doi:10.1111/liv.14940 · Cited by 188
Mitophagy-dependent macrophage reprogramming protects against kidney fibrosis
Bhatia, D., Chung, K.-P., Nakahira, K., Patino, E., Rice, M. C., Torres, L. K., Muthukumar, T., Choi, A. M. K., Akchurin, O. M., & Choi, M. E. (2019) · JCI Insight · doi:10.1172/jci.insight.132826 · Cited by 185
IL-4 and IL-13: Regulators and Effectors of Wound Repair
Allen, J. E. (2023) · Annual Review of Immunology · doi:10.1146/annurev-immunol-101921-041206 · Cited by 158
Yang, A.-T., Kim, Y.-O., Yan, X.-Z., Abe, H., Aslam, M., Park, K.-S., Zhao, X.-Y., Jia, J.-D., Klein, T., You, H., et al. (2023) · Cellular and Molecular Gastroenterology and Hepatology · doi:10.1016/j.jcmgh.2022.12.005 · Cited by 144
Self-citationShan, L., Wang, F., Zhai, D., Meng, X., Liu, J., & Lv, X. (2023) · Biomedicine & Pharmacotherapy · doi:10.1016/j.biopha.2023.114472 · Cited by 140
The Roles of Immune Cells in the Pathogenesis of Fibrosis
Huang, E., Peng, N., Xiao, F., Hu, D., Wang, X., & Lu, L. (2020) · International Journal of Molecular Sciences · doi:10.3390/ijms21155203 · Cited by 138
Self-citationMacrophages in organ fibrosis: from pathogenesis to therapeutic targets
Jiang, Y., Cai, R., Huang, Y., Zhu, L., Xiao, L., Wang, C., & Wang, L. (2024) · Cell Death Discovery · doi:10.1038/s41420-024-02247-1 · Cited by 151
Combined obeticholic acid and apoptosis inhibitor treatment alleviates liver fibrosis
Zhou, J., Huang, N., Guo, Y., Cui, S., Ge, C., He, Q., Pan, X., Wang, G., Wang, H., & Hao, H. (2019) · Acta Pharmaceutica Sinica B · doi:10.1016/j.apsb.2018.11.004 · Cited by 99
Macrophage Phenotypes in Normal and Diabetic Wound Healing and Therapeutic Interventions
Sadoun, H. A. (2022) · Cells · doi:10.3390/cells11152430 · Cited by 96
Hallmarks of Aging in Macrophages: Consequences to Skin Inflammaging
Guimarães, G. R., Almeida, P. P., Santos, L. D. O., Rodrigues, L. P., Carvalho, J. L., & Boroni, M. (2021) · Cells · doi:10.3390/cells10061323 · Cited by 79
NAFLD and HBV interplay - related mechanisms underlying liver disease progression
Tourkochristou, E., Assimakopoulos, S. F., Thomopoulos, K., Marangos, M., & Triantos, C. (2022) · Frontiers in Immunology · doi:10.3389/fimmu.2022.965548 · Cited by 70
Macrophages in Systemic Sclerosis: Novel Insights and Therapeutic Implications
Toledo, D. M., & Pioli, P. A. (2019) · Current Rheumatology Reports · doi:10.1007/s11926-019-0831-z · Cited by 69
Jiao, B., An, C., Du, H., Tran, M., Wang, P., Zhou, D. F., & Wang, Y. (2021) · Cells · doi:10.3390/cells10113057 · Cited by 63
Sun, X., Zhou, L., Wang, Y., Deng, G., Cao, X., Ke, B., Wu, X., Gu, Y., Cheng, H., Xu, Q., et al. (2023) · Journal of Pharmaceutical Analysis · doi:10.1016/j.jpha.2023.04.013 · Cited by 66
Ikeno, Y., Ohara, D., Takeuchi, Y., Watanabe, H., Kondoh, G., Taura, K., Uemoto, S., & Hirota, K. (2020) · Frontiers in Immunology · doi:10.3389/fimmu.2020.584048 · Cited by 62
Guan, C., Xiao, Y., Li, K., Wang, T., Liang, Y., & Liao, G. (2019) · Experimental Cell Research · doi:10.1016/j.yexcr.2019.03.018 · Cited by 54
Song, Y., Li, L., Zhao, W., Qian, Y., Dong, L., Fang, Y., Yang, L., & Fan, Y. (2021) · Bioactive Materials · doi:10.1016/j.bioactmat.2021.02.020 · Cited by 54
Macrophages and platelets in liver fibrosis and hepatocellular carcinoma
Casari, M., Siegl, D., Deppermann, C., & Schuppan, D. (2023) · Frontiers in Immunology · doi:10.3389/fimmu.2023.1277808 · Cited by 55
Self-citationImmune Regulation of Metabolic Homeostasis by Helminths and Their Molecules
van der Zande, H. J. P., Zawistowska‐Deniziak, A., & Guigas, B. (2019) · Trends in Parasitology · doi:10.1016/j.pt.2019.07.014 · Cited by 49
Kaps, L., Leber, N., Klefenz, A., Choteschovsky, N., Zentel, R., Nuhn, L., & Schuppan, D. (2020) · Cells · doi:10.3390/cells9081905 · Cited by 49
Self-citationInterleukin-13 (IL-13)—A Pleiotropic Cytokine Involved in Wound Healing and Fibrosis
Roeb, E. (2023) · International Journal of Molecular Sciences · doi:10.3390/ijms241612884 · Cited by 45
Deletion of Protein Kinase D3 Promotes Liver Fibrosis in Mice
Zhang, S., Liu, H., Yin, M., Pei, X., Haußer, A., Ishikawa, E., Yamasaki, S., & Jin, Z. G. (2020) · Hepatology · doi:10.1002/hep.31176 · Cited by 41
Fraser, D. A., Wang, X., Lund, J., Nikolić, N., Iruarrizaga-Lejarreta, M., Skjaeret, T., Alonso, C., Kastelein, J. J. P., Rustan, A. C., Kim, Y. O., et al. (2022) · Journal of Hepatology · doi:10.1016/j.jhep.2021.12.004 · Cited by 41
Self-citationSabir, U., Gu, H., & Zhang, D. (2023) · Phytotherapy Research · doi:10.1002/ptr.7959 · Cited by 40
de Zawadzki, A., Leeming, D. J., Sanyal, A. J., Anstee, Q. M., Schattenberg, J. M., Friedman, S. L., Schuppan, D., & Karsdal, M. A. (2025) · Journal of Hepatology · doi:10.1016/j.jhep.2025.02.039 · Cited by 42
Self-citationConditional deletion of myeloid-specific mitofusin 2 but not mitofusin 1 promotes kidney fibrosis
Bhatia, D., Capili, A. M., Nakahira, K., Muthukumar, T., Torres, L. K., Choi, A. M. K., & Choi, M. E. (2022) · Kidney International · doi:10.1016/j.kint.2022.01.030 · Cited by 40
Kaps, L., Huppertsberg, A., Choteschovsky, N., Klefenz, A., Durak, F., Schrörs, B., Diken, M., Eichler, E., Rosigkeit, S., Schmitt, S., et al. (2022) · Proceedings of the National Academy of Sciences · doi:10.1073/pnas.2122310119 · Cited by 42
Self-citationLiu, B., Jiang, J., Liang, H., Xiao, P., Lai, X., Nie, J., Yu, W., Gao, Y., & Wen, S. (2021) · International Immunopharmacology · doi:10.1016/j.intimp.2021.107907 · Cited by 37
M2 macrophages mediate fibrotic scar formation in the early stages after cerebral ischemia in rats
Huang, J., Ren, J., Chen, Y., Tian, M., Zhou, L., Wen, J., Song, X., Wu, Y., Yang, Q., Jiang, P., et al. (2023) · Neural Regeneration Research · doi:10.4103/1673-5374.368299 · Cited by 35
Molecular dynamics of inflammation resolution: therapeutic implications
Soliman, A. M., Soliman, M. M., Shah, S. S. H., Baig, H. A., Gouda, N. S., Alenezi, B. T., Alenezy, A. K., Hegazy, A. M. S., Jan, M., & Abdalla, E. H. E. (2025) · Frontiers in Cell and Developmental Biology · doi:10.3389/fcell.2025.1600149 · Cited by 39
Endpoints in NASH Clinical Trials: Are We Blind in One Eye?
Lonardo, A., Ballestri, S., Mantovani, A., Targher, G., & Bril, F. (2024) · Metabolites · doi:10.3390/metabo14010040 · Cited by 34
The role of the interleukin family in liver fibrosis
Zhang, Z., Wang, J., Li, H., Niu, Q. F., Tao, Y., Zhao, X., Zeng, Z., & Dong, H. (2025) · Frontiers in Immunology · doi:10.3389/fimmu.2025.1497095 · Cited by 36
Bonnard, B., Ibarrola, J., Lima‐Posada, I., Fernández‐Celis, A., Durand, M., Genty, M., López‐Andrés, N., & Jaisser, F. (2021) · Hypertension · doi:10.1161/hypertensionaha.121.17712 · Cited by 32
Hasegawa, Y., Okamura, T., Ono, Y., Ichikawa, T., Saijo, Y., Nakanishi, N., Sasano, R., Hamaguchi, M., Takano, H., & Fukui, M. (2024) · Frontiers in Immunology · doi:10.3389/fimmu.2024.1407936 · Cited by 35
Macrophages and Stem Cells—Two to Tango for Tissue Repair?
Manole, E., Niculite, C. M., Lambrescu, I. M., Gaina, G. F., Ioghen, O. C., Ceafalan, L. C., & Hinescu, M. E. (2021) · Biomolecules · doi:10.3390/biom11050697 · Cited by 33
Insights on drug and gene delivery systems in liver fibrosis
Vyas, K., & Patel, M. M. (2023) · Asian Journal of Pharmaceutical Sciences · doi:10.1016/j.ajps.2023.100779 · Cited by 30
Shi, Y., Li, J., Chen, H., Hu, Y., Tang, L., Zhou, X., Tao, M., Lv, Z., Chen, S., Qiu, A., et al. (2022) · Frontiers in Immunology · doi:10.3389/fimmu.2022.899140 · Cited by 30
Critical Points on the Use of Biologicals in Allergic Diseases and Asthma
Agache, I. O., Cojanu, C., Laculiceanu, A. G., & Rogozea, L. M. (2019) · Allergy Asthma and Immunology Research · doi:10.4168/aair.2020.12.1.24 · Cited by 28
Makino, A., Shibata, T., Nagayasu, M., Hosoya, I., Nishimura, T., Nakano, C., Nagata, K., Ito, T., Takahashi, Y., & Nakamura, S. (2021) · iScience · doi:10.1016/j.isci.2021.103201 · Cited by 28
KLF10 promotes nonalcoholic steatohepatitis progression through transcriptional activation of zDHHC7
Yang, S., Jia, L., Xiang, J., Yang, G., Qiu, S., Kang, L., Zheng, P., Liang, Z., & Lü, Y. (2022) · EMBO Reports · doi:10.15252/embr.202154229 · Cited by 28
Metabolic Dysfunction-Associated Fatty Liver Disease and Chronic Viral Hepatitis: The Interlink
Fernandez, C. J., Alkhalifah, M. K., Afzar, H., & Pappachan, J. M. (2024) · Pathogens · doi:10.3390/pathogens13010068 · Cited by 29
IL-4R alpha deficiency influences hippocampal-BDNF signaling pathway to impair reference memory
Brombacher, T. M., Berkiks, I., Pillay, S., Scibiorek, M., Moses, B., & Brombacher, F. (2020) · Scientific Reports · doi:10.1038/s41598-020-73574-3 · Cited by 26
Self-citationCD206 + IL-4Rα + Macrophages Are Drivers of Adverse Cardiac Remodeling in Ischemic Cardiomyopathy
Wang, Q., Ismahil, M. A., Zhu, Y., Rokosh, G. D., Hamid, T., Zhou, G., Pogwizd, S. M., & Prabhu, S. D. (2025) · Circulation · doi:10.1161/circulationaha.124.072411 · Cited by 30
Wong, S., Ting, Y., Yong, Y.-K., Tan, H.-Y., Barathan, M., Riazalhosseini, B., Bee, C. J., Tee, K. K., Larsson, M., Velu, V., et al. (2021) · Scandinavian Journal of Clinical and Laboratory Investigation · doi:10.1080/00365513.2021.1876245 · Cited by 28
STAT3 determines IL-4 signalling outcomes in naïve T cells
Deimel, L. P., Li, Z., Roy, S. B., & Ranasinghe, C. (2021) · Scientific Reports · doi:10.1038/s41598-021-89860-7 · Cited by 22
Dupilumab in patients with chronic hepatitis B on concomitant entecavir
Ly, K., Smith, M. P., Thibodeaux, Q. G., Beck, K. M., Bhutani, T., & Liao, W. J. (2019) · JAAD Case Reports · doi:10.1016/j.jdcr.2019.05.007 · Cited by 22
Ameliorative effects of Schisandrin B on Schistosoma mansoni-induced hepatic fibrosis in vivo
Lam, H. Y. P., Liang, T.-R., & Peng, S.-Y. (2021) · PLoS neglected tropical diseases · doi:10.1371/journal.pntd.0009554 · Cited by 21
Xiang, Z., Guan, X., Ma, Z., Shi, Q., Panteleev, M. A., & Ataullakhanov, F. I. (2023) · Regenerative Biomaterials · doi:10.1093/rb/rbad010 · Cited by 24
Kim, A. D., Kim, S. E., Leszczynska, A., Kaufmann, B., Reca, A., Kim, D. J., & Feldstein, A. E. (2021) · Scientific Reports · doi:10.1038/s41598-021-03679-w · Cited by 19
Beyond M1/M2: The role of reactive oxygen species in liver fibrosis and immune modulation
Lu, H., Huang, J., Wang, Y.-C., Casals, E., Casals, G., & Zeng, M. (2025) · Redox Biology · doi:10.1016/j.redox.2025.103933 · Cited by 19
IL-4-induced SOX9 confers lineage plasticity to aged adult lung stem cells
Cai, X. T., Jia, M., Heigl, T., Shamir, E. R., Wong, A. K., Hall, B. M., Arlantico, A., Hung, J., Menon, H. G., Darmanis, S., et al. (2024) · Cell Reports · doi:10.1016/j.celrep.2024.114569 · Cited by 20
Antisense oligonucleotide is a promising intervention for liver diseases
Lu, K., Fan, Q., & Zou, X. (2022) · Frontiers in Pharmacology · doi:10.3389/fphar.2022.1061842 · Cited by 20
Zhang, W., Li, G., Gan, X.-Y., Huang, Z., He, R., Huang, H., Li, D., Tang, Y.-L., Tang, D., Zou, W., et al. (2023) · PeerJ · doi:10.7717/peerj.15598 · Cited by 18
Self-citationThe IL-4/IL-13 signaling axis promotes prostatic fibrosis
D’Arcy, Q., Gharaee‐Kermani, M., Zhilin-Roth, A., & Macoska, J. A. (2022) · PLoS ONE · doi:10.1371/journal.pone.0275064 · Cited by 19
Heterogeneous macrophages: Supersensors of exogenous inducing factors
Qian, C., Yun, Z., Yao, Y., Cao, M., Liu, Q., Hu, S., Zhang, S., & Luo, D. (2019) · Scandinavian Journal of Immunology · doi:10.1111/sji.12768 · Cited by 17
Duan, M., Yang, Y., Peng, S., Liu, X., Zhong, J., Guo, Y., Lu, M., Nie, H., Ren, B., Zhang, X., et al. (2019) · Journal of Immunology Research · doi:10.1155/2019/5148575 · Cited by 17
IGF2-NR4A2 Signaling Regulates Macrophage Subtypes to Attenuate Liver Cirrhosis
Yao, L., Hu, X., Yuan, M., Zhang, Q., Liu, P., Yang, L., Dai, K., & Jiang, Y. (2023) · Journal of Clinical and Translational Hepatology · doi:10.14218/jcth.2022.00392 · Cited by 15
Huang, J., Chen, Y., Zhou, L., Ren, J., Tian, M., Yang, Q., Wang, L., Wu, Y., Wen, J., & Yang, Q. (2024) · Neurochemistry International · doi:10.1016/j.neuint.2024.105674 · Cited by 16
Widowati, W., Sabrina, A. H. N., Sutendi, A. F., Zahiroh, F. H., Nurjamil, A. M., Wargasetia, T. L., Nainggolan, I. M., Azis, R., Rismani, E., & Vosough, M. (2026) · Journal of Immunology Research · doi:10.1155/jimr/2656395 · Cited by 17
Lipid nanoparticle formulations for targeting leukocytes with therapeutic RNA in liver fibrosis
Bartneck, M. (2021) · Advanced Drug Delivery Reviews · doi:10.1016/j.addr.2021.03.009 · Cited by 14
Attenuation of pulmonary injury by an inhaled MMP inhibitor in the endotoxin lung injury model
Gerber, A. M., Goldklang, M. P., Stearns, K. N., Ma, X., Xiao, R., Zelonina, T., & D'Armiento, J. M. (2020) · American Journal of Physiology-Lung Cellular and Molecular Physiology · doi:10.1152/ajplung.00420.2019 · Cited by 13
Interleukin in Immune-Mediated Diseases: An Updated Review
Zaroon, Z., Aslam, S., Hafsa, H., Mustafa, U., Fatima, S., & Bashir, H. (2024) · Molecular Biotechnology · doi:10.1007/s12033-024-01347-8 · Cited by 13
Xue, Y., Qian, K., Sun, Y.-C., Xiao, L., & Shi, X. (2021) · Experimental and Therapeutic Medicine · doi:10.3892/etm.2021.10395 · Cited by 13
Macrophage Polarization Related to Biomimetic Calcium Phosphate Coatings: A Preliminary Study
Chen, J., Zhou, Y., Lin, X., & Li, H. (2022) · Materials · doi:10.3390/ma16010332 · Cited by 13
Novel regulators of hepatic macrophages in liver fibrosis
Tang, X., Bai, M., Du, X., Wang, H., Liu, M., Fu, X., Zhang, H., Liang, S., & Wang, L. (2025) · Frontiers in Immunology · doi:10.3389/fimmu.2025.1705503 · Cited by 12
Icosabutate: targeting metabolic and inflammatory pathways for the treatment of NASH
Fraser, D. A., Harrison, S. A., & Schuppan, D. (2022) · Expert Opinion on Investigational Drugs · doi:10.1080/13543784.2022.2159804 · Cited by 11
Self-citationYi, G., Sun, W., Zhang, X., Wang, Z., Yu, X., Zhu, C., & Lin, K. (2025) · Free Radical Biology and Medicine · doi:10.1016/j.freeradbiomed.2025.07.053 · Cited by 10
ASIC1a inhibits cell pyroptosis induced by acid‐induced activation of rat hepatic stellate cells
Li, J., Kong, L., Huang, H., Luan, S., Jin, R., & Wu, F. (2020) · FEBS Open Bio · doi:10.1002/2211-5463.12850 · Cited by 10
Osteoprotegerin Expression in Liver is Induced by IL13 through TGFβ
Adhyatmika, A., Putri, K. S. S., Gore, E., Mangnus, K. A., Reker‐Smit, C., Schuppan, D., Beljaars, L., Olinga, P., & Melgert, B. N. (2022) · Cellular Physiology and Biochemistry · doi:10.33594/000000492 · Cited by 10
Self-citationYilmaz, K., Haeberle, S., Kim, Y. O., Fritzler, M. J., Weng, S., Goeppert, B. F., Raker, V., Steinbrink, K., Schuppan, D., Enk, A., et al. (2023) · Frontiers in Immunology · doi:10.3389/fimmu.2023.1253649 · Cited by 9
Self-citationTingting, Y., Xiaoling, Z., Zhang, Y., Luo, Y., Luo, Y., Xueqin, S., & Shikai, T. (2025) · Frontiers in Oncology · doi:10.3389/fonc.2025.1609889 · Cited by 9
Zhang, T., Xiang, Z., Liu, L., Ma, Z., Panteleev, M. A., Ataullakhanov, F. I., & Shi, Q. (2023) · Macromolecular Bioscience · doi:10.1002/mabi.202300036 · Cited by 9
Signaling networks in cancer stromal senescent cells establish malignant microenvironment
Zhang, Y., Wang, T.-W., Tamatani, M., Zeng, X., Nakamura, L., Omori, S., Yamaguchi, K., Hatakeyama, S., Shimizu, E., Yamazaki, S., et al. (2025) · Proceedings of the National Academy of Sciences · doi:10.1073/pnas.2412818122 · Cited by 8
van Galen, I., Birkisdóttir, M. B., Ozinga, R. A., Brandt, R. M. C., Barnhoorn, S., Imholz, S., van Oostrom, C. T., van der Marel, R. W. G. N., Smit, K., Rijksen, Y., et al. (2025) · npj Metabolic Health and Disease · doi:10.1038/s44324-025-00064-3 · Cited by 10
Immune microenvironment in autosomal dominant polycystic kidney disease
Xue, C., Li, X., Zhou, C., Mei, C., & Mao, Z. (2025) · Genes & Diseases · doi:10.1016/j.gendis.2025.101694 · Cited by 7
Yuan, Z., & Li, M. (2024) · Archives of Oral Biology · doi:10.1016/j.archoralbio.2024.106052 · Cited by 7
The role of liver macrophages in viral liver pathogenesis
Brantly, A., Yeakle, K., Bouchard, M. J., Gaskill, P. J., & Nonnemacher, M. R. (2025) · Journal of Leukocyte Biology · doi:10.1093/jleuko/qiaf088 · Cited by 7
EASL position paper on preclinical models of steatotic liver disease
Gallage, S., Castro, R. E., Estall, J. L., Tabas, I. A., Anstee, Q. M., TINIAKOS, D. G., Szabó, G., Yu, J., Desdouets, C., Tacke, F., et al. (2026) · Journal of Hepatology · doi:10.1016/j.jhep.2026.04.029 · Cited by 6
Live-cell imaging of human liver fibrosis using hepatic micro-organoids
Guan, Y., Fang, Z., Hu, A., Roberts, S., Wang, M., Ren, W., Johansson, P. K., Heilshorn, S. C., Enejder, A., & Peltz, G. (2025) · JCI Insight · doi:10.1172/jci.insight.187099 · Cited by 6
Hasegawa, Y., Okamura, T., Nakajima, H., Kitagawa, N., Majima, S., Okada, H., Senmaru, T., Ushigome, E., Nakanishi, N., Hamaguchi, M., et al. (2022) · Life Sciences · doi:10.1016/j.lfs.2023.121794 · Cited by 6
Restrepo, C. M., Llanes, A., Herrera, L., Ellis, E., Quintero, I., & Fernández, P. L. (2025) · Experimental Biology and Medicine · doi:10.3389/ebm.2024.10377 · Cited by 5
Okamori, S., Ishii, M., Asakura, T., Suzuki, S., Namkoong, H., Kagawa, S., Hegab, A. E., Yagi, K., Kamata, H., Kusumoto, T., et al. (2021) · American Journal of Physiology-Lung Cellular and Molecular Physiology · doi:10.1152/ajplung.00619.2020 · Cited by 4
Brennan, P. N., Kilpatrick, A. M., Glover, A., Campana, L., Turner, M., Elliott, A., Duncan, A., Lachlan, N. J., Dillon, J. F., Fallowfield, J. A., et al. (2026) · Cell stem cell · doi:10.1016/j.stem.2026.04.016 · Cited by 6
Shrivastava, S., Kottilil, S., Sherman, K. E., Masur, H., & Tang, L. (2021) · Viruses · doi:10.3390/v13102074 · Cited by 4
Song, P., Li, P., Huang, Z., Yuan, Y., Wei, M., Wang, C., Zhang, G., Ji, M. J., & Guan, H. (2023) · Translational Vision Science & Technology · doi:10.1167/tvst.12.11.23 · Cited by 3
The mechanism of IL‐13 targeting IL‐13Rα2 in regulating oral mucosal FBs through PI3K/AKT/mTOR
Wang, L., Cheng, J., Huang, J., Xiao, T., & Tang, Z. (2023) · Oral Diseases · doi:10.1111/odi.14760 · Cited by 3
Huang, H., Zhang, X., Chen, H., Shi, F., Zhang, C., Chen, R., Lin, Y., Ji, Q., & Ling, Q. (2021) · bioRxiv (Cold Spring Harbor Laboratory) · doi:10.1101/2021.01.06.425562 · Cited by 3
Interleukin-4-mediated Pro-Regenerative Cellular Reprogramming in 3-dimensional Liver Culture
Camat, D., Nakib, D., Chung, S., Sekhon, M., Liu, Y., Lumanto, P., Hyduk, S. J., Perciani, C. T., Bartczak, A. M., Cheng, M. L., et al. (2025) · Cellular and Molecular Gastroenterology and Hepatology · doi:10.1016/j.jcmgh.2025.101626 · Cited by 2
Wang, X., Wang, Y., Yang, M., Zhao, T., Feng, Z., Zhou, Y.-J., Li, X.-W., Yang, Y., Liu, Z.-Z., Zheng, G.-P., et al. (2025) · Frontiers in Bioscience · doi:10.31083/fbl42394 · Cited by 1
Self-citation
Metadata
- Authors
- Weng, S.-Y., Wang, X., Vijayan, S., Tang, Y., Kim, Y. O., Padberg, K., Regen, T., Molokanova, O., Chen, T., Bopp, T., Schild, H., Brombacher, F., Crosby, J. R., McCaleb, M. L., Waisman, A., Bockamp, E., & Schuppan, D.
- Affiliations
- Johannes Gutenberg University Mainz (DE)
- South African Medical Research Council (ZA)
- Ionis Pharmaceuticals (United States) (US)
- Beth Israel Deaconess Medical Center (US)
- Corresponding author
- Schuppan, Detlef
- ORCID
- Venue
- EBioMedicine
- Publisher
- Elsevier BV
- Published
- 2018-03
- Volume
- 29
- Pages
- 92-103
- ISSN
- 2352-3964 (ISSN-L)
- PMC
- PMC5925448
- OpenAlex
- W2790513179
- Cited by
- 128
- References
- 60
- Citations by year
- 2026: 14 · 2025: 18 · 2024: 11 · 2023: 18 · 2022: 17 · 2021: 21 · 2020: 9 · 2019: 15 · 2018: 4
- FWCI
- 7.68
- Type
- journal article
- Language
- en
- Open access
- gold
- doi.org
- Licence
- Locations
- EBioMedicine (publishedVersion, cc-by-nc-nd)
- Europe PMC (PubMed Central) (publishedVersion, cc-by-nc-nd)
- PubMed Central (publishedVersion, cc-by-nc-nd)
- PubMed (publishedVersion)
- Gutenberg Open Science (submittedVersion, cc-by-nc-nd)
- Digital Access to Scholarship at Harvard (DASH) (Harvard University) (submittedVersion, cc-by)
- DOAJ (DOAJ: Directory of Open Access Journals) (submittedVersion)
- Gutenberg Open Science
- Funders
- National Science Council
- European Commission
- European Research Council
- Topics
- Health Sciences › Medicine › Hepatology › Liver physiology and pathology
- Health Sciences › Medicine › Cardiology and Cardiovascular Medicine › Cardiac Fibrosis and Remodeling
- Health Sciences › Medicine › Hepatology › Liver Disease Diagnosis and Treatment
- Keywords
- IL-4 receptor alpha, liver fibrosis, macrophage polarization, M2 macrophages, fibrosis reversal, chronic hepatitis, STAT6 signaling, MMP-12, IL-13, IL-4, inflammatory monocytes, antisense oligonucleotides, liver cirrhosis
- MeSH terms
- RAW 264.7 Cells, Animals, Disease Models, Animal, Liver Cirrhosis, Macrophage Activation, Macrophages, Spleen, Signal Transduction, Gene Expression, T-Lymphocyte Subsets, Cytokines, Mice, Knockout, Disease Progression, Matrix Metalloproteinases, Myeloid Cells, STAT6 Transcription Factor, Mice, Interleukin-4 Receptor alpha Subunit, Non-alcoholic Fatty Liver Disease
About these checks
Registry, retraction, Cites and statistics results are computed, not judged, with one exception: a printed reference that no index lists is read once by a model before it counts as a citation error. Claims are extracted by a model and kept only when their quote appears verbatim in the text; each cited source is then checked, with a model’s help, for whether it says what the claim relies on. Those verdicts can be wrong — read the claim’s quote and the cited source before relying on one.
Statistics and arithmetic are recomputed, not judged.
Confidence bands are shown only for fields calibrated on our annotated test set. None is calibrated yet, so no band is shown.
What counts as a claim ›How we measure confidence ›How we check this ›
Are you an author, or do you see a problem with this page? Request a review
