Cited by 61

The DOI matches its Crossref record; 8 of the 8 references it cites were found in a registry or an index.

Fluoride induced leaky gut and bloom of Erysipelatoclostridium ramosum mediate the exacerbation of obesity in high-fat-diet fed mice

Chen, Guijie, Peng, Yujia, Huang, Yujie, Xie, Minhao, Dai, Zhuqing, Cai, Huimei, Dong, Wei, Xu, Weiqi, Xie, Zhiyong, Chen, Dan, Fan, Xia, Zhou, Wangting, Kan, Xuhui, Yang, Tingting, Chen, Chunxu, Sun, Yi, Zeng, Xiaoxiong, Liu, Zhonghua·2023·Journal of Advanced Research

Overview

The claims and statistics of this paper haven’t been checked yet.

Run the check — free, no account needed. It reads the open-access text and checks the sources it cites.

A few free checks a day · papers already verified open instantly · results are public

Integrity signals

Registry

Crossref · 10.1016/j.jare.2022.10.010

Cites

8 of 8 references verified0 citation errors · 0 not checkable

Statistics

Figures

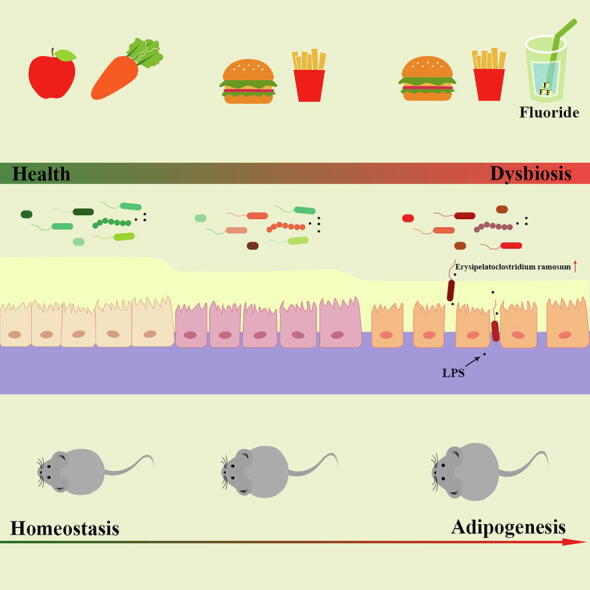
Graphical abstract
Graphical abstract CC BY-NC-ND · PubMed Central
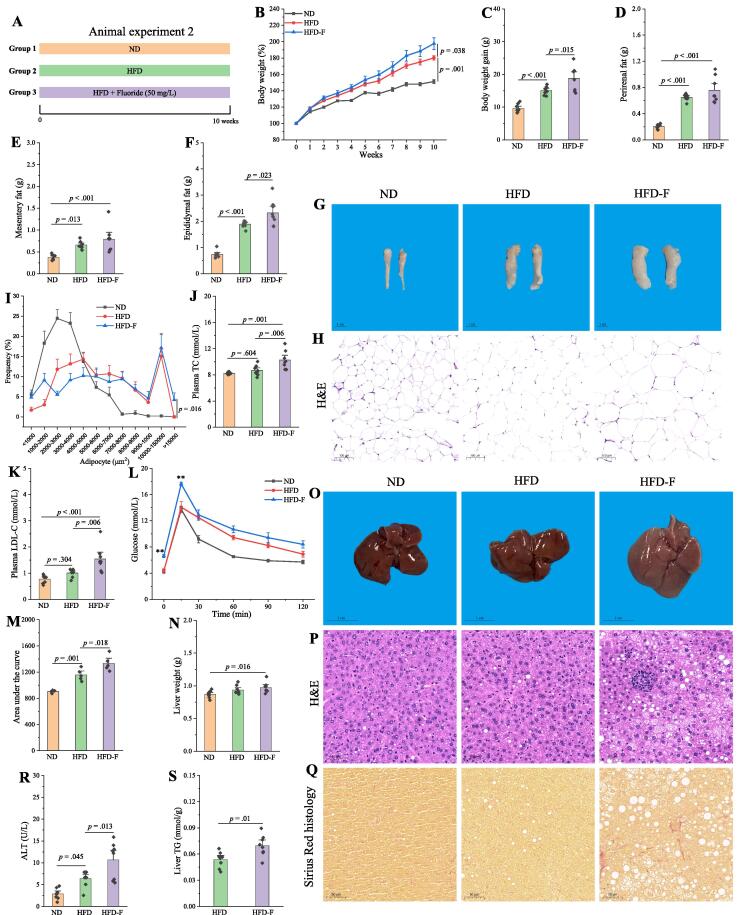
Fig. 1 Fluoride exacerbates the obesity in HFD mice. (A) Scheme of animal experiment 2 over the 10 weeks of dietary intervention. Mice were randomly divided into three groups including ND group, HFD group, and HFD plus 50 mg/L of fluoride in drinking water (HFD-F) group (n = 8). (B) Dynamic changes in body weight in mice. (C) Body weight gain. (D) Perirenal fat. (E) Mesentery fat. (F) Epididymal fat. (G-H) Representative morphology and H&E staining of Epididymal fat. (I) Adipocytes (μm2) distribution in the epididymal fat tissue. (J-K) Plasma levels of TC and LDL-C. (L) OGTT carried out at week 9, mice were fasted overnight and gavaged with a dosage of glucose with 1.5 mg/g body weight (n = 5 per group). (M) AUC for OGTT. (N) Liver weight. (O-Q) Representative morphology, H&E staining and Sirius Red histology of liver. (R) Plasma ALT. (S) Liver TG. The results were expressed as means ± SEM. Statistical significance was carried out by one-way analysis of variance (ANOVA) with Tukey test for multiple-group comparisons. Difference in two groups was calculated using the Mann-Whitney test or Kruskal-Wallis test. A value of p < 0.05 was considered to be significant. (For interpretation of the references to colour in this figure legend, the reader is referred to the web version of this article.)
Fig. 1 Fluoride exacerbates the obesity in HFD mice. (A) Scheme of animal experiment 2 over the 10 weeks of dietary intervention. Mice were randomly divided into three groups including ND group, HFD group, and HFD plus 50 mg/L of fluoride in drinking water (HFD-F) group (n = 8). (B) Dynamic changes in body weight in mice. (C) Body weight gain. (D) Perirenal fat. (E) Mesentery fat. (F) Epididymal fat. (G-H) Representative morphology and H&E staining of Epididymal fat. (I) Adipocytes (μm2) distribution in the epididymal fat tissue. (J-K) Plasma levels of TC and LDL-C. (L) OGTT carried out at week 9, mice were fasted overnight and gavaged with a dosage of glucose with 1.5 mg/g body weight (n = 5 per group). (M) AUC for OGTT. (N) Liver weight. (O-Q) Representative morphology, H&E staining and Sirius Red histology of liver. (R) Plasma ALT. (S) Liver TG. The results were expressed as means ± SEM. Statistical significance was carried out by one-way analysis of variance (ANOVA) with Tukey test for multiple-group comparisons. Difference in two groups was calculated using the Mann-Whitney test or Kruskal-Wallis test. A value of p < 0.05 was considered to be significant. (For interpretation of the references to colour in this figure legend, the reader is referred to the web version of this article.)CC BY-NC-ND · PubMed Central
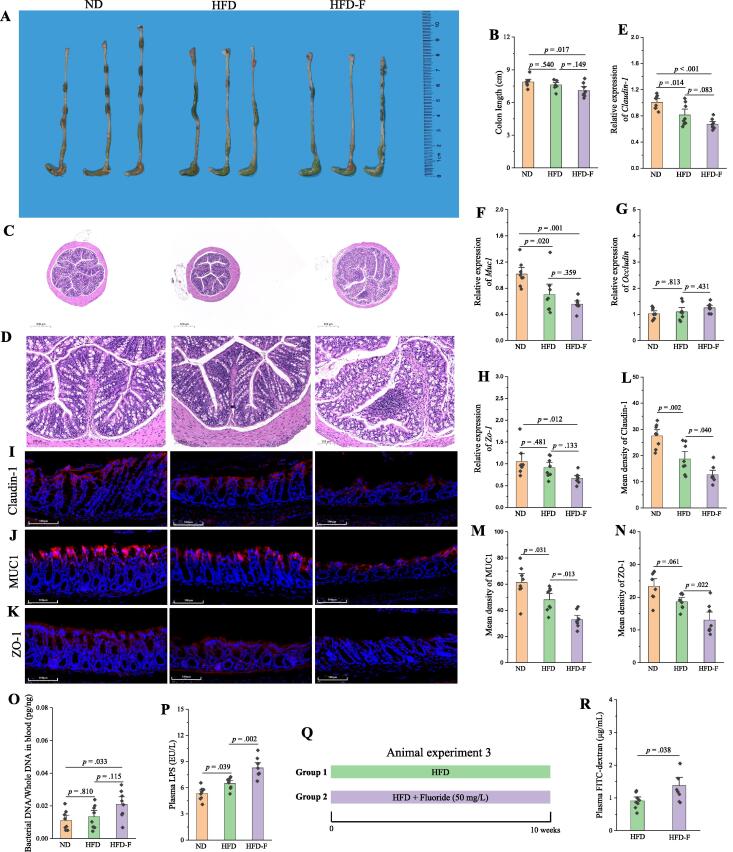
Fig. 2 Fluoride drives the intestinal barrier permeability in HFD mice. (A) Representative morphology of colon. (B) Colon length (n = 8). (C-D) Representative H&E staining of colon (10 × and 40 ×, respectively). (E-H) Relative mRNA expression levels of Claudin-1, Muc1, Occludin and Zo-1 in colon (n = 8). (I-K) Representative immunofluorescence images of Claudin-1, MUC1 and ZO-1 in colon, 40 ×, scale bar = 100 μm. (L-N) Mean density of Claudin-1, MUC1 and ZO-1 in immunofluorescence images was evaluated by ImageJ software (n = 8). (O) Bacterial DNA/Whole DNA in blood was measured by RT-qPCR (n = 8). (P) Plasma LPS. (Q) Scheme of animal experiment 3. (R) Plasma FITC-dextran from mice in animal experiment 3 was measured after 4 h of intragastric administration of FITC-dextran (n = 8). The results were expressed as means ± SEM. Statistical significance was carried out by one-way ANOVA with Tukey test for multiple-group comparisons. Difference in two groups was calculated using the Mann-Whitney test or Kruskal-Wallis test. A value of p < 0.05 was considered to be significant.
Fig. 2 Fluoride drives the intestinal barrier permeability in HFD mice. (A) Representative morphology of colon. (B) Colon length (n = 8). (C-D) Representative H&E staining of colon (10 × and 40 ×, respectively). (E-H) Relative mRNA expression levels of Claudin-1, Muc1, Occludin and Zo-1 in colon (n = 8). (I-K) Representative immunofluorescence images of Claudin-1, MUC1 and ZO-1 in colon, 40 ×, scale bar = 100 μm. (L-N) Mean density of Claudin-1, MUC1 and ZO-1 in immunofluorescence images was evaluated by ImageJ software (n = 8). (O) Bacterial DNA/Whole DNA in blood was measured by RT-qPCR (n = 8). (P) Plasma LPS. (Q) Scheme of animal experiment 3. (R) Plasma FITC-dextran from mice in animal experiment 3 was measured after 4 h of intragastric administration of FITC-dextran (n = 8). The results were expressed as means ± SEM. Statistical significance was carried out by one-way ANOVA with Tukey test for multiple-group comparisons. Difference in two groups was calculated using the Mann-Whitney test or Kruskal-Wallis test. A value of p < 0.05 was considered to be significant.CC BY-NC-ND · PubMed Central
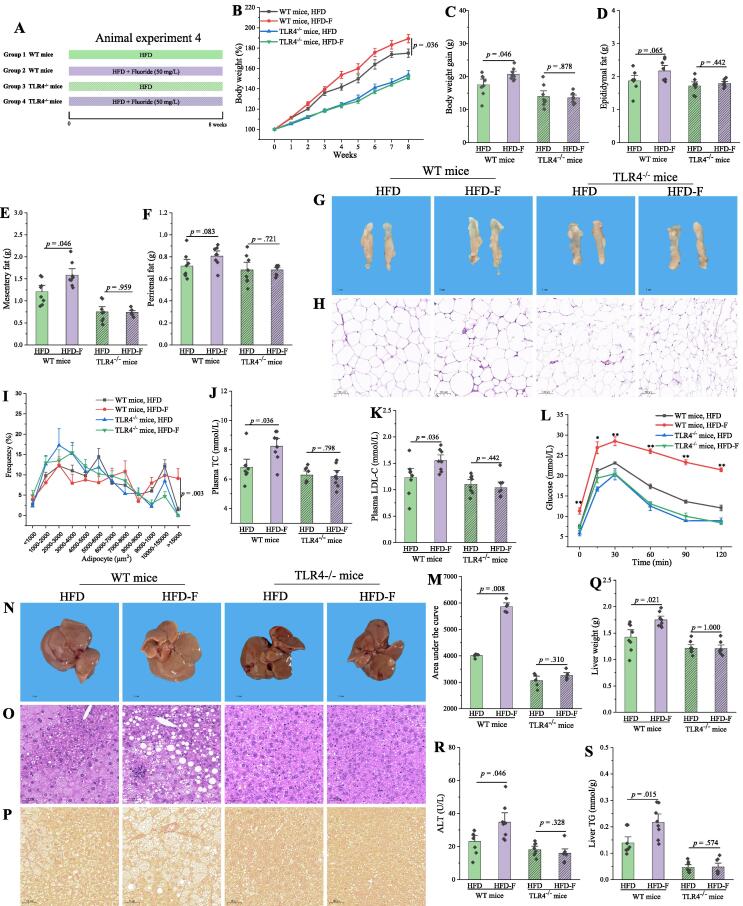
Fig. 3 Fluoride exacerbates the obesity in HFD mice through a TLR4-dependent mechanism. (A) Scheme of animal experiment 4 over the 8 weeks of dietary intervention. Wild-type (WT) mice and Tlr4 knockout (Tlr4−/−) mice were randomly divided into two groups, respectively, including HFD group, and HFD-F groups (n = 8 per group). (B) Dynamic changes in body weight in mice. (C) Body weight gain. (D) Epididymal fat. (E) Mesentery fat. (F) Perirenal fat. (G-H) Representative morphology and H&E staining of Epididymal fat. (I)Adipocytes (μm2) distribution in the Epididymal fat tissue. (J-K) Plasma levels of TC and LDL-C. (L) OGTT was carried out at week 7, mice were fasted overnight and gavaged with a dosage of glucose with 1.5 mg/g body weight (n = 5 per group). (M) AUC for OGTT. (N-P) Representative morphology, H&E staining and Sirius Red histology of liver. (Q) Liver weight. (R) Plasma ALT. (S) Liver TG. The results were expressed as means ± SEM. Difference in two groups was calculated using the Mann-Whitney test or Kruskal-Wallis test. A value of p < 0.05 was considered to be significant. (For interpretation of the references to colour in this figure legend, the reader is referred to the web version of this article.)
Fig. 3 Fluoride exacerbates the obesity in HFD mice through a TLR4-dependent mechanism. (A) Scheme of animal experiment 4 over the 8 weeks of dietary intervention. Wild-type (WT) mice and Tlr4 knockout (Tlr4−/−) mice were randomly divided into two groups, respectively, including HFD group, and HFD-F groups (n = 8 per group). (B) Dynamic changes in body weight in mice. (C) Body weight gain. (D) Epididymal fat. (E) Mesentery fat. (F) Perirenal fat. (G-H) Representative morphology and H&E staining of Epididymal fat. (I)Adipocytes (μm2) distribution in the Epididymal fat tissue. (J-K) Plasma levels of TC and LDL-C. (L) OGTT was carried out at week 7, mice were fasted overnight and gavaged with a dosage of glucose with 1.5 mg/g body weight (n = 5 per group). (M) AUC for OGTT. (N-P) Representative morphology, H&E staining and Sirius Red histology of liver. (Q) Liver weight. (R) Plasma ALT. (S) Liver TG. The results were expressed as means ± SEM. Difference in two groups was calculated using the Mann-Whitney test or Kruskal-Wallis test. A value of p < 0.05 was considered to be significant. (For interpretation of the references to colour in this figure legend, the reader is referred to the web version of this article.)CC BY-NC-ND · PubMed Central
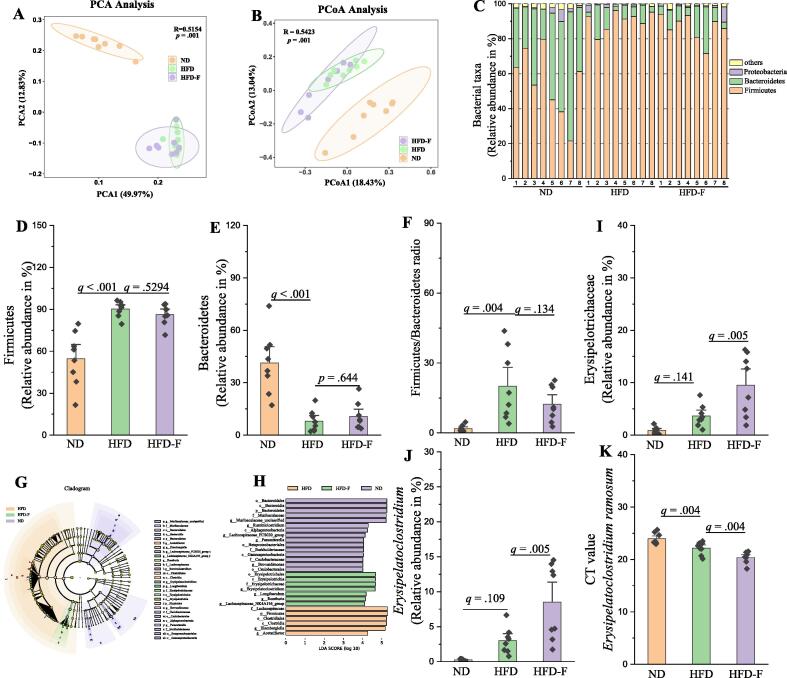
Fig. 4 Fluoride disturbs the gut microbiota in HFD mice. Gut microbiota was analyzed by 16S rRNA gene sequencing (n = 8 for each group). (A) PCA based on the relative abundance of Features of the gut microbiota, (B) PCoA of the gut microbiota based on the unweighted unifrac distance matrix, (C) Bacterial taxonomic profiling at the phylum level of gut microbiota, the relative abundances of (D) Firmicutes, (E) Bacteroidetes, and (F) the ratio of Firmicutes to Bacteroidetes. (G-H) LEfSe analyses of gut microbiota (value of Kruskal-Wallis: 0.01, value of Wilcoxon: 0.01, value of LDA score: 4). the relative abundances of (I) Erysipelotrichaceae, and (J)Erysipelatoclostridium, (K) Level of E. ramosum in fecal samples measured by RT-qPCR using species-specific primers. Higher CT values suggest lower levels of E. ramosum. The results were expressed as means ± SEM. Statistical significance was carried out by one-way ANOVA with Tukey test. Adjusted p-values (q-values) were used to evaluate differences in analysis of gut microbiota based on false discovery rate (FDR) for multiple testing according to the Benjamini and Hochberg procedure. A value of p or q < 0.05 was considered to be significant.A value of p < 0.05 was considered to be significant.
Fig. 4 Fluoride disturbs the gut microbiota in HFD mice. Gut microbiota was analyzed by 16S rRNA gene sequencing (n = 8 for each group). (A) PCA based on the relative abundance of Features of the gut microbiota, (B) PCoA of the gut microbiota based on the unweighted unifrac distance matrix, (C) Bacterial taxonomic profiling at the phylum level of gut microbiota, the relative abundances of (D) Firmicutes, (E) Bacteroidetes, and (F) the ratio of Firmicutes to Bacteroidetes. (G-H) LEfSe analyses of gut microbiota (value of Kruskal-Wallis: 0.01, value of Wilcoxon: 0.01, value of LDA score: 4). the relative abundances of (I) Erysipelotrichaceae, and (J)Erysipelatoclostridium, (K) Level of E. ramosum in fecal samples measured by RT-qPCR using species-specific primers. Higher CT values suggest lower levels of E. ramosum. The results were expressed as means ± SEM. Statistical significance was carried out by one-way ANOVA with Tukey test. Adjusted p-values (q-values) were used to evaluate differences in analysis of gut microbiota based on false discovery rate (FDR) for multiple testing according to the Benjamini and Hochberg procedure. A value of p or q < 0.05 was considered to be significant.A value of p < 0.05 was considered to be significant.CC BY-NC-ND · PubMed Central
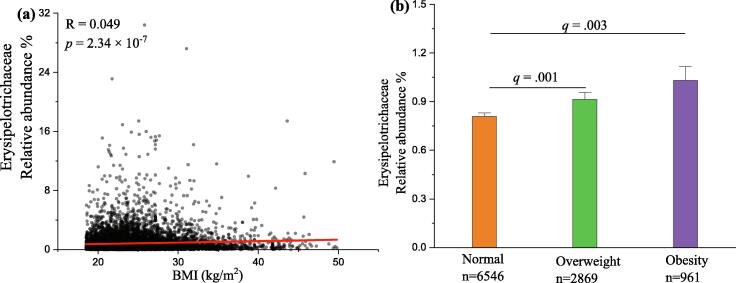
Fig. 5 The association between Erysipelotrichaceae and BMI based on the database of American Gut Project (AGP). (A) Spearman correlation between the relative abundance of Erysipelotrichaceae and BMI (n = 10376). (B) The relative abundance of Erysipelotrichaceae in three BMI categories, namely Normal (18.5 ≤ BMI < 25, n = 6546), Overweight (25 ≤ BMI < 30, n = 2869), and Obesity (BMI ≥ 30, n = 961). The results were expressed as means ± SEM. Statistical significance was carried out by the nonparametric Mann–Whitney test. Adjusted p-values (q-values) were used to evaluate differences in analysis of gut microbiota based on false discovery rate (FDR) for multiple testing according to the Benjamini and Hochberg procedure. A value of q < 0.05 was considered to be significant.
Fig. 5 The association between Erysipelotrichaceae and BMI based on the database of American Gut Project (AGP). (A) Spearman correlation between the relative abundance of Erysipelotrichaceae and BMI (n = 10376). (B) The relative abundance of Erysipelotrichaceae in three BMI categories, namely Normal (18.5 ≤ BMI < 25, n = 6546), Overweight (25 ≤ BMI < 30, n = 2869), and Obesity (BMI ≥ 30, n = 961). The results were expressed as means ± SEM. Statistical significance was carried out by the nonparametric Mann–Whitney test. Adjusted p-values (q-values) were used to evaluate differences in analysis of gut microbiota based on false discovery rate (FDR) for multiple testing according to the Benjamini and Hochberg procedure. A value of q < 0.05 was considered to be significant.CC BY-NC-ND · PubMed Central
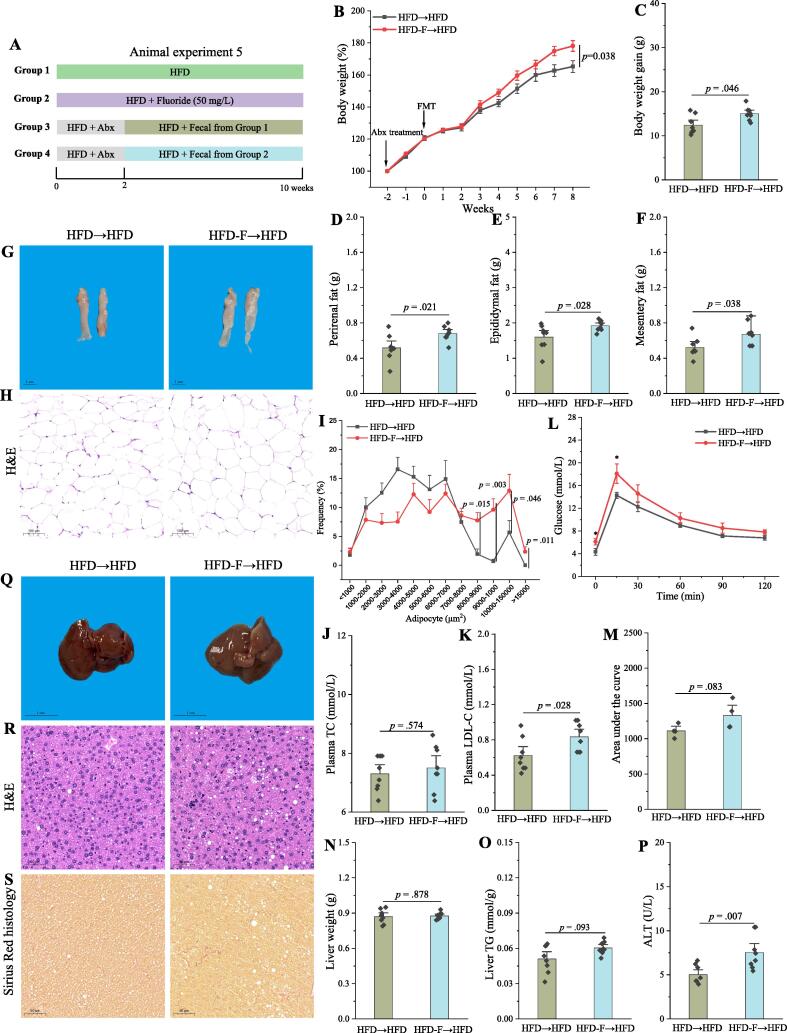
Fig. 6 FMT is sufficient to induce some phenotypical changes caused by fluoride in a HFD context. (A) Scheme of animal experiment 5 over the 10 weeks. Pseudo-germfree mice, induced by Abx for two weeks, were colonized by fecal slurry from either HFD group or HFD-F group mice (n = 8) for 8 weeks. (B) Dynamic changes in body weight in mice. (C) Body weight gain. (D) Perirenal fat. (E) Epididymal fat. (F) Mesentery fat. (G-H) Representative morphology and H&E staining of Epididymal fat. (I) Adipocytes (μm2) distribution in the Epididymal fat tissue. (J-K) Plasma levels of TC and LDL-C. (L) OGTT was carried out at week 9, mice were fasted overnight and gavaged with a dosage of glucose with 1.5 mg/g body weight (n = 4 per group). (M) AUC for OGTT. (N) Liver weight. (O) Liver TG. (P) Plasma ALT. (Q-S) Representative morphology, H&E staining and Sirius Red histology of liver. The results were expressed as means ± SEM. Difference in two groups was calculated using the Mann-Whitney test or Kruskal-Wallis test. A value of p < 0.05 was considered to be significant. (For interpretation of the references to colour in this figure legend, the reader is referred to the web version of this article.)
Fig. 6 FMT is sufficient to induce some phenotypical changes caused by fluoride in a HFD context. (A) Scheme of animal experiment 5 over the 10 weeks. Pseudo-germfree mice, induced by Abx for two weeks, were colonized by fecal slurry from either HFD group or HFD-F group mice (n = 8) for 8 weeks. (B) Dynamic changes in body weight in mice. (C) Body weight gain. (D) Perirenal fat. (E) Epididymal fat. (F) Mesentery fat. (G-H) Representative morphology and H&E staining of Epididymal fat. (I) Adipocytes (μm2) distribution in the Epididymal fat tissue. (J-K) Plasma levels of TC and LDL-C. (L) OGTT was carried out at week 9, mice were fasted overnight and gavaged with a dosage of glucose with 1.5 mg/g body weight (n = 4 per group). (M) AUC for OGTT. (N) Liver weight. (O) Liver TG. (P) Plasma ALT. (Q-S) Representative morphology, H&E staining and Sirius Red histology of liver. The results were expressed as means ± SEM. Difference in two groups was calculated using the Mann-Whitney test or Kruskal-Wallis test. A value of p < 0.05 was considered to be significant. (For interpretation of the references to colour in this figure legend, the reader is referred to the web version of this article.)CC BY-NC-ND · PubMed Central
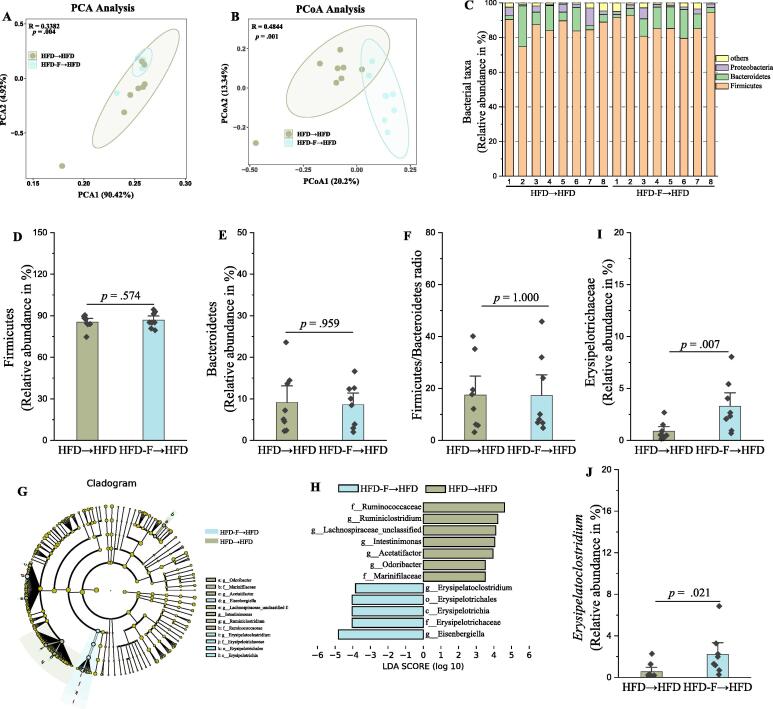
Fig. 7 The fluoride-induced key gut microbiota could colonize in pseudo-germfree mice by FMT. Gut microbiota was analyzed by 16S rRNA gene sequencing (n = 8 for each group). (A) PCA based on the relative abundance of Features of the gut microbiota, (B) PCoA of the gut microbiota based on the unweighted unifrac distance matrix, (C) Bacterial taxonomic profiling at the phylum level of gut microbiota, the relative abundances of (D) Firmicutes, (E) Bacteroidetes, and (F) the ratio of Firmicutes to Bacteroidetes. (G-H) LEfSe analyses of gut microbiota (value of Kruskal-Wallis: 0.05, value of Wilcoxon: 0.05, value of LDA score: 3.5). the relative abundances of (I) Erysipelotrichaceae, and (J)Erysipelatoclostridium. The results were expressed as means ± SEM. Difference in two groups was calculated using the Mann-Whitney test or Kruskal-Wallis test. A value of p < 0.05 was considered to be significant.
Fig. 7 The fluoride-induced key gut microbiota could colonize in pseudo-germfree mice by FMT. Gut microbiota was analyzed by 16S rRNA gene sequencing (n = 8 for each group). (A) PCA based on the relative abundance of Features of the gut microbiota, (B) PCoA of the gut microbiota based on the unweighted unifrac distance matrix, (C) Bacterial taxonomic profiling at the phylum level of gut microbiota, the relative abundances of (D) Firmicutes, (E) Bacteroidetes, and (F) the ratio of Firmicutes to Bacteroidetes. (G-H) LEfSe analyses of gut microbiota (value of Kruskal-Wallis: 0.05, value of Wilcoxon: 0.05, value of LDA score: 3.5). the relative abundances of (I) Erysipelotrichaceae, and (J)Erysipelatoclostridium. The results were expressed as means ± SEM. Difference in two groups was calculated using the Mann-Whitney test or Kruskal-Wallis test. A value of p < 0.05 was considered to be significant.CC BY-NC-ND · PubMed Central
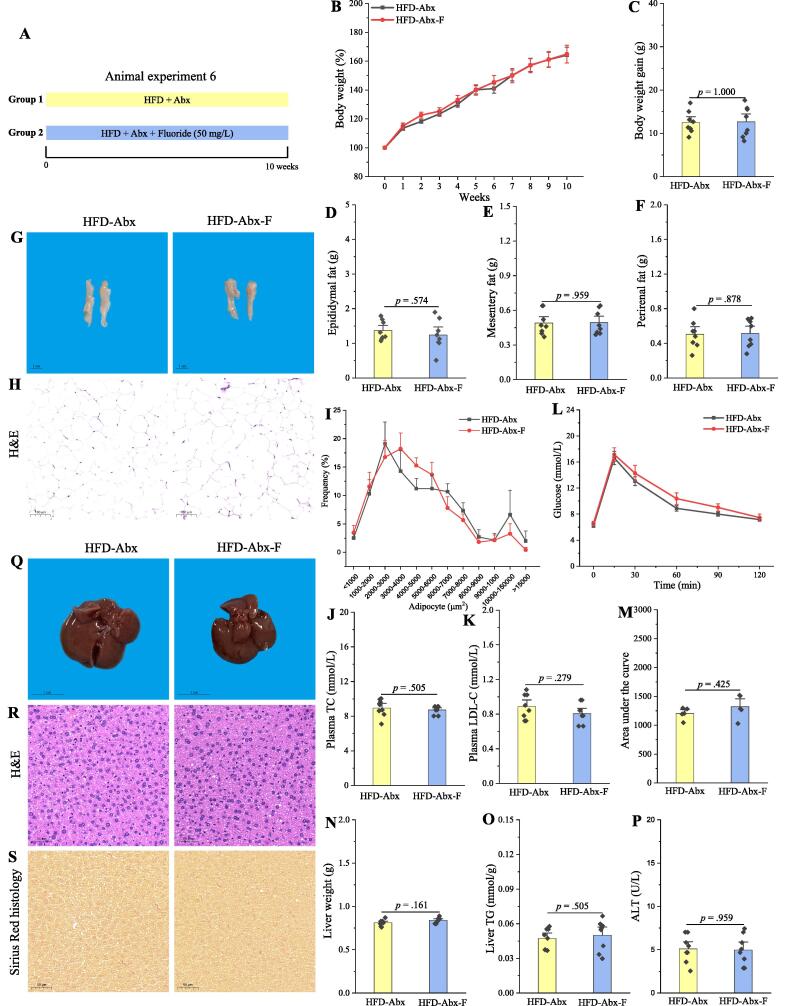
Fig. 8 The exacerbation of the obesity by fluoride is blocked after depletion of the gut microbiota by Abx. (A) Scheme of animal experiment 6 over the 10 weeks. Mice were randomly divided into two groups including HFD fed with Abx (HFD-Abx) group, and HFD fed with Abx plus 50 mg/L of fluoride in drinking water (HFD-Abx-F) group (n = 8 per group). Abx was fed by intragastric gavage. (B) Dynamic changes in body weight in mice. (C) Body weight gain. (D) Epididymal fat. (E) Mesentery fat. (F) Perirenal fat. (G-H) Representative morphology and H&E staining of Epididymal fat. (I) Adipocytes (μm2) distribution in the Epididymal fat tissue. (J-K) Plasma levels of TC and LDL-C. (L) OGTT was carried out at week 9, mice were fasted overnight and gavaged with a dosage of glucose with 1.5 mg/g body weight (n = 5 per group). (M) AUC for OGTT. (N) Liver weight. (O) Liver TG. (P) Plasma ALT. (Q-S) Representative morphology, H&E staining and Sirius Red histology of liver. The results were expressed as means ± SEM. Difference in two groups was calculated using the Mann-Whitney test or Kruskal-Wallis test. A value of p < 0.05 was considered to be significant. (For interpretation of the references to colour in this figure legend, the reader is referred to the web version of this article.)
Fig. 8 The exacerbation of the obesity by fluoride is blocked after depletion of the gut microbiota by Abx. (A) Scheme of animal experiment 6 over the 10 weeks. Mice were randomly divided into two groups including HFD fed with Abx (HFD-Abx) group, and HFD fed with Abx plus 50 mg/L of fluoride in drinking water (HFD-Abx-F) group (n = 8 per group). Abx was fed by intragastric gavage. (B) Dynamic changes in body weight in mice. (C) Body weight gain. (D) Epididymal fat. (E) Mesentery fat. (F) Perirenal fat. (G-H) Representative morphology and H&E staining of Epididymal fat. (I) Adipocytes (μm2) distribution in the Epididymal fat tissue. (J-K) Plasma levels of TC and LDL-C. (L) OGTT was carried out at week 9, mice were fasted overnight and gavaged with a dosage of glucose with 1.5 mg/g body weight (n = 5 per group). (M) AUC for OGTT. (N) Liver weight. (O) Liver TG. (P) Plasma ALT. (Q-S) Representative morphology, H&E staining and Sirius Red histology of liver. The results were expressed as means ± SEM. Difference in two groups was calculated using the Mann-Whitney test or Kruskal-Wallis test. A value of p < 0.05 was considered to be significant. (For interpretation of the references to colour in this figure legend, the reader is referred to the web version of this article.)CC BY-NC-ND · PubMed Central
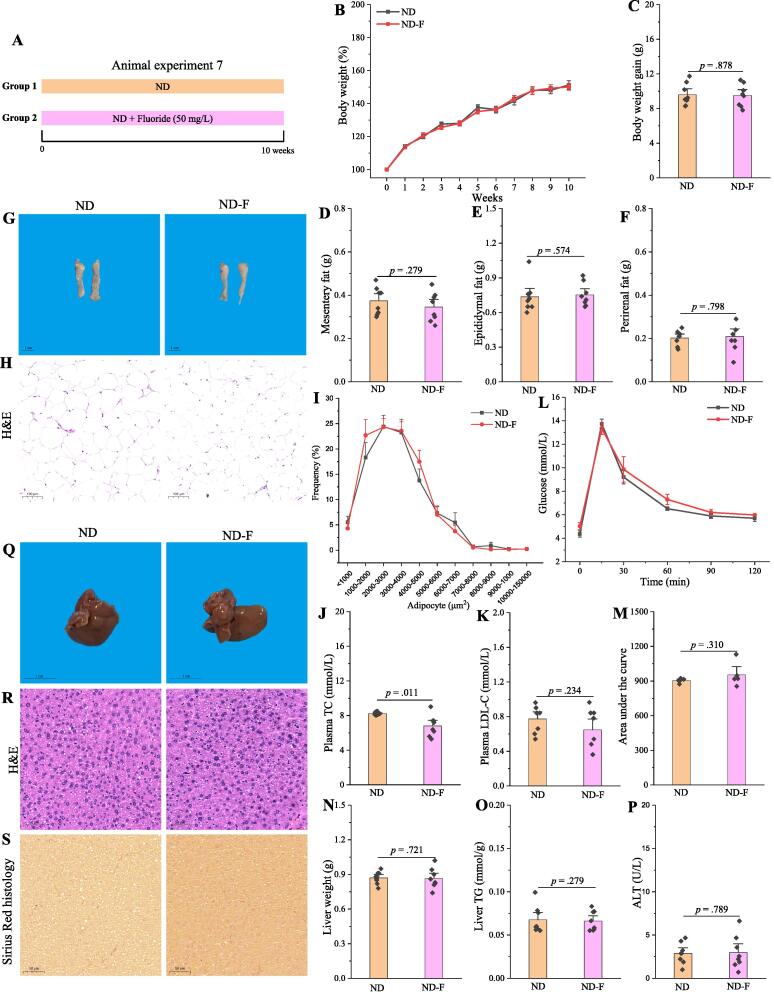
Fig. 9 Fluoride fails to induce the obesity in ND mice. (A) Scheme of animal experiment 7 over the 10 weeks of dietary intervention. Mice were randomly divided into two groups including ND group, and ND plus 50 mg/L of fluoride in drinking water (ND-F) group (n = 8 per group). (B) Dynamic changes in body weight in mice. (C) Body weight gain. (D) Mesentery fat. (E) Epididymal fat. (F) Perirenal fat. (G-H) Representative morphology and H&E staining of Epididymal fat. (I) Adipocytes (μm2) distribution in the Epididymal fat tissue. (J-K) Plasma levels of TC and LDL-C. (L) OGTT was carried out at week 9, mice were fasted overnight and gavaged with a dosage of glucose with 1.5 mg/g body weight (n = 5 per group). (M) Area under the curve (AUC) for OGTT. (N) Liver weight. (O) Liver TG. (P) Plasma ALT. (Q-S) Representative morphology, H&E staining and Sirius Red histology of liver. The results were expressed as means ± SEM. Difference in two groups was calculated using the Mann-Whitney test or Kruskal-Wallis test. A value of p < 0.05 was considered to be significant. (For interpretation of the references to colour in this figure legend, the reader is referred to the web version of this article.)
Fig. 9 Fluoride fails to induce the obesity in ND mice. (A) Scheme of animal experiment 7 over the 10 weeks of dietary intervention. Mice were randomly divided into two groups including ND group, and ND plus 50 mg/L of fluoride in drinking water (ND-F) group (n = 8 per group). (B) Dynamic changes in body weight in mice. (C) Body weight gain. (D) Mesentery fat. (E) Epididymal fat. (F) Perirenal fat. (G-H) Representative morphology and H&E staining of Epididymal fat. (I) Adipocytes (μm2) distribution in the Epididymal fat tissue. (J-K) Plasma levels of TC and LDL-C. (L) OGTT was carried out at week 9, mice were fasted overnight and gavaged with a dosage of glucose with 1.5 mg/g body weight (n = 5 per group). (M) Area under the curve (AUC) for OGTT. (N) Liver weight. (O) Liver TG. (P) Plasma ALT. (Q-S) Representative morphology, H&E staining and Sirius Red histology of liver. The results were expressed as means ± SEM. Difference in two groups was calculated using the Mann-Whitney test or Kruskal-Wallis test. A value of p < 0.05 was considered to be significant. (For interpretation of the references to colour in this figure legend, the reader is referred to the web version of this article.)CC BY-NC-ND · PubMed Central
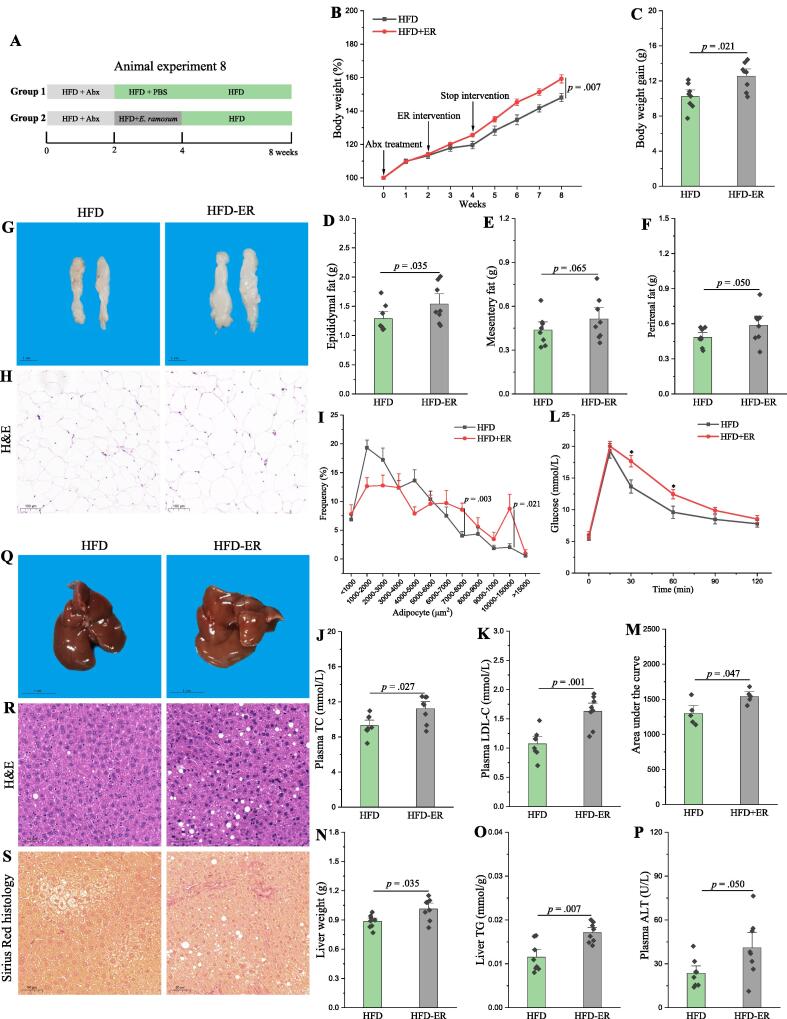
Fig. 10 E. ramosum aggravates the obesity in HFD mice. (A) Scheme of animal experiment 8 over the 8 weeks. Pseudo-germfree mice were obtained by treatment of Abx for two weeks. Then, pseudo-germfree mice were randomly divided into two groups including HFD fed with PBS and HFD fed with E. ramosum (HFD-ER) by intragastric gavage for two weeks. (B) Dynamic changes in body weight in mice. (C) Body weight gain. (D) Epididymal fat. (E) Mesentery fat. (F) Perirenal fat. (G-H) Representative morphology and H&E staining of Epididymal fat. (I) Adipocytes (μm2) distribution in the Epididymal fat tissue. (J-K) Plasma levels of TC and LDL-C. (L) OGTT was carried out at week 7, mice were fasted overnight and gavaged with a dosage of glucose with 1.5 mg/g body weight (n = 5 per group). (M) AUC for OGTT. (N) Liver weight. (O) Liver TG. (P) Plasma ALT. (Q-S) Representative morphology, H&E staining and Sirius Red histology of liver. The results were expressed as means ± SEM. Difference in two groups was calculated using the Mann-Whitney test or Kruskal-Wallis test. A value of p < 0.05 was considered to be significant. (For interpretation of the references to colour in this figure legend, the reader is referred to the web version of this article.)
Fig. 10 E. ramosum aggravates the obesity in HFD mice. (A) Scheme of animal experiment 8 over the 8 weeks. Pseudo-germfree mice were obtained by treatment of Abx for two weeks. Then, pseudo-germfree mice were randomly divided into two groups including HFD fed with PBS and HFD fed with E. ramosum (HFD-ER) by intragastric gavage for two weeks. (B) Dynamic changes in body weight in mice. (C) Body weight gain. (D) Epididymal fat. (E) Mesentery fat. (F) Perirenal fat. (G-H) Representative morphology and H&E staining of Epididymal fat. (I) Adipocytes (μm2) distribution in the Epididymal fat tissue. (J-K) Plasma levels of TC and LDL-C. (L) OGTT was carried out at week 7, mice were fasted overnight and gavaged with a dosage of glucose with 1.5 mg/g body weight (n = 5 per group). (M) AUC for OGTT. (N) Liver weight. (O) Liver TG. (P) Plasma ALT. (Q-S) Representative morphology, H&E staining and Sirius Red histology of liver. The results were expressed as means ± SEM. Difference in two groups was calculated using the Mann-Whitney test or Kruskal-Wallis test. A value of p < 0.05 was considered to be significant. (For interpretation of the references to colour in this figure legend, the reader is referred to the web version of this article.)CC BY-NC-ND · PubMed Central

Verification

Claims the paper makes

The claims and statistics of this paper haven’t been checked yet.

Run the check — free, no account needed. It reads the open-access text and checks the sources it cites.

A few free checks a day · papers already verified open instantly · results are public

Claims other papers make about this one

Each is checked against this paper’s own text: does it say what the citing paper says it does?

Self-check

Percentages, sums and reported differences re-computed from the paper’s own numbers.

The self-check needs the paper’s full text.

Citations

Cites

Research works printed but not linked: 72

  1. Chen, 2018, Kudingcha and fuzhuan brick tea prevent obesity and modulate gut microbiota in High-Fat diet fed mice, Mol Nutr Food Res, 62, 1700485, 10.1002/mnfr.201700485 · DOI
  2. Choi, 2021, Feeding diversified protein sources exacerbates hepatic insulin resistance via increased gut microbial branched-chain fatty acids and mTORC1 signaling in obese mice, Nat Commun, 12, 10.1038/s41467-021-23782-w · DOI
  3. Du, 2021, Dietary betaine prevents obesity through gut microbiota-drived microRNA-378a family, Gut Microbes, 13, 10.1080/19490976.2020.1862612 · DOI
  4. López-Almela, 2021, Bacteroides uniformis combined with fiber amplifies metabolic and immune benefits in obese mice, Gut Microbes, 13, 1, 10.1080/19490976.2020.1865706 · DOI
  5. Pan, 2021, Epidemiology and determinants of obesity in China, Lancet Diabetes Endocrinol, 9, 373, 10.1016/S2213-8587(21)00045-0 · DOI
  6. Rosenbaum, 2015, The gut microbiota in human energy homeostasis and obesity, Trends Endocrinol Metab, 26, 493, 10.1016/j.tem.2015.07.002 · DOI · Paper page
  7. Canfora, 2019, Gut microbial metabolites in obesity, NAFLD and T2DM, Nat Rev Endocrinol, 15, 261, 10.1038/s41574-019-0156-z · DOI · Paper page
  8. Gimeno, 2020, Leveraging the gut to treat metabolic disease, Cell Metab, 31, 679, 10.1016/j.cmet.2020.02.014 · DOI
  9. Zeng, 2020, Citrus polymethoxyflavones attenuate metabolic syndrome by regulating gut microbiome and amino acid metabolism, Sci Adv, 6, 10.1126/sciadv.aax6208 · DOI
  10. Zhao, 2020, Modulation of the Gut Microbiota during High-Dose Glycerol Monolaurate-Mediated Amelioration of Obesity in Mice Fed a High-Fat Diet, mBio, 11, 10.1128/mBio.00190-20 · DOI
  11. Gao, 2020, Correlations between α-Linolenic Acid-Improved Multitissue Homeostasis and Gut Microbiota in Mice Fed a High-Fat Diet, mSystems, 5, 10.1128/mSystems.00391-20 · DOI
  12. Xiao, 2017, High-fat feeding rather than obesity drives taxonomical and functional changes in the gut microbiota in mice, Microbiome, 5, 10.1186/s40168-017-0258-6 · DOI
  13. Zhang, 2021, Dietary cholesterol drives fatty liver-associated liver cancer by modulating gut microbiota and metabolites, Gut, 70, 761, 10.1136/gutjnl-2019-319664 · DOI · Paper page
  14. Chang, 2015, Ganoderma lucidum reduces obesity in mice by modulating the composition of the gut microbiota, Nat Commun, 6, 10.1038/ncomms8489 · DOI
  15. Fabbiano, 2018, Functional gut microbiota remodeling contributes to the caloric Restriction-Induced metabolic improvements, Cell Metab, 28, 907, 10.1016/j.cmet.2018.08.005 · DOI
  16. He, 2021, Food colorants metabolized by commensal bacteria promote colitis in mice with dysregulated expression of interleukin-23, Cell Metab, 33, 1358, 10.1016/j.cmet.2021.04.015 · DOI
  17. Ayoob, 2006, Fluoride in drinking water: A review on the status and stress effects, Crit Rev Environ Sci Technol, 36, 433, 10.1080/10643380600678112 · DOI
  18. Guth, 2020, Toxicity of fluoride: Critical evaluation of evidence for human developmental neurotoxicity in epidemiological studies, animal experiments and in vitro analyses, Arch Toxicol, 94, 1375, 10.1007/s00204-020-02725-2 · DOI
  19. Kabir, 2020, Fluoride and human health: Systematic appraisal of sources, exposures, metabolism, and toxicity, Crit Rev Environ Sci Technol, 50, 1116, 10.1080/10643389.2019.1647028 · DOI · Paper page
  20. Jagtap, 2012, Fluoride in drinking water and defluoridation of water, Chem Rev, 112, 2454, 10.1021/cr2002855 · DOI
  21. Rizzu, 2021, Impacts of soil and water fluoride contamination on the safety and productivity of food and feed crops: A systematic review, Sci Total Environ, 787, 10.1016/j.scitotenv.2021.147650 · DOI
  22. Peng, 2016, Analysis of naturally occurring fluoride in commercial teas and estimation of its daily intake through tea consumption, J Food Sci, 81, H235, 10.1111/1750-3841.13180 · DOI
  23. Johnston, 2020, Principles of fluoride toxicity and the cellular response: A review, Arch Toxicol, 94, 1051, 10.1007/s00204-020-02687-5 · DOI · Paper page
  24. Liu, 2019, Low-to-moderate fluoride exposure in relation to overweight and obesity among school-age children in China, Ecotox Environ Safe, 183, 109558, 10.1016/j.ecoenv.2019.109558 · DOI
  25. Pereira, 2016, Fluoride intensifies hypercaloric Diet-Induced ER oxidative stress and alters lipid metabolism, PLoS ONE, 11, e0158121, 10.1371/journal.pone.0158121 · DOI
  26. Yu, 2022, Estrogen deficiency aggravates Fluoride-Induced liver damage and lipid metabolism disorder in rats, Biol Trace Elem Res, 200, 2767, 10.1007/s12011-021-02857-1 · DOI
  27. Dionizio, 2019, Effect of duration of exposure to fluoride and type of diet on lipid parameters and de novo lipogenesis, Biol Trace Elem Res, 190, 157, 10.1007/s12011-018-1542-4 · DOI
  28. Yang, 2018, A common antimicrobial additive increases colonic inflammation and colitis-associated colon tumorigenesis in mice, Sci Transl Med, 10, 10.1126/scitranslmed.aan4116 · DOI
  29. Rizvi, 2021, High-salt diet mediates interplay between NK cells and gut microbiota to induce potent tumor immunity, Sci Adv, 7, 10.1126/sciadv.abg5016 · DOI
  30. Wang, 2019, Ochratoxin a induces liver inflammation: Involvement of intestinal microbiota, Microbiome, 7, 10.1186/s40168-019-0761-z · DOI
  31. Jensen, 2021, Lysates of Methylococcus capsulatus Bath induce a lean-like microbiota, intestinal FoxP3+RORγt+IL-17+ Tregs and improve metabolism, Nat Commun, 12, 10.1038/s41467-021-21408-9 · DOI
  32. Liu, 2021, Gut microbiome alterations in high-fat-diet-fed mice are associated with antibiotic tolerance, Nat Microbiol, 6, 874, 10.1038/s41564-021-00912-0 · DOI
  33. Peng, 2020, Tea components influencing bioavailability of fluoride and potential transport mechanism in the Caco-2 cell line model, Int J Food Sci Technol, 55, 1792, 10.1111/ijfs.14466 · DOI
  34. Wu, 2019, Gut commensal Parabacteroides goldsteinii Plays a predominant role in the anti-obesity effects of polysaccharides isolated from Hirsutella sinensis, Gut, 68, 248, 10.1136/gutjnl-2017-315458 · DOI
  35. Gu, 2019, Γ-Mangostin ameliorates free fatty Acid-Induced lipid accumulation via the SIRT1/LKB1/AMPK pathway in HepG2 and l02 cells, J Agr Food Chem, 67, 13929, 10.1021/acs.jafc.9b05632 · DOI
  36. Jiang, 2020, Hepatocyte-derived extracellular vesicles promote endothelial inflammation and atherogenesis via microRNA-1, J Hepatol, 72, 156, 10.1016/j.jhep.2019.09.014 · DOI
  37. Chen, 2018, Fuzhuan brick tea polysaccharides attenuate metabolic syndrome in High-Fat diet induced mice in association with modulation in the gut microbiota, J Agr Food Chem, 66, 2783, 10.1021/acs.jafc.8b00296 · DOI
  38. Peng, 2019, Gut microbiota modulation and anti-inflammatory properties of anthocyanins from the fruits of Lycium ruthenicum Murray in dextran sodium sulfate-induced colitis in mice, Free Radical Bio Med, 136, 96, 10.1016/j.freeradbiomed.2019.04.005 · DOI
  39. Jensen, 2021, Isoflavone diet ameliorates experimental autoimmune encephalomyelitis through modulation of gut bacteria depleted in patients with multiple sclerosis, Sci Adv, 7, 10.1126/sciadv.abd4595 · DOI
  40. Fujimoto, 2019, Antigen-Specific mucosal immunity regulates development of intestinal Bacteria-Mediated diseases, Gastroenterology, 157, 1530, 10.1053/j.gastro.2019.08.021 · DOI
  41. Rodrigues, 2021, Transkingdom interactions between Lactobacilli and hepatic mitochondria attenuate western diet-induced diabetes, Nat Commun, 12, 10.1038/s41467-020-20313-x · DOI
  42. Liu, 2021, A practical guide to amplicon and metagenomic analysis of microbiome data, Protein Cell, 12, 315, 10.1007/s13238-020-00724-8 · DOI
  43. Camilleri, 2019, Leaky gut: Mechanisms, measurement and clinical implications in humans, Gut, 68, 1516, 10.1136/gutjnl-2019-318427 · DOI · Paper page
  44. Chen, 2021, The beneficial or detrimental fluoride to gut microbiota depends on its dosages, Ecotox Environ Safe, 209, 111732, 10.1016/j.ecoenv.2020.111732 · DOI
  45. Qiu, 2020, Gut microbiota perturbations and neurodevelopmental impacts in offspring rats concurrently exposure to inorganic arsenic and fluoride, Environ Int, 140, 105763, 10.1016/j.envint.2020.105763 · DOI
  46. Giles, 2019, The future of faecal transplants, Nat Rev Microbiol, 17, 719, 10.1038/s41579-019-0271-9 · DOI
  47. Yutin, 2013, A genomic update on clostridial phylogeny: Gram-negative spore formers and other misplaced clostridia, Environ Microbiol, 15, 2631, 10.1111/1462-2920.12173 · DOI
  48. Cunningham, 2021, Shaping the future of probiotics and prebiotics, Trends Microbiol, 29, 667, 10.1016/j.tim.2021.01.003 · DOI · Paper page
  49. Sanders, 2019, Probiotics and prebiotics in intestinal health and disease: From biology to the clinic, Nat Rev Gastro Hepat, 16, 605, 10.1038/s41575-019-0173-3 · DOI · Paper page
  50. Xi, 2019, Flavor augmentations affect fluoride bioavailability from brewed dark tea, LWT-Food, Sci Technol, 109, 270
  51. Ouyang, 2021, Exposure to Fluoride induces apoptosis in liver of ducks by regulating Cyt-C/Caspase 3/9 signaling pathway, Ecotox Environ Safe, 224, 112662, 10.1016/j.ecoenv.2021.112662 · DOI
  52. García-Montalvo, 2009, Fluoride exposure impairs glucose tolerance via decreased insulin expression and oxidative stress, Toxicology, 263, 75, 10.1016/j.tox.2009.06.008 · DOI
  53. Lobo, 2015, Low-Level fluoride exposure increases insulin sensitivity in experimental diabetes, J Dent Res, 94, 990, 10.1177/0022034515581186 · DOI
  54. Cao, 2020, Foodborne titanium dioxide nanoparticles induce stronger adverse effects in obese mice than Non-Obese mice: Gut microbiota dysbiosis, colonic inflammation, and proteome alterations, Small, 16, 2001858, 10.1002/smll.202001858 · DOI
  55. De Munck, 2020, Intestinal permeability in human nonalcoholic fatty liver disease: A systematic review and meta-analysis, Liver Int, 40, 2906, 10.1111/liv.14696 · DOI · Paper page
  56. Chopyk, 2020, Contribution of the intestinal microbiome and gut barrier to hepatic disorders, Gastroenterology, 159, 849, 10.1053/j.gastro.2020.04.077 · DOI
  57. Paone, 2020, Mucus barrier, mucins and gut microbiota: The expected slimy partners?, Gut, 69, 2232, 10.1136/gutjnl-2020-322260 · DOI
  58. Cho, 2021, Fructose promotes leaky gut, endotoxemia, and liver fibrosis through Ethanol-Inducible cytochrome P450–2E1–mediated oxidative and nitrative stress, Hepatology, 73, 2180, 10.1002/hep.30652 · DOI
  59. Amadeu de Oliveira, 2018, The effect of fluoride on the structure, function, and proteome of intestinal epithelia, Environ Toxicol, 33, 63, 10.1002/tox.22495 · DOI
  60. Miao, 2020, Alterations in cecal microbiota and intestinal barrier function of laying hens fed on fluoride supplemented diets, Ecotox Environ Safe, 193, 110372, 10.1016/j.ecoenv.2020.110372 · DOI · Paper page
  61. Yan, 2021, Co-exposure to inorganic arsenic and fluoride prominently disrupts gut microbiota equilibrium and induces adverse cardiovascular effects in offspring rats, Sci Total Environ, 767, 144924, 10.1016/j.scitotenv.2020.144924 · DOI
  62. Ziętak, 2016, Altered microbiota contributes to reduced Diet-Induced obesity upon cold exposure, Cell Metab, 23, 1216, 10.1016/j.cmet.2016.05.001 · DOI
  63. Kaakoush, 2015, Insights into the Role of Erysipelotrichaceae in the Human Host, Front Cell Infect Mi, 5, 84
  64. Yasuda, 2017, Fluoride depletes acidogenic taxa in oral but not gut microbial communities in mice, mSystems, 2, 10.1128/mSystems.00047-17 · DOI
  65. Roager, 2019, Whole grain-rich diet reduces body weight and systemic low-grade inflammation without inducing major changes of the gut microbiome: A randomised cross-over trial, Gut, 68, 83, 10.1136/gutjnl-2017-314786 · DOI
  66. Aron-Wisnewsky, 2019, Major microbiota dysbiosis in severe obesity: Fate after bariatric surgery, Gut, 68, 70, 10.1136/gutjnl-2018-316103 · DOI · Paper page
  67. Woting, 2014, Clostridium ramosum Promotes High-Fat Diet-Induced Obesity in Gnotobiotic Mouse Models, mBio, 5, 10.1128/mBio.01530-14 · DOI
  68. Zuo, 2020, Alterations in gut microbiota of patients with COVID-19 during time of hospitalization, Gastroenterology, 159, 944, 10.1053/j.gastro.2020.05.048 · DOI · Paper page
  69. Wu, 2021, Identification of microbial markers across populations in early detection of colorectal cancer, Nat Commun, 12
  70. Verspreet, 2016, A critical look at prebiotics within the dietary fiber concept, Annu Rev Food Sci T, 7, 167, 10.1146/annurev-food-081315-032749 · DOI
  71. Makki, 2018, The impact of dietary fiber on gut microbiota in host health and disease, Cell Host Microbe, 23, 705, 10.1016/j.chom.2018.05.012 · DOI · Paper page
  72. Umarani, 2015, Rutin potentially attenuates fluoride-induced oxidative stress-mediated cardiotoxicity, blood toxicity and dyslipidemia in rats, Toxicol Mech Method, 25, 143, 10.3109/15376516.2014.1003359 · DOI

Cited by

Sorted by citations

See all 61

Metadata

Authors
Chen, G., Peng, Y., Huang, Y., Xie, M., Dai, Z., Cai, H., Dong, W., Xu, W., Xie, Z., Chen, D., Fan, X., Zhou, W., Kan, X., Yang, T., Chen, C., Sun, Y., Zeng, X., & Liu, Z.
Venue
Journal of Advanced Research
Publisher
Elsevier BV
Published
2023-08
Volume
50
Pages
35-54
ISSN
2090-1232
Cited by
61
References
8
Language
en
Funders
  • Priority Academic Program Development of Jiangsu Higher Education Institutions
  • Jiangsu Provincial Key Research and Development Program (BE2020341)
  • National Key Research and Development Program of China (2018YFC1604404)
  • Fundamental Research Funds for the Central Universities (KJQN202154)

About these checks

Registry, retraction, Cites and statistics results are computed, not judged, with one exception: a printed reference that no index lists is read once by a model before it counts as a citation error. Claims are extracted by a model and kept only when their quote appears verbatim in the text; each cited source is then checked, with a model’s help, for whether it says what the claim relies on. Those verdicts can be wrong — read the claim’s quote and the cited source before relying on one.

Statistics and arithmetic are recomputed, not judged.

Confidence bands are shown only for fields calibrated on our annotated test set. None is calibrated yet, so no band is shown.

What counts as a claim ›How we measure confidence ›How we check this ›

Are you an author, or do you see a problem with this page? Request a review