

The DOI matches its Crossref record; 5 of the 5 references it cites were found in a registry or an index.
Human Plastins are Novel Cytoskeletal pH Sensors with a Reduced F-actin Bundling Capacity at Basic pH
Open accessPublished version of a preprint
Abstract
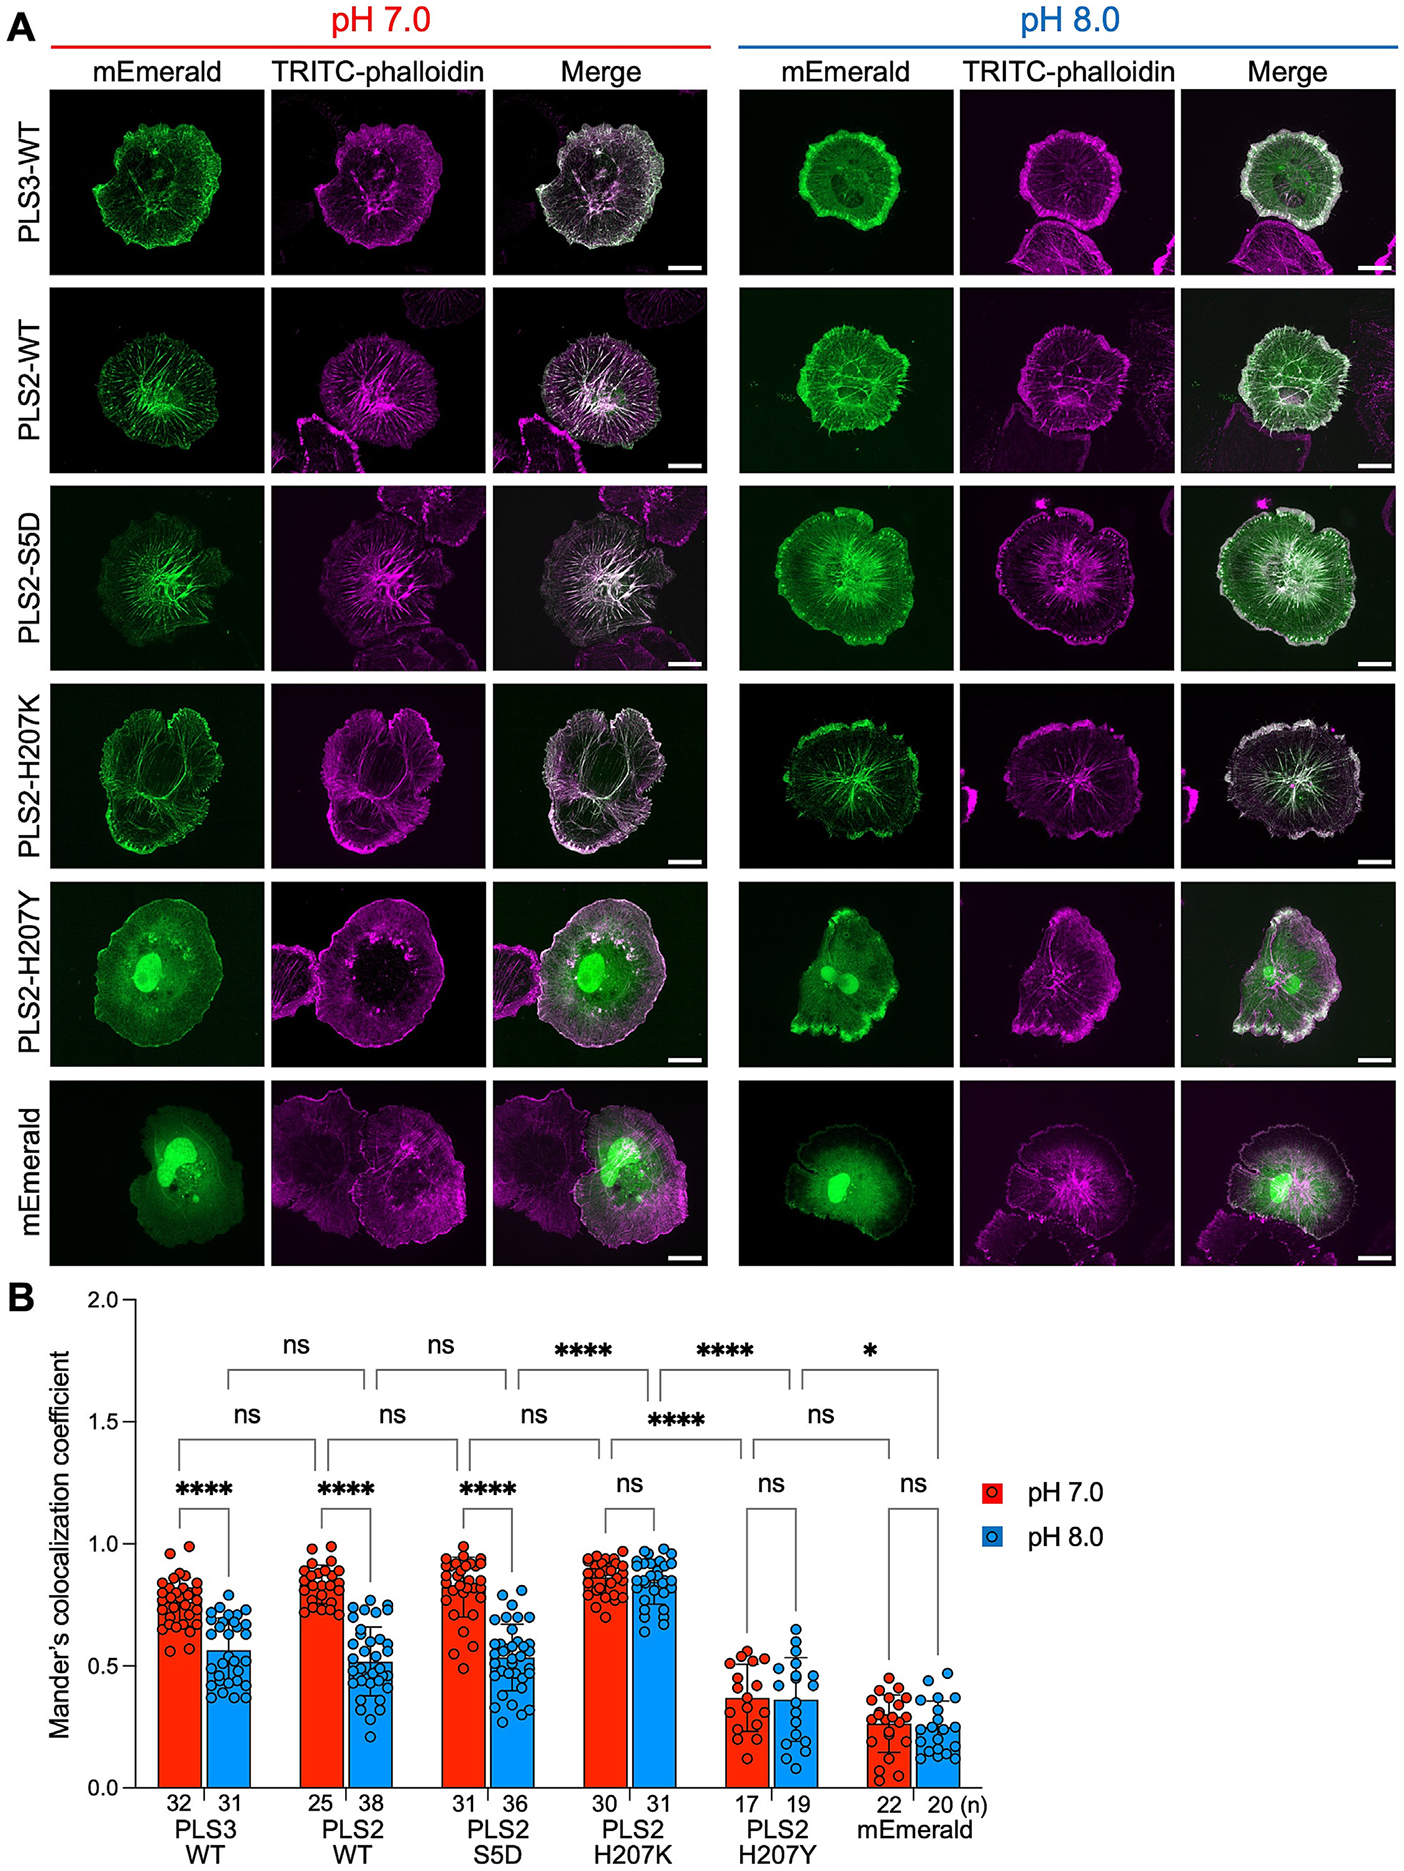
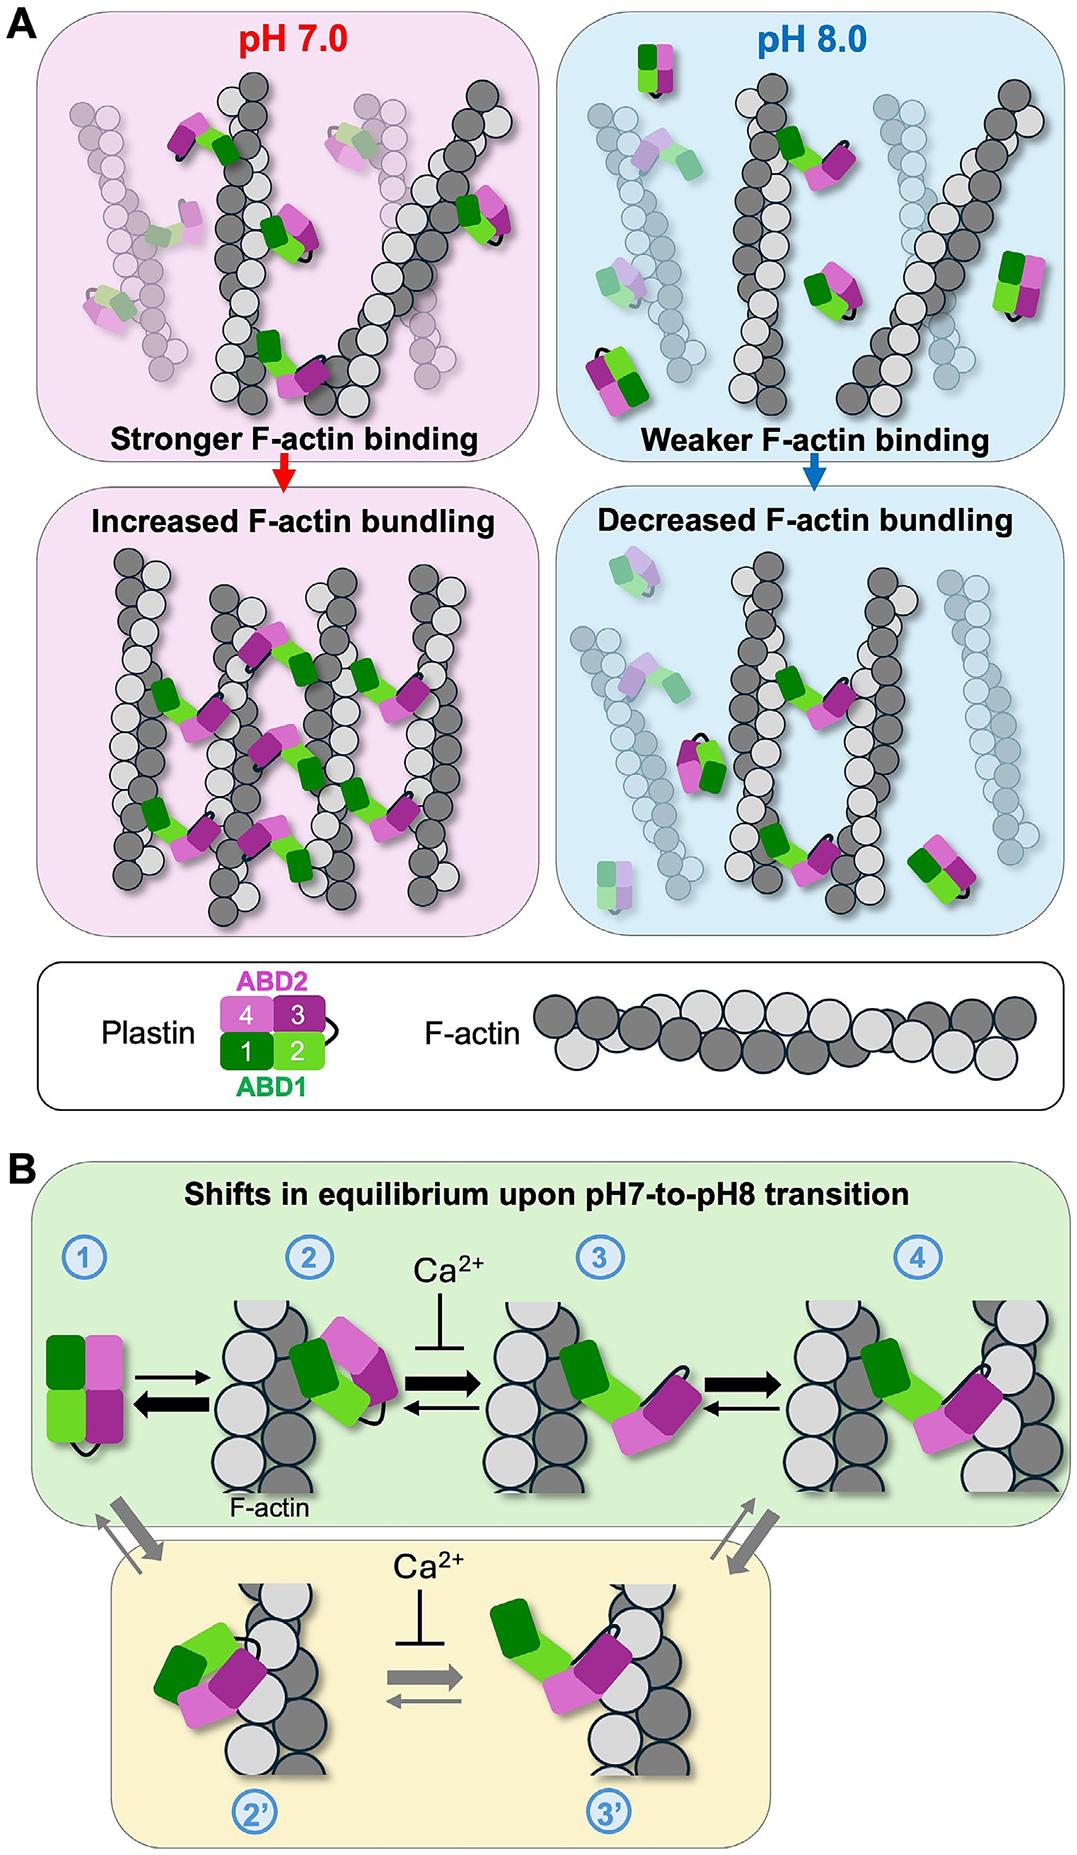
Abstract Intracellular pH (pH i ) is a fundamental component of cell homeostasis. Controlled elevations in pH i precede and accompany cell polarization, cytokinesis, and directional migration. pH dysregulation contributes to cancer, neurodegenerative diseases, diabetes, and other metabolic disorders. While cytoskeletal rearrangements are crucial for these processes, only a few cytoskeletal proteins, namely Cdc42, cofilin, talin, cortactin, α-actinin, and AIP1 have been documented as pH sensors. Here, we report that actin-bundling proteins plastin 2 (PLS2, aka LCP1) and plastin 3 (PLS3) respond to physiological scale pH fluctuations by a reduced F-actin bundling at alkaline pH. The inhibition of PLS2 actin-bundling activity at elevated pH stems from the reduced affinity of the N-terminal actin-binding domain (ABD1) to actin. In fibroblast cells, elevated cytosolic pH caused the dissociation of ectopically expressed PLS2 from actin structures, whereas acidic conditions promoted its tighter association with focal adhesions and stress fibers. We identified His207 as one of the pH-sensing residues whose mutation to Lys and Tyr reduces pH sensitivity by enhancing and inhibiting the bundling ability, respectively. Our results suggest that weaker actin bundling by plastin isoforms at alkaline pH favors higher dynamics of the actin cytoskeleton. Therefore, like other cytoskeleton pH sensors, plastins promote disassembly and faster dynamics of cytoskeletal components during cytokinesis and cell migration. Since both plastins are implemented in cancer, their pH sensitivity may contribute to the accelerated proliferation and enhanced invasive and metastatic potentials of cancer cells at alkaline pH i . Abstract Figure
Overview
The claims and statistics of this paper haven’t been checked yet.
Run the check — free, no account needed. It reads the open-access text and checks the sources it cites.
Integrity signals
Registry
Cites
Statistics
Figures
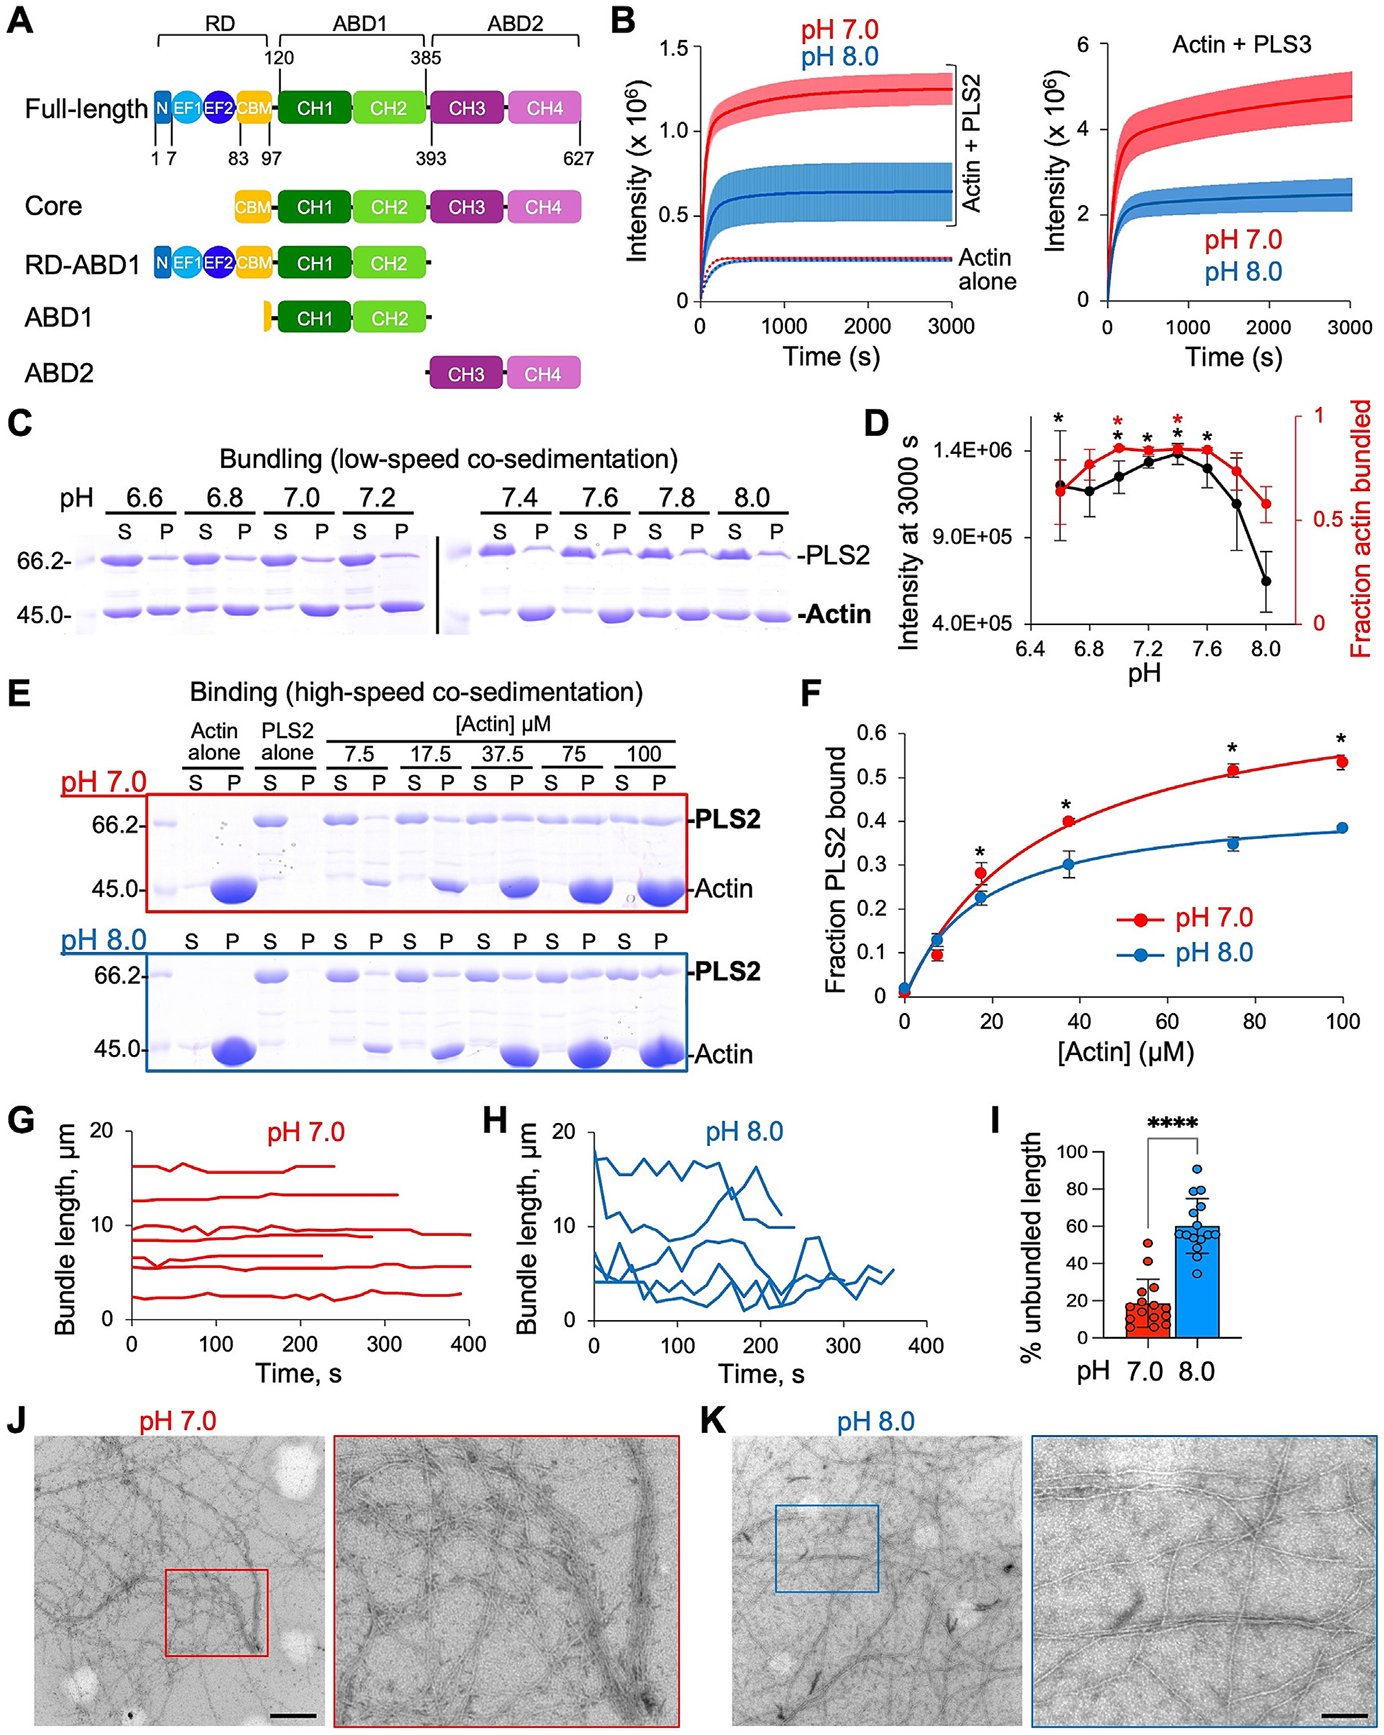
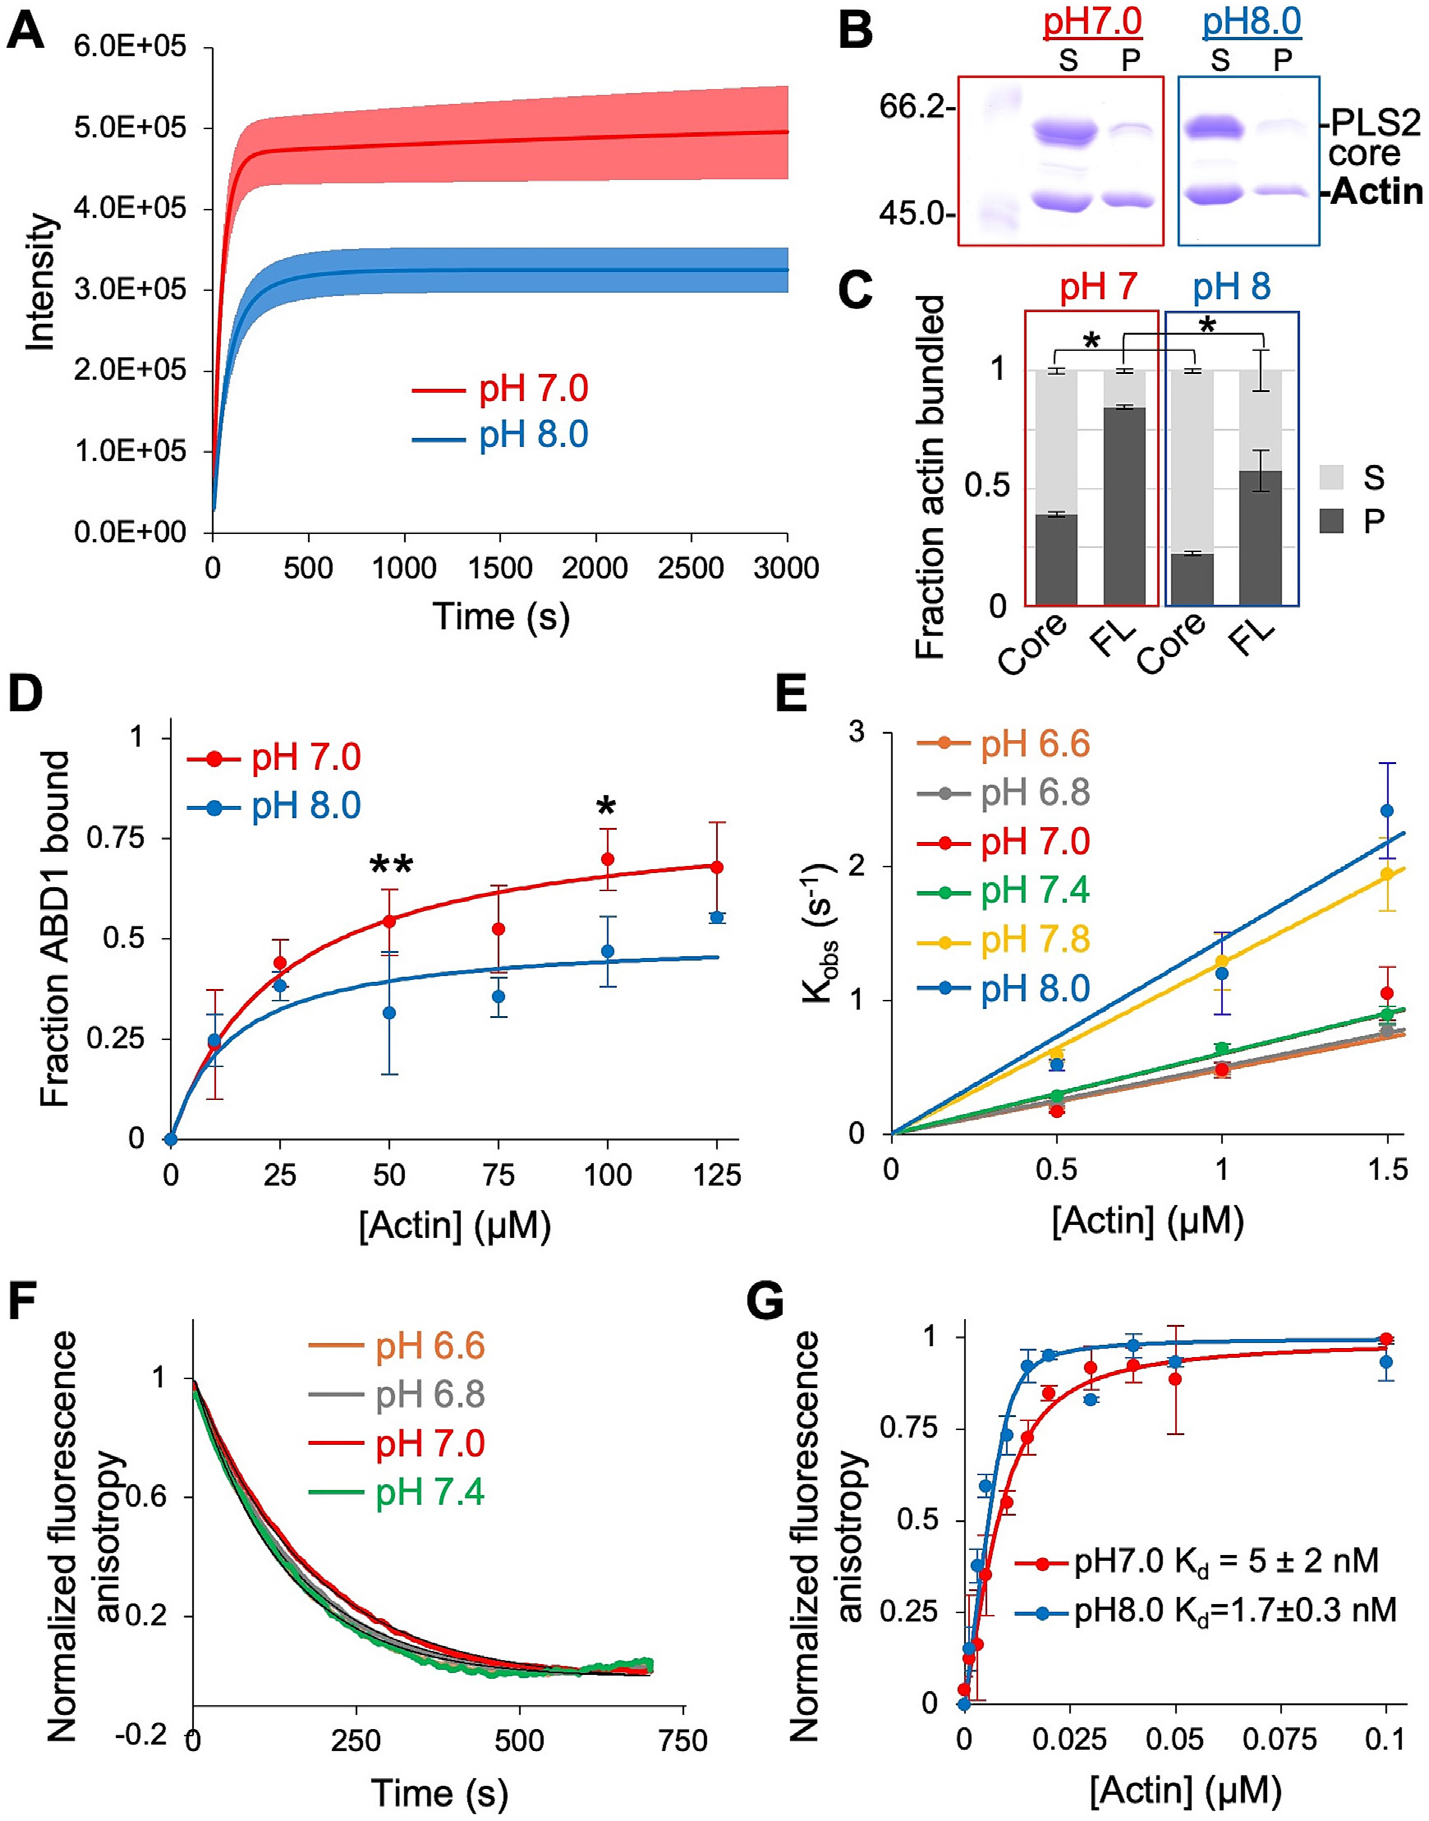
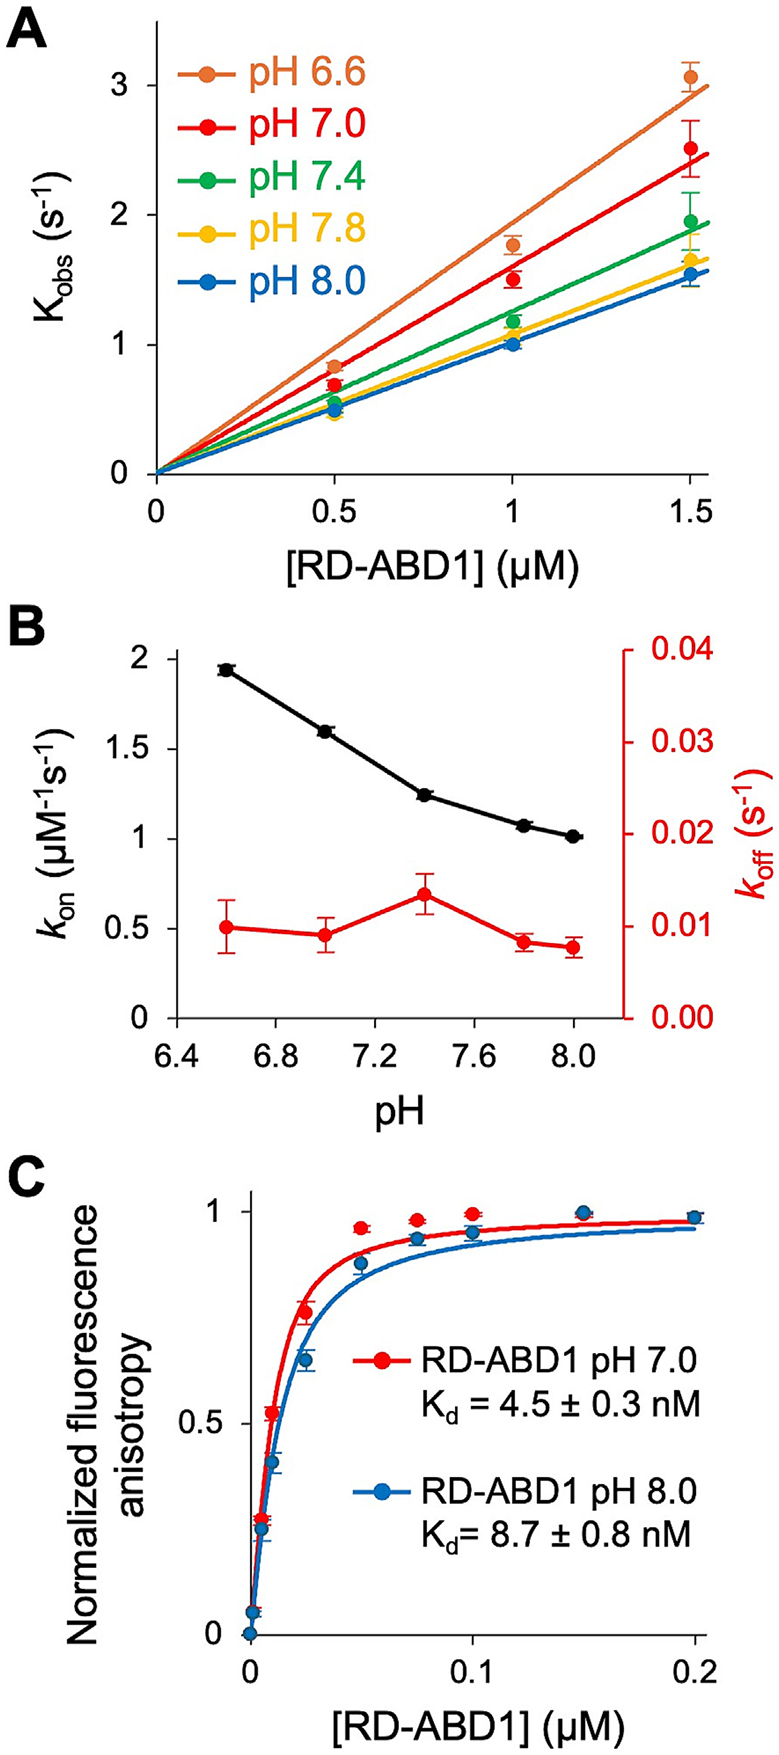
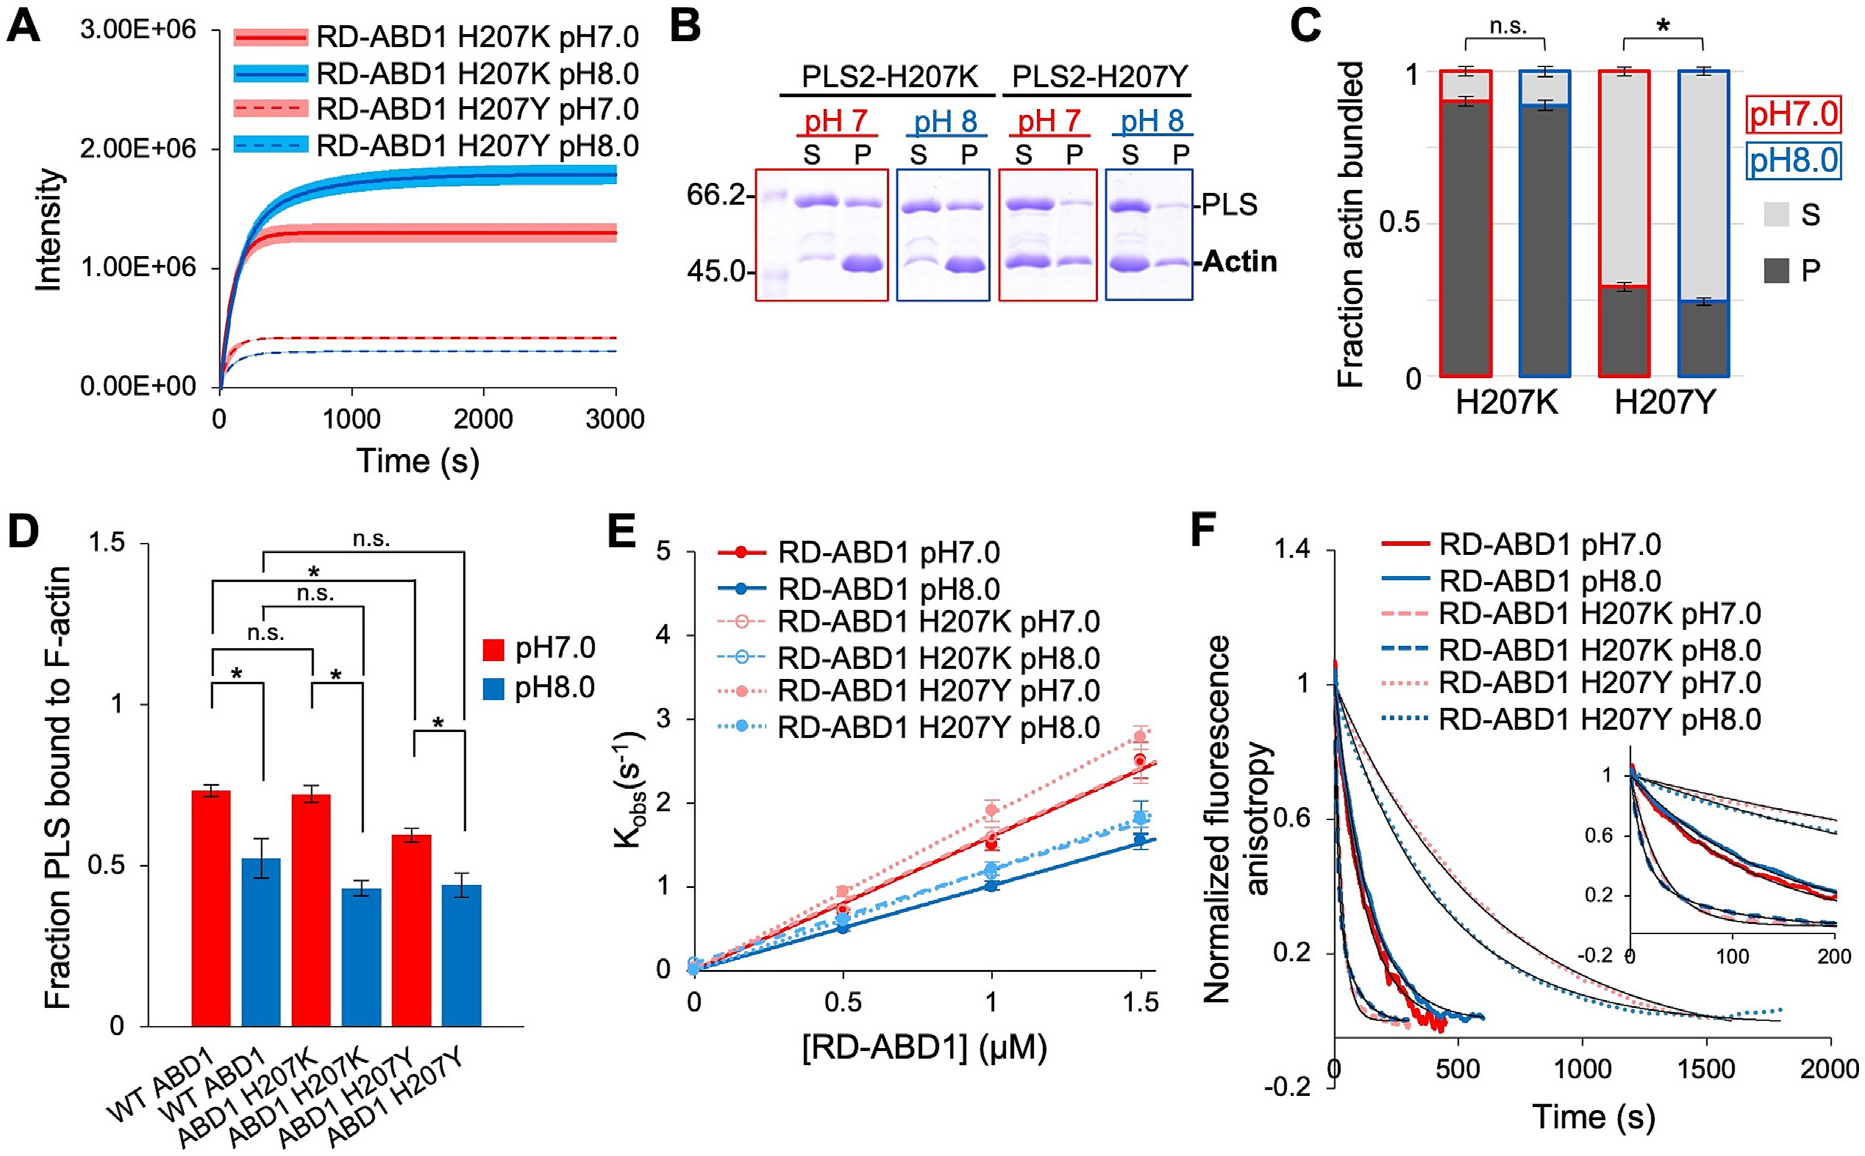
Verification
Claims the paper makes
The claims and statistics of this paper haven’t been checked yet.
Run the check — free, no account needed. It reads the open-access text and checks the sources it cites.
Self-check
Percentages, sums and reported differences re-computed from the paper’s own numbers.
The self-check needs the paper’s full text.
Citations
Cites
Highly accurate protein structure prediction with AlphaFold
Jumper, J., Evans, R., Pritzel, A., Green, T., Figurnov, M., Ronneberger, O., Tunyasuvunakool, K., Bates, R., Žídek, A., Potapenko, A., et al. (2021) · Nature · doi:10.1038/s41586-021-03819-2 · Cited by 43,764
Khalifa, A. A. Z., Ichikawa, M., Dai, D., Kubo, S., Black, C. S., Peri, K., McAlear, T. S., Veyron, S., Yang, S. K., Vargas, J., et al. (2020) · eLife · doi:10.7554/elife.52760 · Cited by 1,676
A Selected Core Microbiome Drives the Early Stages of Three Popular Italian Cheese Manufactures
De Filippis, F., La Storia, A., Stellato, G., Gatti, M., & Ercolini, D. (2014) · PLoS ONE · doi:10.1371/journal.pone.0089680 · Cited by 1,398
Signaling Receptors for TGF-β Family Members
Heldin, C.-H., & Moustakas, A. (2016) · Cold Spring Harbor Perspectives in Biology · doi:10.1101/cshperspect.a022053 · Cited by 711
Detection of Mycoplasma Contamination in Cell Cultures
Uphoff, C. C., & Drexler, H. G. (2014) · Current Protocols in Molecular Biology · doi:10.1002/0471142727.mb2804s106 · Cited by 116
Research works printed but not linked: 106
- Casey, 2010, Sensors and regulators of intracellular pH, Nature Rev. Mol. Cell Biol., 11, 50, 10.1038/nrm2820 · DOI · Paper page
- Spear, 2023, Single-cell intracellular pH dynamics regulate the cell cycle by timing the G1 exit and G2 transition, J. Cell Sci., 136, 10.1242/jcs.260458 · DOI
- Czowski, 2020, Cancer and pH dynamics: transcriptional regulation, proteostasis, and the need for new molecular tools, Cancers (Basel), 12, 1, 10.3390/cancers12102760 · DOI
- Majdi, 2016, Permissive role of cytosolic pH acidification in neurodegeneration: a closer look at its causes and consequences, J. Neurosci. Res., 94, 879, 10.1002/jnr.23757 · DOI
- Stock, 2006, Role of the Na+/H+ exchanger NHE1 in cell migration, Acta Physiol., 187, 149, 10.1111/j.1748-1716.2006.01543.x · DOI
- Ludwig, 2013, The Na+/H+ -exchanger (NHE1) generates pH nanodomains at focal adhesions, J. Cell. Physiol., 228, 1351, 10.1002/jcp.24293 · DOI
- Denker, 2002, Cell migration requires both ion translocation and cytoskeletal anchoring by the Na-H exchanger NHE1, J. Cell Biol., 159, 1087, 10.1083/jcb.200208050 · DOI
- Choi, 2013, pH sensing by FAK-His58 regulates focal adhesion remodeling, J. Cell Biol., 202, 849, 10.1083/jcb.201302131 · DOI
- Schwab, 2012, Role of ion channels and transporters in cell migration, Physiol. Rev., 92, 1865, 10.1152/physrev.00018.2011 · DOI · Paper page
- Cardone, 2005, The role of disturbed pH dynamics and the NA+/H+ exchanger in metastasis, Nature Rev. Cancer, 5, 786, 10.1038/nrc1713 · DOI · Paper page
- Kruse, 2017, The effect of pH on cell viability, cell migration, cell proliferation, wound closure, and wound reepithelialization: In vitro and in vivo study, Wound Repair Regen., 25, 260, 10.1111/wrr.12526 · DOI
- Martin, 2011, Intracellular pH gradients in migrating cells, Am. J. Physiol. Cell Physiol., 300, C490, 10.1152/ajpcell.00280.2010 · DOI
- Frantz, 2007, Positive feedback between Cdc42 activity and H+ efflux by the Na-H exchanger NHE1 for polarity of migrating cells, J. Cell Biol., 179, 403, 10.1083/jcb.200704169 · DOI
- Pope, 2004, Solution structure of human cofilin: actin binding, pH sensitivity, and relationship to actin-depolymerizing factor, J. Biol. Chem., 279, 4840, 10.1074/jbc.M310148200 · DOI
- Frantz, 2008, Cofilin is a pH sensor for actin free barbed end formation: role of phosphoinositide binding, J. Cell Biol., 183, 865, 10.1083/jcb.200804161 · DOI
- Srivastava, 2008, Structural model and functional significance of pH-dependent talin–actin binding for focal adhesion remodeling, Proc. Natl. Acad. Sci., 105, 14436, 10.1073/pnas.0805163105 · DOI
- Magalhaes, 2011, Cortactin phosphorylation regulates cell invasion through a pH-dependent pathway, J. Cell Biol., 195, 903, 10.1083/jcb.201103045 · DOI
- Nomura, 2016, Actin-interacting protein 1 promotes disassembly of actin-depolymerizing factor/cofilin-bound actin filaments in a pH-dependent manner, J. Biol. Chem., 291, 5146, 10.1074/jbc.M115.713495 · DOI
- Hall, 2005, Rho GTPases and the control of cell behaviour, Biochem. Soc. Trans., 33, 891, 10.1042/BST0330891 · DOI
- Hawkins, 1993, Human actin depolymerizing factor mediates a pH-sensitive destruction of actin filaments, Biochemistry, 32, 9985, 10.1021/bi00089a014 · DOI
- Chen, 2004, In vitro activity differences between proteins of the ADF/Cofilin family define two distinct subgroups, Biochemistry, 7127, 10.1021/bi049797n · DOI
- Wioland, 2019, Quantitative variations with pH of actin depolymerizing factor/Cofilin’s multiple actions on actin filaments, Biochemistry, 58, 40, 10.1021/acs.biochem.8b01001 · DOI
- DesMarais, 2005, Cofilin takes the lead, J. Cell Sci., 118, 19, 10.1242/jcs.01631 · DOI
- Condeelis, 1982, A Calcium- and pH-regulated protein from Dictyostelium discoideum that cross-links actin filaments, J. Cell Biol., 94, 466, 10.1083/jcb.94.2.466 · DOI
- Mabuchi, 1985, Alpha-actinin from sea urchin eggs: biochemical properties, interaction with actin, and distribution in the cell during fertilization and cleavage, J. Cell Biol., 100, 375, 10.1083/jcb.100.2.375 · DOI
- Liem, 2016, Cytoskeletal integrators: the spectrin superfamily, Cold Spring Harb. Perspect. Biol., 8, 1, 10.1101/cshperspect.a018259 · DOI
- Schwebach, 2017, The roles of actin-binding domains 1 and 2 in the calcium-dependent regulation of actin filament bundling by human plastins, J. Mol. Biol., 429, 2490, 10.1016/j.jmb.2017.06.021 · DOI
- Klein, 2004, Structure of the actin crosslinking core of fimbrin, Structure, 12, 999, 10.1016/j.str.2004.04.010 · DOI
- Schwebach, 2022, Allosteric regulation controls actin-bundling properties of human plastins, Nature Struct. Mol. Biol., 29, 519, 10.1038/s41594-022-00771-1 · DOI
- Mei, 2022, Structural mechanism for bidirectional actin cross-linking by T-plastin, Proc. Natl. Acad. Sci. U. S. A., 119, 1, 10.1073/pnas.2205370119 · DOI
- Blanchoin, 2014, Actin dynamics, architecture, and mechanics in cell motility, Physiol. Rev., 94, 235, 10.1152/physrev.00018.2013 · DOI
- Pollard, 2016, Actin and actin-binding proteins, Cold Spring Harb. Perspect. Biol., 8, 10.1101/cshperspect.a018226 · DOI
- Lin, 1993, Human plastin genes. Comparative gene structure, chromosome location, and differential expression in normal and neoplastic cells, J. Biol. Chem., 268, 2781, 10.1016/S0021-9258(18)53842-4 · DOI
- Shinomiya, 2012, Plastin family of actin-bundling proteins: its functions in leukocytes, neurons, intestines, and cancer, Int. J. Cell Biol., 2012, 1, 10.1155/2012/213492 · DOI
- Lin, 1994, Identification of I-plastin, a human fimbrin isoform expressed in intestine and kidney, Mol. Cell Biol., 14, 2457
- Diaz-Horta, 2019, Novel variant p.E269K confirms causative role of PLS1 mutations in autosomal dominant hearing loss, Clin. Genet., 96, 575, 10.1111/cge.13626 · DOI
- Morley, 2012, The actin-bundling protein L-plastin : a critical regulator of immune cell function, Int. J. Cell Biol., 2012, 1, 10.1155/2012/935173 · DOI
- Wolff, 2021, Plastin 3 in health and disease: a matter of balance, Cell. Mol. Life Sci., 10.1007/s00018-021-03843-5 · DOI
- Park, 1994, Activation of the leukocyte plastin gene occurs in most human cancer cells, Cancer Res., 54, 1775
- Foran, 2006, The leukocyte protein L-plastin induces proliferation, invasion and loss of E-cadherin expression in colon cancer cells, Int. J. Cancer, 118, 2098, 10.1002/ijc.21593 · DOI
- Riplinger, 2014, Metastasis of prostate cancer and melanoma cells in a preclinical in vivo mouse model is enhanced by L-plastin expression and phosphorylation, Mol. Cancer, 13, 1, 10.1186/1476-4598-13-10 · DOI
- Machado, 2021, L-plastin Ser5 phosphorylation is modulated by the PI3K/SGK pathway and promotes breast cancer cell invasiveness, Cell Commun. Signal., 19, 1, 10.1186/s12964-021-00710-5 · DOI
- Ma, 2019, Plastin 3 down-regulation augments the sensitivity of MDA-MB-231 cells to paclitaxel via the p38 MAPK signalling pathway, Artif. Cells Nanomed. Biotechnol., 47, 684, 10.1080/21691401.2019.1576707 · DOI
- Bosseler, 2018, Inhibition of HIF1α-dependent upregulation of phospho-l-plastin resensitizes multiple myeloma cells to frontline therapy, Int. J. Mol. Sci., 19, 1551, 10.3390/ijms19061551 · DOI
- Xin, 2020, PLS3 predicts poor prognosis in pancreatic cancer and promotes cancer cell proliferation via PI3K/AKT signaling, J. Cell. Physiol., 235, 8416, 10.1002/jcp.29685 · DOI
- Wang, 2024, PLS3 promotes papillary thyroid carcinoma progression by activating the Notch signaling pathway, Environ. Toxicol., 39, 539, 10.1002/tox.23872 · DOI
- Janji, 2006, Phosphorylation on Ser5 increases the F-actin-binding activity of L-plastin and promotes its targeting to sites of actin assembly in cells, J. Cell Sci., 119, 1947, 10.1242/jcs.02874 · DOI
- Schwebach, 2020, Osteogenesis imperfecta mutations in plastin 3 lead to impaired calcium regulation of actin bundling, Bone Res., 8, 21, 10.1038/s41413-020-0095-2 · DOI
- Ishida, 2017, The calcium-dependent switch helix of L-plastin regulates actin bundling, Sci. Rep., 7, 1, 10.1038/srep40662 · DOI
- Huttlin, 2010, A tissue-specific atlas of mouse protein phosphorylation and expression, Cell, 143, 1174, 10.1016/j.cell.2010.12.001 · DOI · Paper page
- Klammer, 2012, Phosphosignature predicts dasatinib response in non-small cell lung cancer, Mol. Cell. Proteomics, 11, 651, 10.1074/mcp.M111.016410 · DOI · Paper page
- Mertins, 2016, Proteogenomics connects somatic mutations to signalling in breast cancer, Nature, 534, 55, 10.1038/nature18003 · DOI · Paper page
- Mertins, 2014, Ischemia in tumors induces early and sustained phosphorylation changes in stress kinase pathways but does not affect global protein levels, Mol. Cell. Proteomics, 13, 1690, 10.1074/mcp.M113.036392 · DOI · Paper page
- Zhou, 2013, Toward a comprehensive characterization of a human cancer cell phosphoproteome, J. Proteome Res., 12, 260, 10.1021/pr300630k · DOI · Paper page
- Freeley, 2012, L-plastin regulates polarization and migration in chemokine-stimulated human T lymphocytes, J. Immunol., 188, 6357, 10.4049/jimmunol.1103242 · DOI
- Skau, 2011, Actin filament bundling by fimbrin is important for endocytosis, cytokinesis, and polarization in fission yeast, J. Biol. Chem., 286, 26964, 10.1074/jbc.M111.239004 · DOI
- Namba, 1992, Human T cell L-plastin bundles actin filaments in a calcium dependent manner, J. Biochem., 112, 503, 10.1093/oxfordjournals.jbchem.a123929 · DOI
- Ellis, 1982, Buffers of constant ionic strength for studying pH-dependent processes, Methods Enzymol., 87, 405, 10.1016/S0076-6879(82)87025-0 · DOI
- Wang, 1989, pH dependence of actin self-assembly, Biophys. J., 55, 293, 10.1016/S0006-3495(89)82804-8 · DOI
- Pardee, 1982, Purification of muscle actin, Methods Cell Biol., 24, 271, 10.1016/S0091-679X(08)60661-5 · DOI
- Singh, 2017, The N-terminal flanking region modulates the actin binding affinity of the utrophin tandem calponin-homology domain, Biochemistry, 56, 2627, 10.1021/acs.biochem.6b01117 · DOI
- Avery, 2017, Structural basis for high-affinity actin binding revealed by a β-III-spectrin SCA5 missense mutation, Nature Commun., 8, 1, 10.1038/s41467-017-01367-w · DOI
- Jarmoskaite, 2020, How to measure and evaluate binding affinities, Elife, 9, 1, 10.7554/eLife.57264 · DOI
- Edgcomb, 2002, Variability in the pKa of histidine side-chains correlates with burial within proteins, Proteins Struct. Funct. Bioinform., 49, 1, 10.1002/prot.10177 · DOI
- Thomas, 1979, Intracellular pH measurements in Ehrlich ascites tumor cells utilizing spectroscopic probes generated in situ, Biochemistry, 18, 2210, 10.1021/bi00578a012 · DOI
- Grillo-Hill, 2014, Ratiometric imaging of pH probes, Methods Cell Biol., 123, 429, 10.1016/B978-0-12-420138-5.00023-9 · DOI
- Brough, 2003, Ca2+ stores and Ca2+ entry differentially contribute to the release of IL-1 beta and IL-1 alpha from murine macrophages, J. Immunol., 170, 3029, 10.4049/jimmunol.170.6.3029 · DOI
- Tsunoda, 1991, Cytosolic acidification leads to Ca2+ mobilization from intracellular stores in single and populational parietal cells and platelets, Exp. Cell Res., 193, 356, 10.1016/0014-4827(91)90107-6 · DOI
- Križaj, 2011, Intracellular pH modulates inner segment calcium homeostasis in vertebrate photoreceptors, Am. J. Physiol. – Cell Physiol., 300, 187, 10.1152/ajpcell.00264.2010 · DOI
- Slotki, 1993, Interrelationship between cell pH and cell calcium in rat inner medullary collecting duct cells, Am. J. Physiol., 265, C432, 10.1152/ajpcell.1993.265.2.C432 · DOI
- Burns, 1991, Cytosolic acidification stimulates a calcium influx that activates Na(+)-H+ exchange in LLC-PK1, Am. J. Physiol., 261, F617
- Fan, 2017, Structural basis for pH-mediated regulation of F-actin severing by gelsolin domain 1, Sci. Rep., 7, 45230, 10.1038/srep45230 · DOI
- Grey, 2006, Characterizing a partially folded intermediate of the villin headpiece domain under non-denaturing conditions: contribution of His41 to the pH-dependent stability of the N-terminal subdomain, J. Mol. Biol., 355, 1078, 10.1016/j.jmb.2005.11.001 · DOI
- Jurrus, 2018, Improvements to the APBS biomolecular solvation software suite, Protein Sci., 27, 112, 10.1002/pro.3280 · DOI
- Wabnitz, 2010, Sustained LFA‐1 cluster formation in the immune synapse requires the combined activities of L‐plastin and calmodulin, Eur. J. Immunol., 40, 2437, 10.1002/eji.201040345 · DOI
- Wang, 2010, Actin-bundling protein L-plastin regulates T cell activation, J. Immunol., 185, 7487, 10.4049/jimmunol.1001424 · DOI
- Zhou, 2016, L-plastin promotes podosome longevity and supports macrophage motility, Mol. Immunol., 79, 10.1016/j.molimm.2016.08.012 · DOI
- Linehan, 2022, Follow that cell: leukocyte migration in L-plastin mutant zebrafish, Cytoskeleton, 79, 26, 10.1002/cm.21717 · DOI
- Chellaiah, 2020, L-plastin deficiency produces increased trabecular bone due to attenuation of sealing ring formation and osteoclast dysfunction, Bone Res., 8, 10.1038/s41413-019-0079-2 · DOI
- Todd, 2011, The actin-bundling protein L-plastin is essential for marginal zone B cell development, J. Immunol., 187, 3015, 10.4049/jimmunol.1101033 · DOI
- Lardner, 2001, The effects of extracellular pH on immune function, J. Leukoc. Biol., 69, 522, 10.1189/jlb.69.4.522 · DOI · Paper page
- Paradise, 2011, Acidic extracellular pH promotes activation of integrin αvβ3, PLoS One, 6, 10.1371/journal.pone.0015746 · DOI
- Salameh, 2014, Effects of metabolic acidosis on intracellular pH responses in multiple cell types, Am. J. Physiol. Regul. Integr. Comp. Physiol., 307, 1413, 10.1152/ajpregu.00154.2014 · DOI
- Teti, 1989, Regulation of podosomes by intracellular pH in avian osteoclasts, Boll. Soc. Ital. Biol. Sper., 65, 597
- Teti, 1989, Extracellular protons acidify osteoclasts, reduce cytosolic calcium, and promote expression of cell-matrix attachment structures, J. Clin. Invest., 84, 773, 10.1172/JCI114235 · DOI
- Webb, 2011, Dysregulated pH: a perfect storm for cancer progression, Nature Publ. Gr., 11, 671
- O’Neill, 2009, The coordination between actin filaments and adhesion in mesenchymal migration, Cell Adhes. Migr., 3, 2
- Brun, 2014, T-plastin expression downstream to the calcineurin/NFAT pathway is involved in keratinocyte migration, PLoS One, 9, 1, 10.1371/journal.pone.0104700 · DOI
- Garbett, 2020, T-plastin reinforces membrane protrusions to bridge matrix gaps during cell migration, Nature Commun., 11, 10.1038/s41467-020-18586-3 · DOI
- Park, 2024, T-plastin contributes to epithelial-mesenchymal transition in human lung cancer cells through FAK/AKT/Slug axis signaling pathway, BMB Rep., 57, 305, 10.5483/BMBRep.2024-0040 · DOI
- Rajan, 2023, Actin bundles dynamics and architecture, Biomolecules, 13, 10.3390/biom13030450 · DOI
- Gong, 2024, Fascin structural plasticity mediates flexible actin bundle construction, bioRxiv, 1
- Yamakita, 1996, Phosphorylation of human fascin inhibits its actin binding and bundling activities, J. Biol. Chem., 271, 12632, 10.1074/jbc.271.21.12632 · DOI
- Galkin, 2010, Opening of tandem calponin homology domains regulates their affinity for F-actin, Nature Struct. Mol. Biol., 17, 614, 10.1038/nsmb.1789 · DOI
- Lin, 2011, Large-scale opening of utrophin’s tandem calponin homology (CH) domains upon actin binding by an induced-fit mechanism, Proc. Natl. Acad. Sci. U. S. A., 108, 12729, 10.1073/pnas.1106453108 · DOI
- Fealey, 2018, Dynamics of dystrophin’s actin-binding domain, Biophys. J., 115, 445, 10.1016/j.bpj.2018.05.039 · DOI
- Harris, 2019, Steric regulation of tandem calponin homology domain actin-binding affinity, Mol. Biol. Cell, 30, 3112, 10.1091/mbc.E19-06-0317 · DOI
- Dong, 2022, Photorhabdus luminescens TccC3 toxin targets the dynamic population of F-actin and impairs cell cortex integrity, Int. J. Mol. Sci., 23, 7026, 10.3390/ijms23137026 · DOI
- Voinescu, 2006, Similarity of salt influences on the pH of buffers, polyelectrolytes, and proteins, J. Phys. Chem. B, 110, 8870, 10.1021/jp0600209 · DOI
- Wilkins, 1999, Protein identification and analysis tools in the ExPASy server, Methods Mol. Biol., 112, 531
- Schindelin, 2012, Fiji: an open-source platform for biological-image analysis, Nature Methods, 9, 676, 10.1038/nmeth.2019 · DOI · Paper page
- Schindelin, 2015, The ImageJ ecosystem: an open platform for biomedical image analysis, Mol. Reprod. Dev, 82, 518, 10.1002/mrd.22489 · DOI
- Kudryashova, 2022, Pointed-end processive elongation of actin filaments by Vibrio effectors VopF and VopL, Sci. Adv., 8, 10.1126/sciadv.adc9239 · DOI
- Rizzo, 2009, Fluorescent protein tracking and detection: fluorescent protein structure and color variants, Cold Spring Harb. Protoc., 2009
- Koivusalo, 2010, Amiloride inhibits macropinocytosis by lowering submembranous pH and preventing Rac1 and Cdc42 signaling, J. Cell Biol., 188, 547, 10.1083/jcb.200908086 · DOI
- Varadi, 2022, AlphaFold protein structure database: massively expanding the structural coverage of protein-sequence space with high-accuracy models, Nucleic Acids Res., 50, D439, 10.1093/nar/gkab1061 · DOI · Paper page
Metadata
- Authors
- Runyan, L. A., Kudryashova, E., Agrawal, R., Mohamed, M., & Kudryashov, D. S.
- Affiliations
- The Ohio State University (US)
- Corresponding author
- Kudryashov, Dmitri S.
- Venue
- Journal of Molecular Biology
- Publisher
- Elsevier BV
- Published
- 2025-10
- Volume
- 437
- Issue
- 19
- Pages
- 169306
- ISSN
- 0022-2836 (ISSN-L)
- PMC
- PMC12309418
- OpenAlex
- W4411632033
- Cited by
- 3
- References
- 5
- Citations by year
- 2026: 3
- FWCI
- 1.50
- Type
- journal article
- Language
- en
- Open access
- hybrid
- doi.org
- Licence
- Locations
- Journal of Molecular Biology (publishedVersion, cc-by)
- bioRxiv (Cold Spring Harbor Laboratory) (acceptedVersion, cc-by-nd)
- PubMed (publishedVersion)
- PubMed Central (acceptedVersion, cc-by)
- Europe PMC (PubMed Central) (submittedVersion, cc-by-nd)
- PubMed Central (submittedVersion, cc-by-nd)
- Funders
- National Institutes of Health
- NIH National Institute of General Medical Sciences (R01 GM145813)
- Topics
- Life Sciences › Biochemistry, Genetics and Molecular Biology › Cell Biology › Cellular Mechanics and Interactions
- Life Sciences › Biochemistry, Genetics and Molecular Biology › Molecular Biology › Protein Kinase Regulation and GTPase Signaling
- Life Sciences › Biochemistry, Genetics and Molecular Biology › Molecular Biology › Protein Structure and Dynamics
- Keywords
- PLS3, intracellular pH, F-actin bundling, actin-binding domain, alkaline pH, actin cytoskeleton dynamics, focal adhesions, stress fibers, tumor invasion, metastasis, cell migration, cytokinesis
About these checks
Registry, retraction, Cites and statistics results are computed, not judged, with one exception: a printed reference that no index lists is read once by a model before it counts as a citation error. Claims are extracted by a model and kept only when their quote appears verbatim in the text; each cited source is then checked, with a model’s help, for whether it says what the claim relies on. Those verdicts can be wrong — read the claim’s quote and the cited source before relying on one.
Statistics and arithmetic are recomputed, not judged.
Confidence bands are shown only for fields calibrated on our annotated test set. None is calibrated yet, so no band is shown.
What counts as a claim ›How we measure confidence ›How we check this ›
Are you an author, or do you see a problem with this page? Request a review
How to cite
Cite CoChat for the checks on this page, and the paper for its own findings.
- This page
- CoChat. (2026). Citation check: Human Plastins are Novel Cytoskeletal pH Sensors with a Reduced F-actin Bundling Capacity at Basic pH. https://app.cochat.ai/papers/10.1016/j.jmb.2025.169306
- The paper
- Runyan, L. A., Kudryashova, E., Agrawal, R., Mohamed, M., & Kudryashov, D. S. (2025). Human Plastins are Novel Cytoskeletal pH Sensors with a Reduced F-actin Bundling Capacity at Basic pH. Journal of Molecular Biology. https://doi.org/10.1016/j.jmb.2025.169306
