

The DOI matches its Crossref record; 39 of the 39 references it cites were found in a registry or an index.
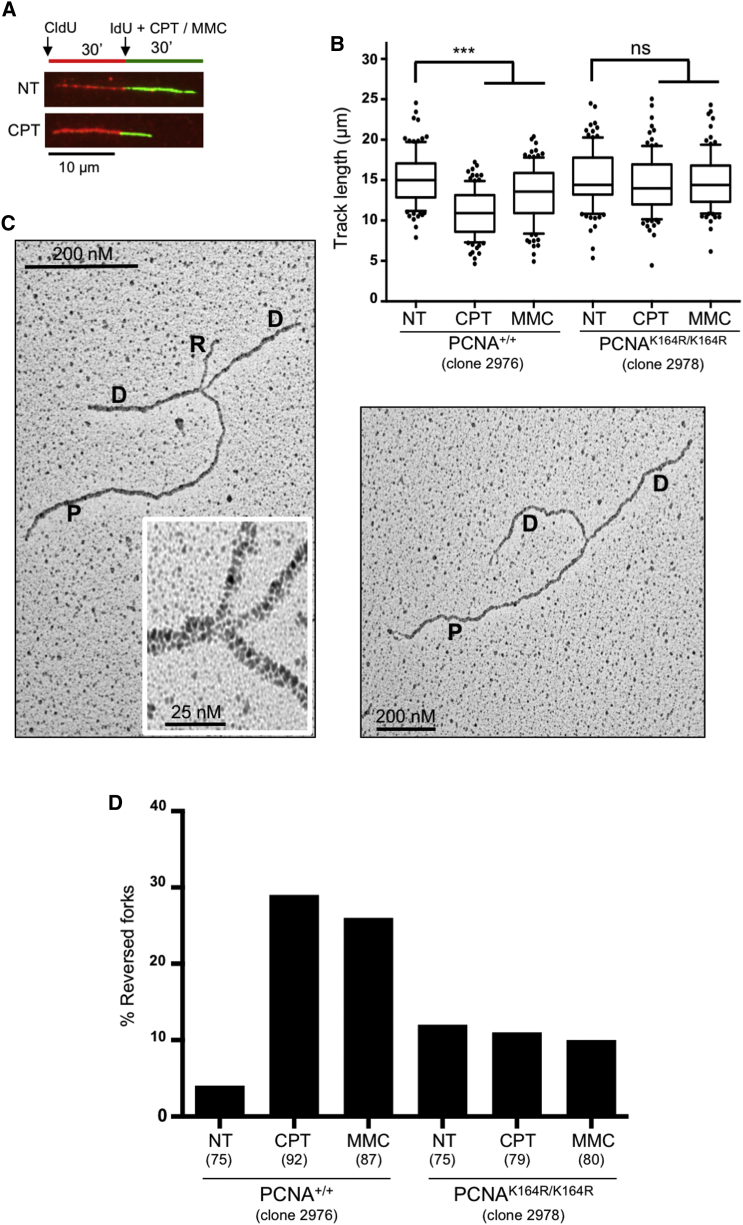
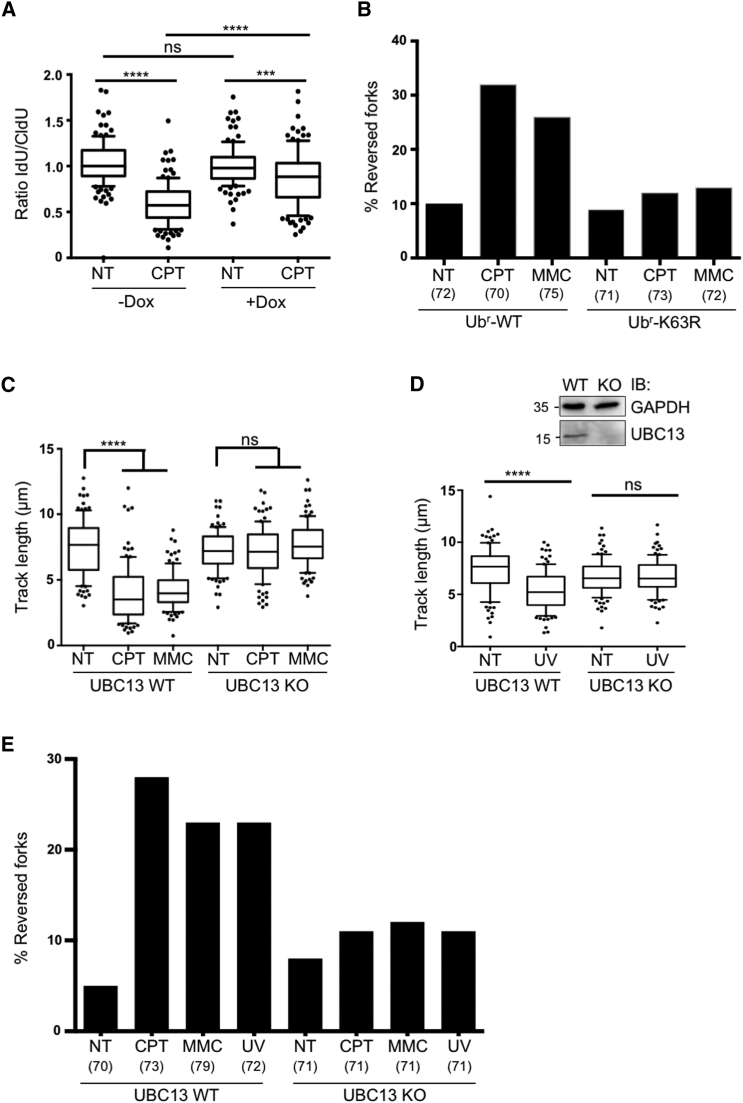
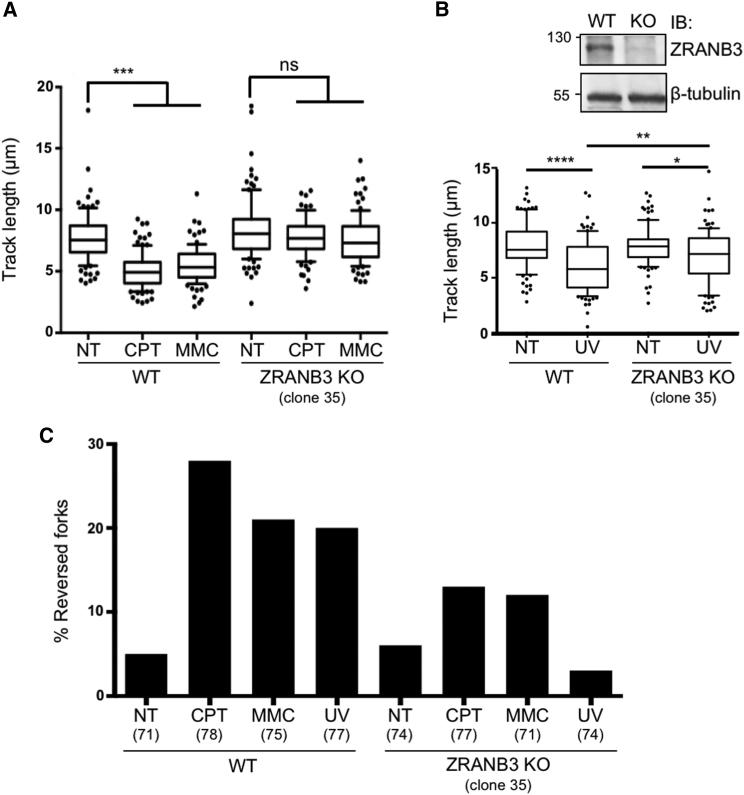
Replication fork slowing and reversal upon DNA damage require PCNA polyubiquitination and ZRANB3 DNA translocase activity.
Open accessAbstract
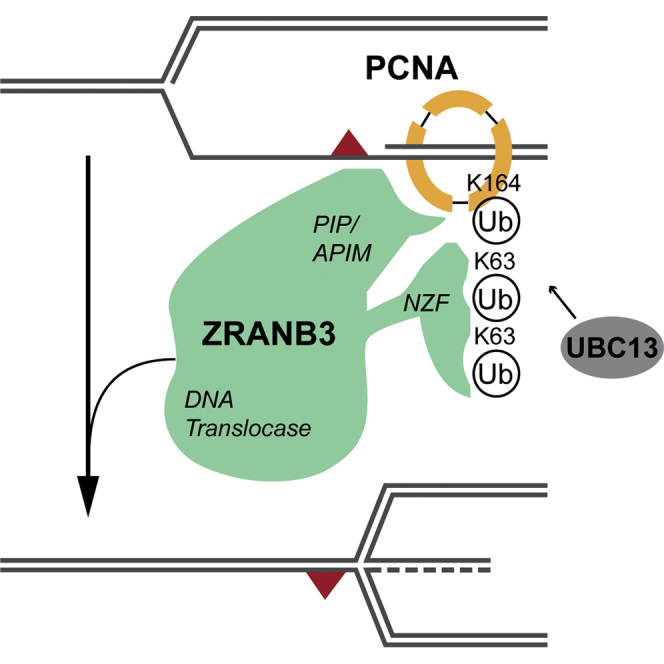
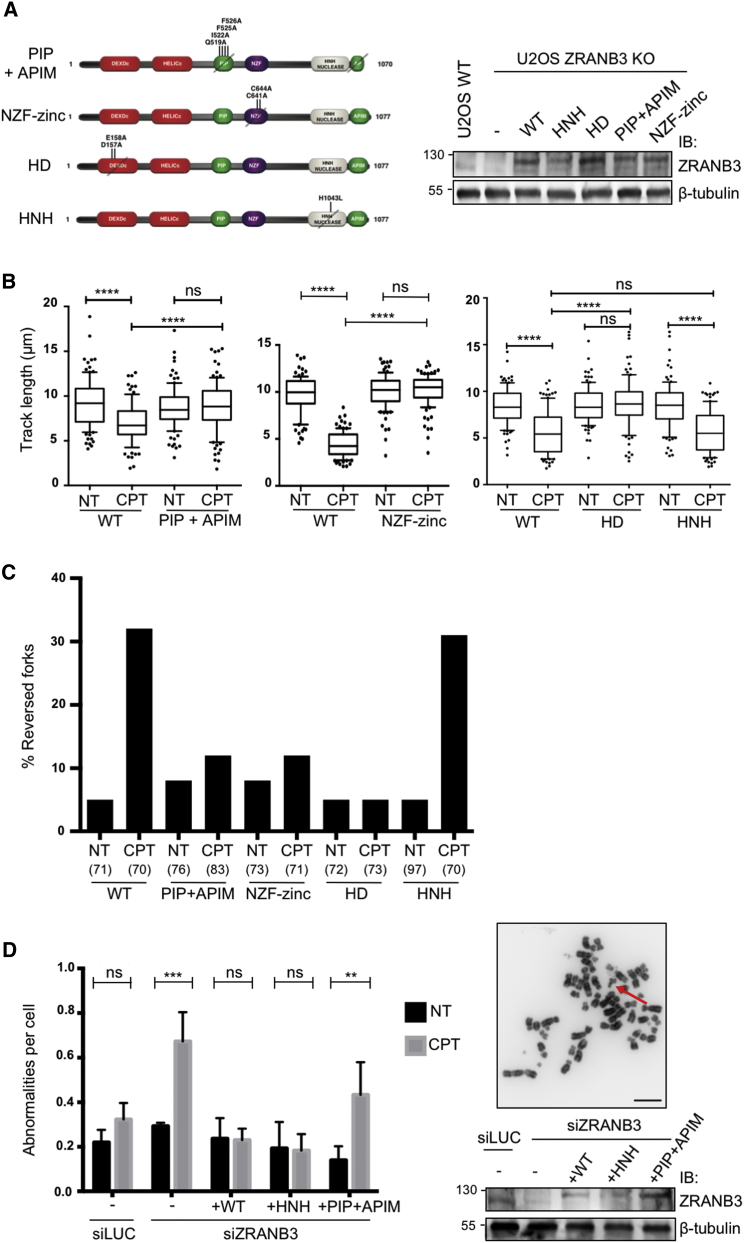
DNA damage tolerance during eukaryotic replication is orchestrated by PCNA ubiquitination. While monoubiquitination activates mutagenic translesion synthesis, polyubiquitination activates an error-free pathway, elusive in mammals, enabling damage bypass by template switching. Fork reversal is driven in vitro by multiple enzymes, including the DNA translocase ZRANB3, shown to bind polyubiquitinated PCNA. However, whether this interaction promotes fork remodeling and template switching in vivo was unknown. Here we show that damage-induced fork reversal in mammalian cells requires PCNA ubiquitination, UBC13, and K63-linked polyubiquitin chains, previously involved in error-free damage tolerance. Fork reversal in vivo also requires ZRANB3 translocase activity and its interaction with polyubiquitinated PCNA, pinpointing ZRANB3 as a key effector of error-free DNA damage tolerance. Mutations affecting fork reversal also induced unrestrained fork progression and chromosomal breakage, suggesting fork remodeling as a global fork slowing and protection mechanism. Targeting these fork protection systems represents a promising strategy to potentiate cancer chemotherapy.
Overview
The claims and statistics of this paper haven’t been checked yet.
Run the check — free, no account needed. It reads the open-access text and checks the sources it cites.
Integrity signals
Registry
Cites
Statistics
Figures
Verification
Claims the paper makes
The claims and statistics of this paper haven’t been checked yet.
Run the check — free, no account needed. It reads the open-access text and checks the sources it cites.
Claims other papers make about this one
Each is checked against this paper’s own text: does it say what the citing paper says it does?
In the citing paper
“Recently, K63-linked polyubiquitination of PCNA was found to stimulate template switching by creating a binding platform for the DNA translocase, ZRANB3 (Vujanovic et al., 2017).”
From USP7 Is a Master Regulator of Genome Stability (2020) · cites this paper as Vujanovic et al., 2017
Self-check
Percentages, sums and reported differences re-computed from the paper’s own numbers.
The self-check needs the paper’s full text.
Citations
Cites
RAD6-dependent DNA repair is linked to modification of PCNA by ubiquitin and SUMO
Hoege, C., Pfander, B., Moldovan, G., Pyrowolakis, G., & Jentsch, S. (2002) · Nature · doi:10.1038/nature00991 · Cited by 2,202
The Bloom's syndrome helicase suppresses crossing over during homologous recombination
Wu, L., & Hickson, I. D. (2003) · Nature · doi:10.1038/nature02253 · Cited by 1,087
Fork Reversal and ssDNA Accumulation at Stalled Replication Forks Owing to Checkpoint Defects
Sogo, J. M., Lopes, M., & Foiani, M. (2002) · Science · doi:10.1126/science.1074023 · Cited by 824
Self-citationUbiquitin-binding domains in Y-family polymerases regulate translesion synthesis.
Bienko, M., Green, C. M., Crosetto, N., Rudolf, F., Zapart, G., Coull, B., Kannouche, P., Wider, G., Peter, M., Lehmann, A. R., et al. (2005) · Science · doi:10.1126/science.1120615 · Cited by 712
Rad51-mediated replication fork reversal is a global response to genotoxic treatments in human cells
Zellweger, R., Dalcher, D., Mutreja, K., Berti, M., Schmid, J. A., Herrador, R., Vindigni, A., & Lopes, M. (2015) · The Journal of Cell Biology · doi:10.1083/jcb.201406099 · Cited by 691
Self-citationTopoisomerase I poisoning results in PARP-mediated replication fork reversal
Chaudhuri, A. R., Hashimoto, Y., Herrador, R., Neelsen, K. J., Fachinetti, D., Bermejo, R., Cocito, A., Costanzo, V., & Lopes, M. (2012) · Nature Structural & Molecular Biology · doi:10.1038/nsmb.2258 · Cited by 524
Self-citationReplication fork reversal in eukaryotes: from dead end to dynamic response
Neelsen, K. J., & Lopes, M. (2015) · Nature Reviews Molecular Cell Biology · doi:10.1038/nrm3935 · Cited by 523
Self-citationA model for replication repair in mammalian cells
Higgins, N. P., Kato, K., & Strauss, B. S. (1976) · Journal of Molecular Biology · doi:10.1016/0022-2836(76)90156-x · Cited by 444
Histone H1 couples initiation and amplification of ubiquitin signalling after DNA damage
Thorslund, T., Ripplinger, A., Hoffmann, S., Wild, T., Uckelmann, M., Villumsen, B. H., Narita, T., Sixma, T. K., Choudhary, C., Bekker‐Jensen, S., et al. (2015) · Nature · doi:10.1038/nature15401 · Cited by 438
Betous, R., Mason, A. C., Rambo, R. P., Bansbach, C. E., Badu-Nkansah, A., Sirbu, B. M., Eichman, B. F., & Cortez, D. (2012) · Genes & Development · doi:10.1101/gad.178459.111 · Cited by 313
Self-citation
Cited by
Sorted by citations
DNA double-strand break repair-pathway choice in somatic mammalian cells
Scully, R., Panday, A., Elango, R., & Willis, N. A. (2019) · Nature Reviews Molecular Cell Biology · doi:10.1038/s41580-019-0152-0 · Cited by 1,532
Hallmarks of DNA replication stress
Saxena, S., & Zou, L. (2022) · Molecular Cell · doi:10.1016/j.molcel.2022.05.004 · Cited by 443
Mechanisms of Oncogene-Induced Replication Stress: Jigsaw Falling into Place
Kotsantis, P., Petermann, E., & Boulton, S. J. (2018) · Cancer Discovery · doi:10.1158/2159-8290.cd-17-1461 · Cited by 416
Taglialatela, A., Álvarez, S., Leuzzi, G., Sannino, V., Ranjha, L., Huang, J., Madubata, C. J., Anand, R., Levy, B., Rabadán, R., et al. (2017) · Molecular Cell · doi:10.1016/j.molcel.2017.09.036 · Cited by 407
Self-citationReplication fork reversal triggers fork degradation in BRCA2-defective cells
Mijic, S., Zellweger, R., Chappidi, N., Berti, M., Jacobs, K., Mutreja, K., Ursich, S., Chaudhuri, A. R., Nussenzweig, A., Janščák, P., et al. (2017) · Nature Communications · doi:10.1038/s41467-017-01164-5 · Cited by 380
Self-citationRPA and RAD51: fork reversal, fork protection, and genome stability
Bhat, K. P., & Cortez, D. (2018) · Nature Structural & Molecular Biology · doi:10.1038/s41594-018-0075-z · Cited by 363
Self-citationThe plasticity of DNA replication forks in response to clinically relevant genotoxic stress
Berti, M., Cortez, D., & Lopes, M. (2020) · Nature Reviews Molecular Cell Biology · doi:10.1038/s41580-020-0257-5 · Cited by 343
Self-citationRanjha, L., Howard, S. M., & Ćejka, P. (2018) · Chromosoma · doi:10.1007/s00412-017-0658-1 · Cited by 357
Human PCNA Structure, Function and Interactions
Magaña, A. G., & Blanco, F. J. (2020) · Biomolecules · doi:10.3390/biom10040570 · Cited by 288
Replication Fork Reversal: Players and Guardians
Quinet, A., Lemacon, D. S., & Vindigni, A. (2017) · Molecular Cell · doi:10.1016/j.molcel.2017.11.022 · Cited by 287
Replication-Coupled DNA Repair
Cortez, D. (2019) · Molecular Cell · doi:10.1016/j.molcel.2019.04.027 · Cited by 250
Self-citationBai, G., Kermi, C., Stoy, H., Schiltz, C. J., Bacal, J., Zaino, A. M., Hadden, M. K., Eichman, B. F., Lopes, M., & Cimprich, K. A. (2020) · Molecular Cell · doi:10.1016/j.molcel.2020.04.031 · Cited by 198
Self-citationLiao, H., Ji, F., Helleday, T., & Ying, S. (2018) · EMBO Reports · doi:10.15252/embr.201846263 · Cited by 197
USP1 Is Required for Replication Fork Protection in BRCA1-Deficient Tumors
Lim, K. S., Li, H., Roberts, E. A., Gaudiano, E. F., Clairmont, C. S., Sambel, L. A., Ponnienselvan, K., Liu, J., Yang, C., Kozono, D., et al. (2018) · Molecular Cell · doi:10.1016/j.molcel.2018.10.045 · Cited by 174
Chappidi, N., Naščáková, Z., Boleslavska, B., Zellweger, R., Işık, E., Andrš, M., Menon, S., Dobrovolná, J., Pogliano, C. B., Matos, J., et al. (2019) · Molecular Cell · doi:10.1016/j.molcel.2019.10.026 · Cited by 159
Self-citationAdvances in understanding DNA processing and protection at stalled replication forks
Rickman, K. A., & Smogorzewska, A. (2019) · The Journal of Cell Biology · doi:10.1083/jcb.201809012 · Cited by 160
ATR Protects the Genome against R Loops through a MUS81-Triggered Feedback Loop
Matos, D. A., Zhang, J., Ouyang, J., Nguyen, H. D., Genois, M., & Zou, L. (2019) · Molecular Cell · doi:10.1016/j.molcel.2019.10.010 · Cited by 149
Mutreja, K., Krietsch, J., Hess, J., Ursich, S., Berti, M., Roessler, F. K., Zellweger, R., Patra, M., Gasser, G., & Lopes, M. (2018) · Cell Reports · doi:10.1016/j.celrep.2018.08.019 · Cited by 131
Self-citationLeveraging the replication stress response to optimize cancer therapy
Cybulla, E., & Vindigni, A. (2022) · Nature reviews. Cancer · doi:10.1038/s41568-022-00518-6 · Cited by 140
Thakar, T., Leung, W., Nicolae, C. M., Clements, K. E., Shen, B., Bielinsky, A., & Moldovan, G. (2020) · Nature Communications · doi:10.1038/s41467-020-16096-w · Cited by 135
Non-enzymatic roles of human RAD51 at stalled replication forks
Mason, J. M., Chan, Y., Weichselbaum, R. W., & Bishop, D. K. (2019) · Nature Communications · doi:10.1038/s41467-019-12297-0 · Cited by 125
Nayak, S. U., Calvo, J. A., Cong, K., Peng, M., Berthiaume, E. A., Jackson, J., Zaino, A. M., Vindigni, A., Hadden, M. K., & Cantor, S. B. (2020) · Science Advances · doi:10.1126/sciadv.aaz7808 · Cited by 119
USP7 Is a Master Regulator of Genome Stability
Valles, G. J., Bezsonova, I., Woodgate, R., & Ashton, N. W. (2020) · Frontiers in Cell and Developmental Biology · doi:10.3389/fcell.2020.00717 · Cited by 114
Spies, J., Lukas, C., Somyajit, K., Rask, M., Lukas, J., & Neelsen, K. J. (2019) · Nature Cell Biology · doi:10.1038/s41556-019-0293-6 · Cited by 117
To skip or not to skip: choosing repriming to tolerate DNA damage
Quinet, A., Tirman, S., Cybulla, E., Meroni, A., & Vindigni, A. (2021) · Molecular Cell · doi:10.1016/j.molcel.2021.01.012 · Cited by 109
Stabilization of Reversed Replication Forks by Telomerase Drives Telomere Catastrophe
Margalef, P., Kotsantis, P., Borel, V., Bellelli, R., Panier, S., & Boulton, S. J. (2017) · Cell · doi:10.1016/j.cell.2017.11.047 · Cited by 109
CARM1 regulates replication fork speed and stress response by stimulating PARP1
Genois, M., Gagné, J., Yasuhara, T., Jackson, J., Saxena, S., Langelier, M.-F., Ahel, I., Bedford, M. T., Pascal, J. M., Vindigni, A., et al. (2021) · Molecular Cell · doi:10.1016/j.molcel.2020.12.010 · Cited by 114
Schmid, J. A., Berti, M., Walser, F., Raso, M. C., Schmid, F. M., Krietsch, J., Stoy, H., Zwicky, K., Ursich, S., Freire, R., et al. (2018) · Molecular Cell · doi:10.1016/j.molcel.2018.07.011 · Cited by 105
Self-citationSequential role of RAD51 paralog complexes in replication fork remodeling and restart
Berti, M., Teloni, F., Mijic, S., Ursich, S., Fuchs, J., Palumbieri, M. D., Krietsch, J., Schmid, J. A., Garcin, E. B., Gon, S., et al. (2020) · Nature Communications · doi:10.1038/s41467-020-17324-z · Cited by 104
Self-citationLiu, W., Krishnamoorthy, A., Zhao, R., & Cortez, D. (2020) · Science Advances · doi:10.1126/sciadv.abc3598 · Cited by 99
Self-citationHow do mutations affecting the breast cancer genes BRCA1 and BRCA2 cause cancer susceptibility?
Venkitaraman, A. R. (2019) · DNA repair · doi:10.1016/j.dnarep.2019.102668 · Cited by 111
RAD51 bypasses the CMG helicase to promote replication fork reversal
Liu, W., Saito, Y., Jackson, J., Bhowmick, R., Kanemaki, M. T., Vindigni, A., & Cortez, D. (2023) · Science · doi:10.1126/science.add7328 · Cited by 99
Self-citationMechanisms of DNA Damage Tolerance: Post-Translational Regulation of PCNA
Leung, W., Baxley, R. M., Moldovan, G., & Bielinsky, A. (2018) · Genes · doi:10.3390/genes10010010 · Cited by 100
RADX Modulates RAD51 Activity to Control Replication Fork Protection
Bhat, K. P., Krishnamoorthy, A., Dungrawala, H., Garcin, E. B., Modesti, M., & Cortez, D. (2018) · Cell Reports · doi:10.1016/j.celrep.2018.06.061 · Cited by 97
Self-citationMucormycosis: risk factors, diagnosis, treatments, and challenges during COVID-19 pandemic
Sharma, A., & Goel, A. (2022) · Folia Microbiologica · doi:10.1007/s12223-021-00934-5 · Cited by 104
Maneuvers on PCNA Rings during DNA Replication and Repair
Slade, D. (2018) · Genes · doi:10.3390/genes9080416 · Cited by 94
RAD52 Prevents Excessive Replication Fork Reversal and Protects from Nascent Strand Degradation
Malacaria, E., Pugliese, G. M., Honda, M., Marabitti, V., Aiello, F. A., Spies, M., Franchitto, A., & Pichierri, P. (2018) · Nature Communications · doi:10.1038/s41467-019-09196-9 · Cited by 92
Role of the Mre11 Complex in Preserving Genome Integrity
Oh, J., & Symington, L. S. (2018) · Genes · doi:10.3390/genes9120589 · Cited by 90
Excessive reactive oxygen species induce transcription-dependent replication stress
Andrš, M., Stoy, H., Boleslavska, B., Chappidi, N., Kanagaraj, R., Naščáková, Z., Menon, S., Rao, S., Oravetzova, A., Dobrovolná, J., et al. (2023) · Nature Communications · doi:10.1038/s41467-023-37341-y · Cited by 83
Self-citationThe ZATT-TOP2A-PICH Axis Drives Extensive Replication Fork Reversal to Promote Genome Stability
Tian, T., Bu, M., Chen, X., Ding, L., Yang, Y., Han, J., Feng, X., Xu, P., Liu, T., Ying, S., et al. (2020) · Molecular Cell · doi:10.1016/j.molcel.2020.11.007 · Cited by 82
Self-citationDirect visualization of transcription-replication conflicts reveals post-replicative DNA:RNA hybrids
Stoy, H., Zwicky, K., Kuster, D., Lang, K. S., Krietsch, J., Crossley, M. P., Schmid, J. A., Cimprich, K. A., Merrikh, H., & Lopes, M. (2023) · Nature Structural & Molecular Biology · doi:10.1038/s41594-023-00928-6 · Cited by 82
Self-citationKang, Z., Fu, P., Alcivar, A. L., Fu, H., Redon, C. E., Foo, T. K., Zuo, Y., Ye, C., Baxley, R. M., Madireddy, A., et al. (2021) · Nature Communications · doi:10.1038/s41467-021-26227-6 · Cited by 83
The ubiquitin ligase RFWD3 is required for translesion DNA synthesis
Gallina, I., Hendriks, I. A., Hoffmann, S., Larsen, N. B., Johansen, J., Colding-Christensen, C. S., Schubert, L. A., Sellés‐Baiget, S., Fábián, Z., Kühbacher, U., et al. (2020) · Molecular Cell · doi:10.1016/j.molcel.2020.11.029 · Cited by 78
Wassing, I. E., & Esashi, F. (2020) · Seminars in Cell and Developmental Biology · doi:10.1016/j.semcdb.2020.08.010 · Cited by 84
A fork in the road: Where homologous recombination and stalled replication fork protection part ways
Tye, S., Ronson, G. E., & Morris, J. R. (2020) · Seminars in Cell and Developmental Biology · doi:10.1016/j.semcdb.2020.07.004 · Cited by 80
Lim, P. X., Zaman, M., Feng, W., & Jasin, M. (2024) · Molecular Cell · doi:10.1016/j.molcel.2023.12.025 · Cited by 81
Role of K63-linked ubiquitination in cancer
Cao, L., Liu, X., Zheng, B., Xing, C., & Liu, J. (2022) · Cell Death Discovery · doi:10.1038/s41420-022-01204-0 · Cited by 75
Kim, J. J., Lee, S. Y., Choi, J. H., Woo, H. G., Xhemalçe, B., & Miller, K. M. (2020) · Molecular Cell · doi:10.1016/j.molcel.2020.08.018 · Cited by 71
Clements, K. E., Thakar, T., Nicolae, C. M., Liang, X., Wang, H., & Moldovan, G. (2018) · Nucleic Acids Research · doi:10.1093/nar/gky657 · Cited by 71
DNA damage tolerance in stem cells, ageing, mutagenesis, disease and cancer therapy
Pilzecker, B., Buoninfante, O. A., & Jacobs, H. (2019) · Nucleic Acids Research · doi:10.1093/nar/gkz531 · Cited by 76
Self-citationThe emerging determinants of replication fork stability
Thakar, T., & Moldovan, G. (2021) · Nucleic Acids Research · doi:10.1093/nar/gkab344 · Cited by 71
Translesion polymerase kappa-dependent DNA synthesis underlies replication fork recovery
Tonzi, P., Yin, Y., Lee, C. W. T., Rothenberg, E., & Huang, T. T. (2018) · eLife · doi:10.7554/elife.41426 · Cited by 69
Barbour, H., Nkwe, N. S., Estavoyer, B., Messmer, C., Gushul-Leclaire, M., Villot, R., Uriarte, M., Boulay, K., Hlayhel, S., Farhat, B., et al. (2023) · iScience · doi:10.1016/j.isci.2023.106276 · Cited by 70
Making choices: DNA replication fork recovery mechanisms
Kondratick, C. M., Washington, M. T., & Spies, M. (2020) · Seminars in Cell and Developmental Biology · doi:10.1016/j.semcdb.2020.10.001 · Cited by 74
Lyu, X., Lei, K.-H., Sang, P. B., Shiva, O., Chastain, M., Chi, P., & Chai, W.-H. (2020) · EMBO Journal · doi:10.15252/embj.2019103654 · Cited by 54
CHK1 phosphorylates PRIMPOL to promote replication stress tolerance
Mehta, K. P. M., Thada, V., Zhao, R., Krishnamoorthy, A., Leser, M., Rose, K. L., & Cortez, D. (2022) · Science Advances · doi:10.1126/sciadv.abm0314 · Cited by 64
Self-citationResistance to PARP Inhibitors: Lessons from Preclinical Models of BRCA-Associated Cancer
Gogola, E., Rottenberg, S., & Jonkers, J. (2018) · Annual Review of Cancer Biology · doi:10.1146/annurev-cancerbio-030617-050232 · Cited by 66
Revisiting the BRCA-pathway through the lens of replication gap suppression
Cantor, S. B. (2021) · DNA repair · doi:10.1016/j.dnarep.2021.103209 · Cited by 63
PCNA Loaders and Unloaders—One Ring That Rules Them All
Arbel, M., Choudhary, K., Tfilin, O., & Kupiec, M. (2021) · Genes · doi:10.3390/genes12111812 · Cited by 62
Mechanisms and regulation of replication fork reversal
Adolph, M. B., & Cortez, D. (2024) · DNA repair · doi:10.1016/j.dnarep.2024.103731 · Cited by 63
Self-citationUbe2V2 Is a Rosetta Stone Bridging Redox and Ubiquitin Codes, Coordinating DNA Damage Responses
Zhao, Y., Long, M. J. C., Wang, Y., Zhang, S., & Aye, Y. (2018) · ACS Central Science · doi:10.1021/acscentsci.7b00556 · Cited by 60
The MCM8/9 complex: A recent recruit to the roster of helicases involved in genome maintenance
Griffin, W. C., & Trakselis, M. A. (2019) · DNA repair · doi:10.1016/j.dnarep.2019.02.003 · Cited by 50
SLX4: multitasking to maintain genome stability
Guervilly, J.-H., & Gaillard, P.-H. L. (2018) · Critical Reviews in Biochemistry and Molecular Biology · doi:10.1080/10409238.2018.1488803 · Cited by 54
ATAD5 promotes replication restart by regulating RAD51 and PCNA in response to replication stress
Park, S. H., Kang, N., Song, E., Wie, M., Lee, E. A., Hwang, S., Lee, D., Ra, J. S., Park, I. B., Park, J., et al. (2019) · Nature Communications · doi:10.1038/s41467-019-13667-4 · Cited by 55
DNA-PKcs promotes fork reversal and chemoresistance
Dibitetto, D., Marshall, S., Sanchi, A., Liptay, M., Badar, J., Lopes, M., Rottenberg, S., & Smolka, M. B. (2022) · Molecular Cell · doi:10.1016/j.molcel.2022.08.028 · Cited by 48
Self-citationRemoval of RTF2 from Stalled Replisomes Promotes Maintenance of Genome Integrity
Kottemann, M. C., Conti, B. A., Lach, F. P., & Smogorzewska, A. (2018) · Molecular Cell · doi:10.1016/j.molcel.2017.11.035 · Cited by 49
Replication Fork Reversal and Protection
Qiu, S., Jiang, G., Cao, L., & Huang, J. (2021) · Frontiers in Cell and Developmental Biology · doi:10.3389/fcell.2021.670392 · Cited by 47
Self-citationEukaryotic clamp loaders and unloaders in the maintenance of genome stability
Lee, K., & Park, S. H. (2020) · Experimental & Molecular Medicine · doi:10.1038/s12276-020-00533-3 · Cited by 48
Dhoonmoon, A., Nicolae, C. M., & Moldovan, G. (2022) · Nature Communications · doi:10.1038/s41467-022-32756-5 · Cited by 50
Boleslavska, B., Oravetzova, A., Shukla, K., Naščáková, Z., Ibini, O., Hašanová, Z., Andrš, M., Kanagaraj, R., Dobrovolná, J., & Janščák, P. (2022) · Nucleic Acids Research · doi:10.1093/nar/gkac1116 · Cited by 50
Freedom to err: The expanding cellular functions of translesion DNA polymerases
Paniagua, I., & Jacobs, J. J. L. (2023) · Molecular Cell · doi:10.1016/j.molcel.2023.07.008 · Cited by 50
Time for remodeling: SNF2-family DNA translocases in replication fork metabolism and human disease
Joseph, S. A., Taglialatela, A., Leuzzi, G., Huang, J., Cuella-Martin, R., & Ciccia, A. (2020) · DNA repair · doi:10.1016/j.dnarep.2020.102943 · Cited by 47
Self-citationDNA-damage tolerance through PCNA ubiquitination and sumoylation
Fan, L., Bi, T., Wang, L., & Xiao, W. (2020) · Biochemical Journal · doi:10.1042/bcj20190579 · Cited by 40
Zhang, J., Bellani, M., James, R., Pokharel, D., Zhang, Y.-Q., Reynolds, J., McNee, G. S., Jackson, A., Stewart, G., & Seidman, M. (2020) · Nature Communications · doi:10.1038/s41467-020-17449-1 · Cited by 39
Homologous Recombination as a Fundamental Genome Surveillance Mechanism during DNA Replication
Spies, J., Polášek-Sedláčková, H., Lukas, J., & Somyajit, K. (2021) · Genes · doi:10.3390/genes12121960 · Cited by 47
Wong, R. P. C., Petriukov, K. S., & Ulrich, H. D. (2021) · DNA repair · doi:10.1016/j.dnarep.2021.103163 · Cited by 43
Beyond Kinases: Targeting Replication Stress Proteins in Cancer Therapy
Baillie, K. E., & Stirling, P. C. (2020) · Trends in cancer · doi:10.1016/j.trecan.2020.10.010 · Cited by 42
CDC7 kinase promotes MRE11 fork processing, modulating fork speed and chromosomal breakage
Rainey, M. D., Quinlan, A., Cazzaniga, C., Mijic, S., Martella, O., Krietsch, J., Göder, A., Lopes, M., & Santocanale, C. (2020) · EMBO Reports · doi:10.15252/embr.201948920 · Cited by 35
Self-citationThe Replication Stress Response on a Narrow Path Between Genomic Instability and Inflammation
Técher, H., & Pasero, P. (2021) · Frontiers in Cell and Developmental Biology · doi:10.3389/fcell.2021.702584 · Cited by 37
Halder, S., Ranjha, L., Taglialatela, A., Ciccia, A., & Ćejka, P. (2022) · Nucleic Acids Research · doi:10.1093/nar/gkac583 · Cited by 39
Self-citationPCNA cycling dynamics during DNA replication and repair in mammals
Kang, S., Yoo, J., & Myung, K. (2024) · Trends in Genetics · doi:10.1016/j.tig.2024.02.006 · Cited by 38
Tonzi, P., & Huang, T. T. (2019) · DNA repair · doi:10.1016/j.dnarep.2019.03.016 · Cited by 37
DNA Damage Tolerance Pathways in Human Cells: A Potential Therapeutic Target
Ler, A. A. L., & Carty, M. P. (2022) · Frontiers in Oncology · doi:10.3389/fonc.2021.822500 · Cited by 37
Replication stress at microsatellites causes DNA double-strand breaks and break-induced replication
Gadgil, R. Y., Romer, E. J., Goodman, C. C., Rider, S. D., Damewood, F. J., Barthelemy, J., Shin‐ya, K., Hanenberg, H., & Leffak, M. (2020) · Journal of Biological Chemistry · doi:10.1074/jbc.ra120.013495 · Cited by 39
Stress-triggered hematopoietic stem cell proliferation relies on PrimPol-mediated repriming
Jacobs, K., Doerdelmann, C., Krietsch, J., González‐Acosta, D., Mathis, N., Kushinsky, S., Guarino, E., Gómez‐Escolar, C., Martínez, D., Schmid, J. A., et al. (2022) · Molecular Cell · doi:10.1016/j.molcel.2022.09.009 · Cited by 37
Self-citationLooping out of control: R-loops in transcription-replication conflict
Kumar, C., & Remus, D. (2023) · Chromosoma · doi:10.1007/s00412-023-00804-8 · Cited by 34
Palumbieri, M. D., Merigliano, C., González‐Acosta, D., Kuster, D., Krietsch, J., Stoy, H., von Känel, T., Ulferts, S., Welter, B., Frey, J., et al. (2023) · Nature Communications · doi:10.1038/s41467-023-43183-5 · Cited by 34
Self-citationShin, S., Hyun, K., Kim, J., & Hohng, S. (2018) · Cell Reports · doi:10.1016/j.celrep.2018.04.029 · Cited by 33
Smarcal1 and Zranb3 Protect Replication Forks from Myc-Induced DNA Replication Stress
Puccetti, M. V., Adams, C. M., Kushinsky, S., & Eischen, C. M. (2019) · Cancer Research · doi:10.1158/0008-5472.can-18-2705 · Cited by 35
WRNIP1 Protects Reversed DNA Replication Forks from SLX4-Dependent Nucleolytic Cleavage
Porębski, B., Wild, S., Kummer, S., Scaglione, S., Gaillard, P.-H. L., & Gari, K. (2019) · iScience · doi:10.1016/j.isci.2019.10.010 · Cited by 30
Mechanisms of direct replication restart at stressed replisomes
Conti, B. A., & Smogorzewska, A. (2020) · DNA repair · doi:10.1016/j.dnarep.2020.102947 · Cited by 34
Replication fork uncoupling causes nascent strand degradation and fork reversal
Kavlashvili, T., Liu, W., Mohamed, T. M., Cortez, D., & Dewar, J. M. (2023) · Nature Structural & Molecular Biology · doi:10.1038/s41594-022-00871-y · Cited by 31
Self-citationEmerging functions of Fanconi anemia genes in replication fork protection pathways
Kolinjivadi, A. M., Crismani, W., & Ngeow, J. Y. Y. (2020) · Human Molecular Genetics · doi:10.1093/hmg/ddaa087 · Cited by 29
Role of Translesion DNA Synthesis in the Metabolism of Replication-associated Nascent Strand Gaps
Khatib, J. B., Nicolae, C. M., & Moldovan, G. (2023) · Journal of Molecular Biology · doi:10.1016/j.jmb.2023.168275 · Cited by 30
Cavin3 released from caveolae interacts with BRCA1 to regulate the cellular stress response
McMahon, K., Stroud, D. A., Gambin, Y., Tillu, V. A., Bastiani, M., Sierecki, E., Polinkovsky, M. E., Hall, T. E., Gomez, G. A., Wu, Y., et al. (2021) · eLife · doi:10.7554/elife.61407 · Cited by 30
The levels of p53 govern the hierarchy of DNA damage tolerance pathway usage
Castaño, B. A., Schorer, S., Guo, Y., Calzetta, N. L., Gottifredi, V., Wiesmüller, L., & Biber, S. (2024) · Nucleic Acids Research · doi:10.1093/nar/gkae061 · Cited by 29
Replication Fork Remodeling and Therapy Escape in DNA Damage Response-Deficient Cancers
Liptay, M., Barbosa, J. S., & Rottenberg, S. (2020) · Frontiers in Oncology · doi:10.3389/fonc.2020.00670 · Cited by 30
Ubiquitylation at Stressed Replication Forks: Mechanisms and Functions
Mirsanaye, A. S., Typas, D., & Mailand, N. (2021) · Trends in Cell Biology · doi:10.1016/j.tcb.2021.01.008 · Cited by 28
Critical DNA damaging pathways in tumorigenesis
Kloeber, J. A., & Lou, Z. (2021) · Seminars in Cancer Biology · doi:10.1016/j.semcancer.2021.04.012 · Cited by 29
Sidorova, J. M. (2017) · Cell Stress · doi:10.15698/cst2017.12.114 · Cited by 29
Metadata
- Authors
- Vujanovic, M., Krietsch, J., Raso, M. C., Terraneo, N., Zellweger, R., Schmid, J. A., Taglialatela, A., Huang, J.-W., Holland, C. L., Zwicky, K., Herrador, R., Jacobs, H., Cortez, D., Ciccia, A., Penengo, L., & Lopes, M.
- Affiliations
- University of Zurich (CH)
- Columbia University Irving Medical Center (US)
- Vanderbilt University (US)
- The Netherlands Cancer Institute (NL)
- Corresponding author
- Lopes, Massimo
- ORCID
- Venue
- Molecular Cell
- Publisher
- Elsevier BV
- Published
- 2017-09
- Volume
- 67
- Issue
- 5
- Pages
- 882-890.e5
- ISSN
- 1097-2765 (ISSN-L)
- PMC
- PMC5594246
- OpenAlex
- W2751450140
- Cited by
- 227
- References
- 39
- Citations by year
- 2026: 10 · 2025: 19 · 2024: 25 · 2023: 27 · 2022: 23 · 2021: 28 · 2020: 35 · 2019: 26 · 2018: 27 · 2017: 7
- FWCI
- 10.62
- Type
- journal article
- Language
- en
- Open access
- hybrid
- doi.org
- Licence
- Locations
- Molecular Cell (publishedVersion, cc-by-nc-nd)
- Europe PMC (PubMed Central) (publishedVersion, cc-by-nc-nd)
- PubMed Central (publishedVersion, cc-by-nc-nd)
- PubMed (publishedVersion)
- DORA PSI (Paul Scherrer Institute) (submittedVersion, cc-by-nc-nd)
- Funders
- SNF (31003A_146924, 31003A_169959, 31003A_166370)
- ERC Consolidator (617102)
- Helmut Horten
- NIH (R01CA197774, GM116616)
- KWF (NKI-2012-5243)
- ZonMW Top (91213018)
- Topics
- Life Sciences › Biochemistry, Genetics and Molecular Biology › Molecular Biology › DNA Repair Mechanisms
- Life Sciences › Biochemistry, Genetics and Molecular Biology › Molecular Biology › Ubiquitin and proteasome pathways
- Life Sciences › Biochemistry, Genetics and Molecular Biology › Molecular Biology › Epigenetics and DNA Methylation
- Keywords
- replication fork reversal, DNA damage tolerance, ZRANB3, DNA translocase, Ubc13, K63-linked polyubiquitin, template switching, chromosome breakage, cancer chemotherapy
- MeSH terms
- Animals, DNA Damage, DNA Replication, DNA Helicases, DNA, Neoplasm, Humans, Kinetics, Mutation, Neoplasms, Transfection, Replication Origin, Proliferating Cell Nuclear Antigen, Polyubiquitin, RNA Interference, Ubiquitin-Conjugating Enzymes, HCT116 Cells, Mice, Ubiquitination, HEK293 Cells, CRISPR-Cas Systems
About these checks
Registry, retraction, Cites and statistics results are computed, not judged, with one exception: a printed reference that no index lists is read once by a model before it counts as a citation error. Claims are extracted by a model and kept only when their quote appears verbatim in the text; each cited source is then checked, with a model’s help, for whether it says what the claim relies on. Those verdicts can be wrong — read the claim’s quote and the cited source before relying on one.
Statistics and arithmetic are recomputed, not judged.
Confidence bands are shown only for fields calibrated on our annotated test set. None is calibrated yet, so no band is shown.
What counts as a claim ›How we measure confidence ›How we check this ›
Are you an author, or do you see a problem with this page? Request a review
