Cited by 65

The DOI matches its Crossref record; 2 of the 2 references it cites were found in a registry or an index.

MiR-132 controls pancreatic beta cell proliferation and survival through Pten/Akt/Foxo3 signaling

Mziaut, Hassan, Henniger, Georg, Ganss, Katharina, Hempel, Sebastian, Wolk, Steffen, McChord, Johanna, Chowdhury, Kamal, Ravassard, Philippe, Knoch, Klaus-Peter, Krautz, Christian, Weitz, Jürgen, Grützmann, Robert, Pilarsky, Christian, Solimena, Michele, Kersting, Stephan·2020·Molecular Metabolism

Overview

The claims and statistics of this paper haven’t been checked yet.

Run the check — free, no account needed. It reads the open-access text and checks the sources it cites.

A few free checks a day · papers already verified open instantly · results are public

Integrity signals

Registry

Crossref · 10.1016/j.molmet.2019.11.012

Cites

2 of 2 references verified0 citation errors · 0 not checkable

Statistics

Figures

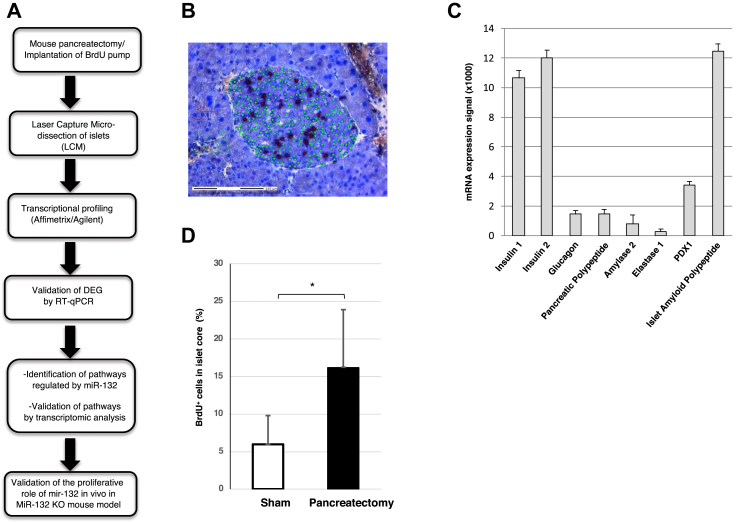
Figure 1 Quantification of BrdU+cells in islets of partially pancreatectomized mice. (A) Overview of the experimental design. (B) A tissue section of the remnant pancreas excised 1 week after partial pancreatectomy stained with cresyl violet to reveal the islet core. The tissue was labeled with DAPI (green) and anti-BrdU antibodies (black) to detect the cell nuclei and replicating cells, respectively. (C) Enrichment of beta cell-specific markers shown by Q-PCR of mRNA extracted from laser capture microdissected islets. (D) Percentage of BrdU+ cells in the islet cores. The analysis included 7 mice, of which 4 were sham-operated and 3 were partially pancreatectomized. 40 slices/group were counted for BrdU+ cells. *p < 0.05.
Figure 1 Quantification of BrdU+cells in islets of partially pancreatectomized mice. (A) Overview of the experimental design. (B) A tissue section of the remnant pancreas excised 1 week after partial pancreatectomy stained with cresyl violet to reveal the islet core. The tissue was labeled with DAPI (green) and anti-BrdU antibodies (black) to detect the cell nuclei and replicating cells, respectively. (C) Enrichment of beta cell-specific markers shown by Q-PCR of mRNA extracted from laser capture microdissected islets. (D) Percentage of BrdU+ cells in the islet cores. The analysis included 7 mice, of which 4 were sham-operated and 3 were partially pancreatectomized. 40 slices/group were counted for BrdU+ cells. *p < 0.05.CC BY-NC-ND · PubMed Central
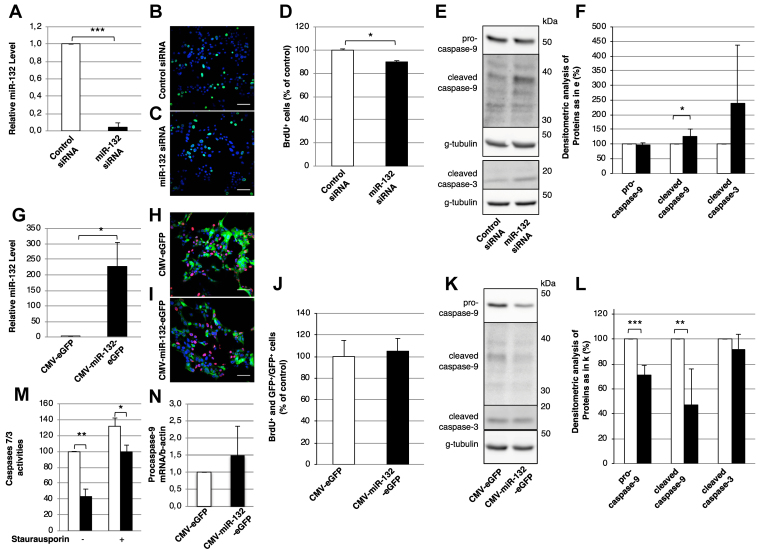
Figure 2 MiR-132 regulates the proliferation and caspase levels in MIN6 cells. (A) Levels of miR-132 in MIN6 cells treated with control (white bar) or miR-132 (black bar) siRNA as determined by RT-PCR. (B-C) Representative confocal images of BrdU+ cells (green) in MIN6 cells treated with control (B) or miR-132 (C) siRNA. (D) Number of BrdU+ in control vs miR-132 depleted MIN6 cells counted from images as in (B-C). (E) Representative immunoblots for pro- and cleaved caspase-9, cleaved caspase-3, and γ-tubulin as loading controls in extracts of MIN6 cells treated with control or miR-132 siRNA. (F) Densitometric quantification of immunoblots as in (E). White bars: control siRNA-treated cells; black bars: miR-132 siRNA-treated cells. (G) Expression levels of miR-132 in MIN6 cells transduced with adenovirus vectors for the co-expression of miR-132 and eGFP (black bar) or eGFP alone (white bar) as detected by RT-PCR. (H-I) Representative confocal images of BrdU+ (red) and eGFP+ (green) MIN6 cells transduced with adenovirus vectors for the co-expression of miR-132 and eGFP (i) or eGFP alone. Nuclei were detected with DAPI (blue). (J) Number of BrdU+ and GFP+ cells normalized to GFP+ cells in MIN6 cells transduced with eGFP (white bars) or miR-132 and eGFP (black bars) counted from images as in (H-I). (K) Representative immunoblots for pro- and cleaved caspase-9, cleaved caspase-3, and γ-tubulin as loading controls in extracts of MIN6 cells transduced with adenovirus vectors for the co-expression of miR-132 and eGFP or eGFP alone. (L) Densitometric quantification of immunoblots as in (K). (M) caspase-3/7 enzymatic activity was assayed by measuring the cleavage of Z-DEVD-R110 substrate via spectrophotometry as described in the materials and methods section. (N) Expression of procaspase-9 mRNA in MIN6 cells overexpressing miR-132 (white bar) and eGFP (black bar) as measured by RT-PCR. n = 3.
Figure 2 MiR-132 regulates the proliferation and caspase levels in MIN6 cells. (A) Levels of miR-132 in MIN6 cells treated with control (white bar) or miR-132 (black bar) siRNA as determined by RT-PCR. (B-C) Representative confocal images of BrdU+ cells (green) in MIN6 cells treated with control (B) or miR-132 (C) siRNA. (D) Number of BrdU+ in control vs miR-132 depleted MIN6 cells counted from images as in (B-C). (E) Representative immunoblots for pro- and cleaved caspase-9, cleaved caspase-3, and γ-tubulin as loading controls in extracts of MIN6 cells treated with control or miR-132 siRNA. (F) Densitometric quantification of immunoblots as in (E). White bars: control siRNA-treated cells; black bars: miR-132 siRNA-treated cells. (G) Expression levels of miR-132 in MIN6 cells transduced with adenovirus vectors for the co-expression of miR-132 and eGFP (black bar) or eGFP alone (white bar) as detected by RT-PCR. (H-I) Representative confocal images of BrdU+ (red) and eGFP+ (green) MIN6 cells transduced with adenovirus vectors for the co-expression of miR-132 and eGFP (i) or eGFP alone. Nuclei were detected with DAPI (blue). (J) Number of BrdU+ and GFP+ cells normalized to GFP+ cells in MIN6 cells transduced with eGFP (white bars) or miR-132 and eGFP (black bars) counted from images as in (H-I). (K) Representative immunoblots for pro- and cleaved caspase-9, cleaved caspase-3, and γ-tubulin as loading controls in extracts of MIN6 cells transduced with adenovirus vectors for the co-expression of miR-132 and eGFP or eGFP alone. (L) Densitometric quantification of immunoblots as in (K). (M) caspase-3/7 enzymatic activity was assayed by measuring the cleavage of Z-DEVD-R110 substrate via spectrophotometry as described in the materials and methods section. (N) Expression of procaspase-9 mRNA in MIN6 cells overexpressing miR-132 (white bar) and eGFP (black bar) as measured by RT-PCR. n = 3.CC BY-NC-ND · PubMed Central
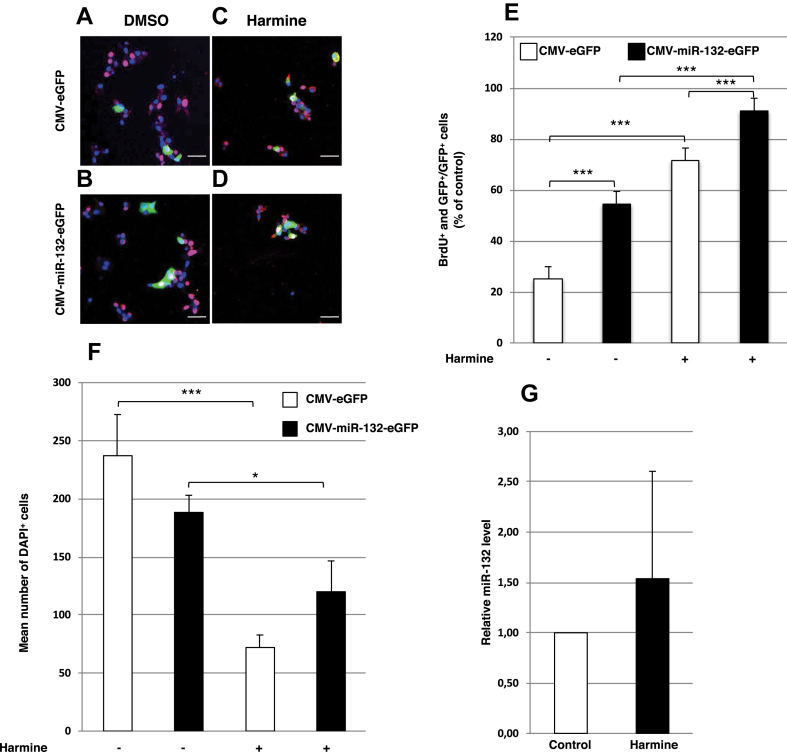
Figure 3 Effect of miR-132 on beta cell proliferation in EndoC-βH1 cells. (A–D) Representative confocal images of BrdU+ (red) and eGFP+ (green) in EndoC-βH1 cells transduced with adenovirus vectors for control eGFP (A and C) or miR-132-eGFP (B and D) expression either in 1.4 mM DMSO (A and B) or 10 μM harmine (C and D). Nuclei were detected with DAPI (blue). (E) BrdU+ and GFP+ EndoC-βH1 cells normalized to GFP+ cells in control or miR-132 overexpressing cells treated as described in (A-D). (F) Mean number of DAPI+ cells of EndoC-βH1 cells/field transduced as described in (A–D). White bars: cells transduced with CMV-eGFP adenovirus vector; black bars: cells transduced with CMV-miR-132/eGFP adenovirus vector. (G) Relative miR-132 level in EndoC-βH1 cells treated with 1.4 mM DMSO or 10 μM harmine. Data shown in (A–D) were collected from 15 to 20 images with 1,000–4,000 cells for each condition. Scale bars in (A–D) = 50 μm *p < 0.05, **p < 0.01, **p < 0.001.
Figure 3 Effect of miR-132 on beta cell proliferation in EndoC-βH1 cells. (A–D) Representative confocal images of BrdU+ (red) and eGFP+ (green) in EndoC-βH1 cells transduced with adenovirus vectors for control eGFP (A and C) or miR-132-eGFP (B and D) expression either in 1.4 mM DMSO (A and B) or 10 μM harmine (C and D). Nuclei were detected with DAPI (blue). (E) BrdU+ and GFP+ EndoC-βH1 cells normalized to GFP+ cells in control or miR-132 overexpressing cells treated as described in (A-D). (F) Mean number of DAPI+ cells of EndoC-βH1 cells/field transduced as described in (A–D). White bars: cells transduced with CMV-eGFP adenovirus vector; black bars: cells transduced with CMV-miR-132/eGFP adenovirus vector. (G) Relative miR-132 level in EndoC-βH1 cells treated with 1.4 mM DMSO or 10 μM harmine. Data shown in (A–D) were collected from 15 to 20 images with 1,000–4,000 cells for each condition. Scale bars in (A–D) = 50 μm *p < 0.05, **p < 0.01, **p < 0.001.CC BY-NC-ND · PubMed Central
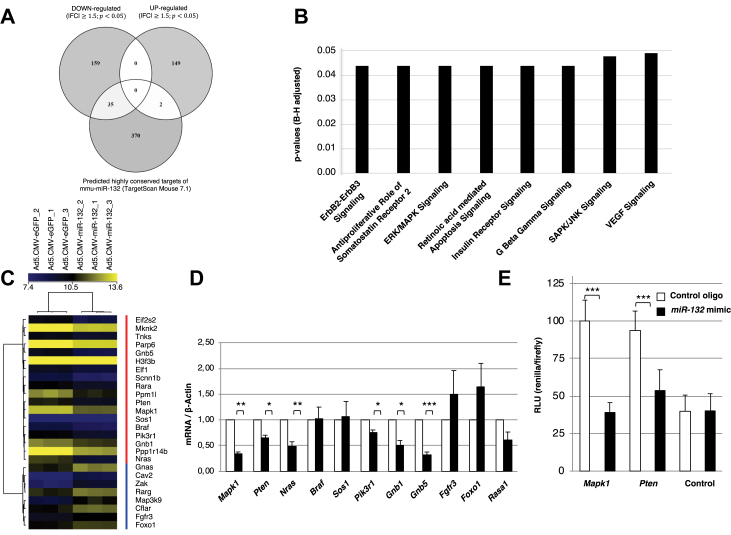
Figure 4 Identification and validation of miR-132 target genes in MIN6 cells. (A) Venn diagram showing the number of down- and upregulated genes in MIN6 cells transduced with CMV-miR-132/eGFP adenovirus vector compared to MIN6 cells transduced with CMV-eGFP adenovirus vector and their overlap with predicted highly conserved murine mouse targets of miR-132. (B) Ingenuity Pathway Analysis of significantly altered pathways in MIN6 cells overexpressing miR-132 and eGFP compared to MIN6 cells overexpressing eGFP alone. (C) Heat map of the 26 (red vertical bar: cluster of downregulated genes; blue vertical bar: cluster of upregulated genes) among the 345 differentially expressed genes included in the 8 regulated pathways indicated in (B) and related to cell proliferation and survival in MIN6 cells overexpressing miR-132 and eGFP relative to MIN6 cells overexpressing eGFP alone. The brightest shades of yellow and blue reflect the higher and lower expression levels of a given gene as indicated in the top horizontal bar. The results are from 3 independent microarray analyses. (D) Validation by RT-PCR of the expression levels of the top 10 most represented genes in the 8 signaling pathways shown in (B) and among the 26 regulated genes shown in (C). White bars: expression in MIN6 cells overexpressing eGFP alone; black bars: expression in MIN6 cells overexpressing miR-132 and eGFP. (E) Min6 cells were co-transfected with 1.5 ug of bicistronic vector psiCHECK-2 in which Pten-3′-UTR or Mapk1-3′-UTR were inserted downstream of the Renilla translational stop codon along with 100 nM of either control or miR-132 mimic oligonucleotide. Co-expressed firefly luciferase was used for the normalization of Renilla luciferase expression, and the luciferase activity of the control was set as 100% The data represent mean ± standard error from 3 separate experiments. *p < 0.05, **p < 0.01, **p < 0.001. (B) The significance was assessed using the Benjamini–Hochberg test.
Figure 4 Identification and validation of miR-132 target genes in MIN6 cells. (A) Venn diagram showing the number of down- and upregulated genes in MIN6 cells transduced with CMV-miR-132/eGFP adenovirus vector compared to MIN6 cells transduced with CMV-eGFP adenovirus vector and their overlap with predicted highly conserved murine mouse targets of miR-132. (B) Ingenuity Pathway Analysis of significantly altered pathways in MIN6 cells overexpressing miR-132 and eGFP compared to MIN6 cells overexpressing eGFP alone. (C) Heat map of the 26 (red vertical bar: cluster of downregulated genes; blue vertical bar: cluster of upregulated genes) among the 345 differentially expressed genes included in the 8 regulated pathways indicated in (B) and related to cell proliferation and survival in MIN6 cells overexpressing miR-132 and eGFP relative to MIN6 cells overexpressing eGFP alone. The brightest shades of yellow and blue reflect the higher and lower expression levels of a given gene as indicated in the top horizontal bar. The results are from 3 independent microarray analyses. (D) Validation by RT-PCR of the expression levels of the top 10 most represented genes in the 8 signaling pathways shown in (B) and among the 26 regulated genes shown in (C). White bars: expression in MIN6 cells overexpressing eGFP alone; black bars: expression in MIN6 cells overexpressing miR-132 and eGFP. (E) Min6 cells were co-transfected with 1.5 ug of bicistronic vector psiCHECK-2 in which Pten-3′-UTR or Mapk1-3′-UTR were inserted downstream of the Renilla translational stop codon along with 100 nM of either control or miR-132 mimic oligonucleotide. Co-expressed firefly luciferase was used for the normalization of Renilla luciferase expression, and the luciferase activity of the control was set as 100% The data represent mean ± standard error from 3 separate experiments. *p < 0.05, **p < 0.01, **p < 0.001. (B) The significance was assessed using the Benjamini–Hochberg test.CC BY-NC-ND · PubMed Central
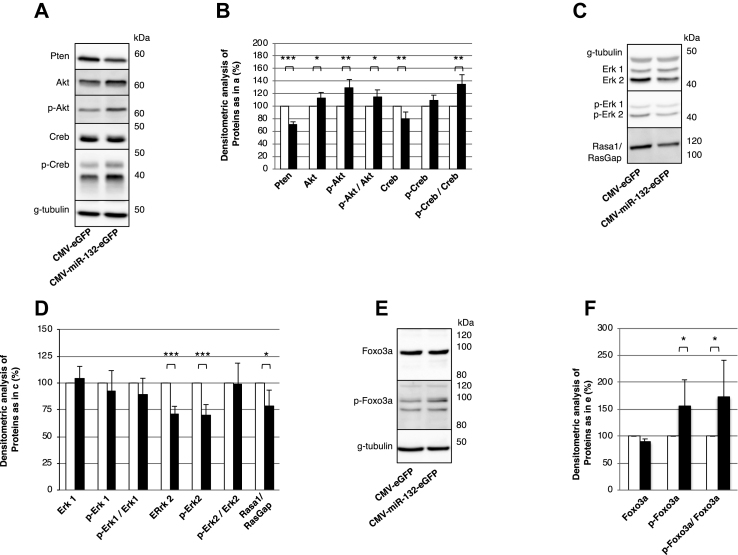
Figure 5 Validation of gene profiling data in MIN6 cells overexpressing miR132. (A, C, and E) Representative immunoblots for the indicated proteins in cell extracts of MIN6 cells overexpressing miR-132 and eGFP or eGFP alone. (B, D, and F) Densitometric quantification of the indicated proteins as detected by immunblots in (A), (C), and (E), respectively. Data are from 6 independent experiments. *p < 0.05, **p < 0.01, **p < 0.001.
Figure 5 Validation of gene profiling data in MIN6 cells overexpressing miR132. (A, C, and E) Representative immunoblots for the indicated proteins in cell extracts of MIN6 cells overexpressing miR-132 and eGFP or eGFP alone. (B, D, and F) Densitometric quantification of the indicated proteins as detected by immunblots in (A), (C), and (E), respectively. Data are from 6 independent experiments. *p < 0.05, **p < 0.01, **p < 0.001.CC BY-NC-ND · PubMed Central
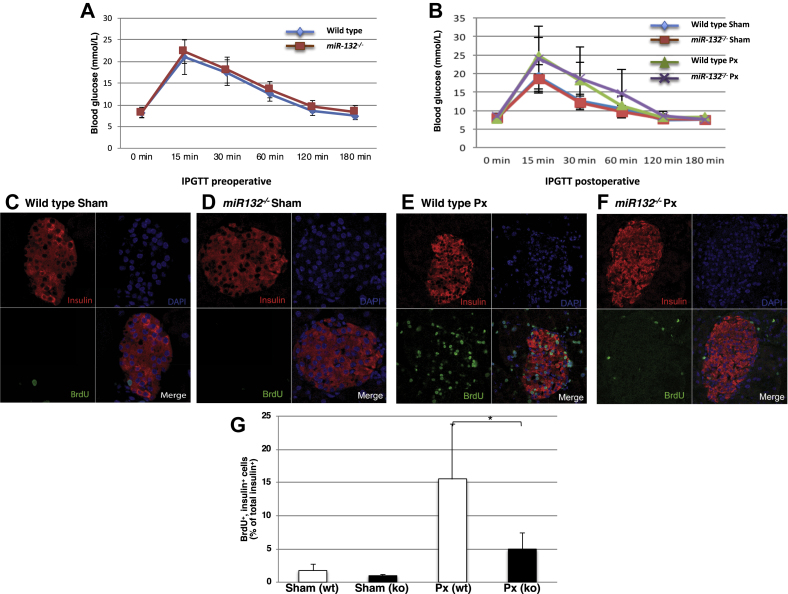
Figure 6 Impaired pancreatic beta cell regeneration in miR-132−/−mice. (A) Expression of blood glucose levels in wild-type (blue line) and miR-132−/− (red line) mice during an intraperitoneal glucose tolerance test conducted two days before surgery. (B) Expression of blood glucose levels in wild-type and miR-132−/− partially pancreatectomized or sham-operated mice during an intraperitoneal glucose tolerance test performed six days after surgery. Sham-operated wild-type mice: blue line; partially pancreatectomized wild-type mice: green line; sham-operated miR-132−/− mice: red line; partially pancreatectomized miR-132−/− mice: purple line. (C–F) Representative confocal images of paraffin pancreatic sections from wild-type sham-operated (C) or partially pancreatectomized mice (E) or from miR-132−/− sham-operated (D) or partially pancreatectomized (F) mice. Sections were immunolabeled for insulin (red) and BrdU (green), while nuclei were detected with DAPI (blue). (G) Percentage of BrdU+ and insulin+ cells. White bars: wild-type mice; black bars: miR-132−/− mice. Data are from 3 independent series with two mice in each group. Up to 50 islets were counted for each mouse for a total of 250–300 islets per group.
Figure 6 Impaired pancreatic beta cell regeneration in miR-132−/−mice. (A) Expression of blood glucose levels in wild-type (blue line) and miR-132−/− (red line) mice during an intraperitoneal glucose tolerance test conducted two days before surgery. (B) Expression of blood glucose levels in wild-type and miR-132−/− partially pancreatectomized or sham-operated mice during an intraperitoneal glucose tolerance test performed six days after surgery. Sham-operated wild-type mice: blue line; partially pancreatectomized wild-type mice: green line; sham-operated miR-132−/− mice: red line; partially pancreatectomized miR-132−/− mice: purple line. (C–F) Representative confocal images of paraffin pancreatic sections from wild-type sham-operated (C) or partially pancreatectomized mice (E) or from miR-132−/− sham-operated (D) or partially pancreatectomized (F) mice. Sections were immunolabeled for insulin (red) and BrdU (green), while nuclei were detected with DAPI (blue). (G) Percentage of BrdU+ and insulin+ cells. White bars: wild-type mice; black bars: miR-132−/− mice. Data are from 3 independent series with two mice in each group. Up to 50 islets were counted for each mouse for a total of 250–300 islets per group.CC BY-NC-ND · PubMed Central
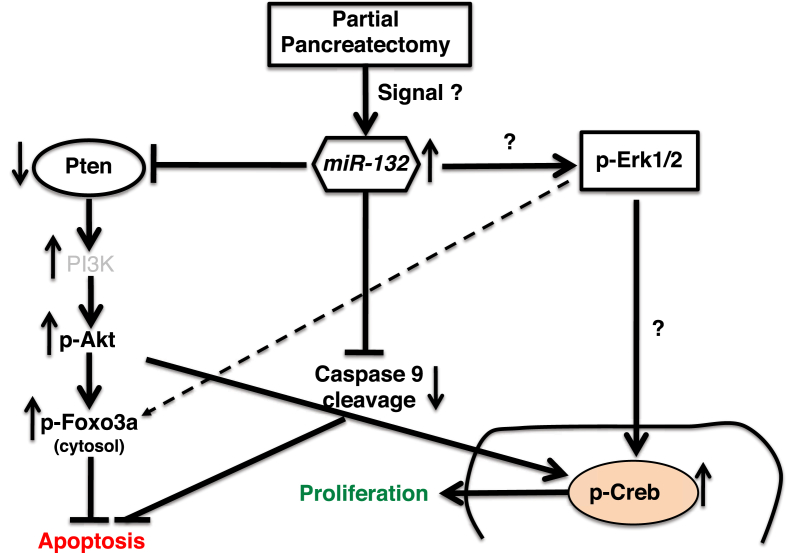
Figure 7 Working model illustrating the miR-132 mediated control of cell survival and proliferation of pancreatic beta cells. Islet beta cell proliferation following partial pancreatectomy correlates with the upregulation of miR-132. MiR-132 reduces the expression of Pten, which in turn enhances Foxo3a phosphorylation. Phosphorylated Foxo3a is sequestered in the cytosol and its transcriptional activity of pro-apoptotic genes such as caspases is reduced. Repression of Pten activity also increases the levels of P-Akt and P-Creb and thus enhances cell proliferation. However, the involvement of Mapk/Erk signaling in miR-132-mediated beta cell proliferation is uncertain. Experimental data presented in this manuscript and literature-based knowledge are displayed as solid and dashed lines, respectively.
Figure 7 Working model illustrating the miR-132 mediated control of cell survival and proliferation of pancreatic beta cells. Islet beta cell proliferation following partial pancreatectomy correlates with the upregulation of miR-132. MiR-132 reduces the expression of Pten, which in turn enhances Foxo3a phosphorylation. Phosphorylated Foxo3a is sequestered in the cytosol and its transcriptional activity of pro-apoptotic genes such as caspases is reduced. Repression of Pten activity also increases the levels of P-Akt and P-Creb and thus enhances cell proliferation. However, the involvement of Mapk/Erk signaling in miR-132-mediated beta cell proliferation is uncertain. Experimental data presented in this manuscript and literature-based knowledge are displayed as solid and dashed lines, respectively.CC BY-NC-ND · PubMed Central

Verification

Claims the paper makes

The claims and statistics of this paper haven’t been checked yet.

Run the check — free, no account needed. It reads the open-access text and checks the sources it cites.

A few free checks a day · papers already verified open instantly · results are public

Claims other papers make about this one

Each is checked against this paper’s own text: does it say what the citing paper says it does?

Self-check

Percentages, sums and reported differences re-computed from the paper’s own numbers.

The self-check needs the paper’s full text.

Citations

Cites

Show all 2 references

Research works printed but not linked: 57

  1. Ambros, 2004, The functions of animal microRNAs, Nature, 431, 350, 10.1038/nature02871 · DOI · Paper page
  2. Calin, 2002, Frequent deletions and down-regulation of micro- RNA genes miR15 and miR16 at 13q14 in chronic lymphocytic leukemia, Proceedings of the National Academy of Sciences of the United States of America, 99, 15524, 10.1073/pnas.242606799 · DOI · Paper page
  3. Gupta, 2013, miRNA-548c: a specific signature in circulating PBMCs from dilated cardiomyopathy patients, Journal of Molecular and Cellular Cardiology, 62, 131, 10.1016/j.yjmcc.2013.05.011 · DOI
  4. Huang, 2013, MicroRNA-22 regulates cardiac hypertrophy and remodeling in response to stress, Circulation Research, 112, 1234, 10.1161/CIRCRESAHA.112.300682 · DOI
  5. Guay, 2015, Role of islet microRNAs in diabetes: which model for which question?, Diabetologia, 58, 456, 10.1007/s00125-014-3471-x · DOI
  6. Plaisance, 2014, Role of microRNAs in islet beta-cell compensation and failure during diabetes, Journal of Diabetes Research, 2014, 618652, 10.1155/2014/618652 · DOI
  7. Roggli, 2012, Changes in microRNA expression contribute to pancreatic β-cell dysfunction in prediabetic NOD mice, Diabetes, 61, 1742, 10.2337/db11-1086 · DOI
  8. Van de Bunt, 2013, The miRNA profile of human pancreatic islets and beta-cells and relationship to type 2 diabetes pathogenesis, PLoS One, 8, 10.1371/journal.pone.0055272 · DOI
  9. Kloosterman, 2007, Targeted inhibition of miRNA maturation with morpholinos reveals a role for miR-375 in pancreatic islet development, PLoS Biology, 5, 10.1371/journal.pbio.0050203 · DOI
  10. Latreille, 2015, miR-375 gene dosage in pancreatic beta-cells: implications for regulation of beta-cell mass and biomarker development, Journal of Molecular Medicine, 93, 1159, 10.1007/s00109-015-1296-9 · DOI
  11. Poy, 2009, miR-375 maintains normal pancreatic alpha- and beta-cell mass, Proceedings of the National Academy of Sciences of the United States of America, 106, 5813, 10.1073/pnas.0810550106 · DOI · Paper page
  12. Esguerra, 2011, Differential glucose-regulation of microRNAs in pancreatic islets of non-obese type 2 diabetes model Goto-Kakizaki rat, PLoS One, 6, 10.1371/journal.pone.0018613 · DOI
  13. Jacovetti, 2012, MicroRNAs contribute to compensatory beta cell expansion during pregnancy and obesity, Journal of Clinical Investigation, 122, 3541, 10.1172/JCI64151 · DOI
  14. Nesca, 2013, Identification of particular groups of microRNAs that positively or negatively impact on beta cell function in obese models of type 2 diabetes, Diabetologia, 56, 2203, 10.1007/s00125-013-2993-y · DOI
  15. Mulder, 2019, AAV8-mediated gene transfer of microRNA-132 improves beta-cell function in mice fed a high fat diet, Journal of Endocrinology, 240, 123, 10.1530/JOE-18-0287 · DOI
  16. Wong, 2013, De-repression of FOXO3a death axis by microRNA-132 and -212 causes neuronal apoptosis in Alzheimer's disease, Human Molecular Genetics, 22, 3077, 10.1093/hmg/ddt164 · DOI · Paper page
  17. Ucar, 2010, miR-212 and miR-132 are required for epithelial stromal interactions necessary for mouse mammary gland development, Nature Genetics, 42, 1101, 10.1038/ng.709 · DOI
  18. Mziaut, 2008, ICA512 signaling enhances pancreatic beta-cell proliferation by regulating cyclins D through STATs, Proceedings of the National Academy of Sciences of the United States of America, 105, 674, 10.1073/pnas.0710931105 · DOI
  19. Miyazaki, 1990, Establishment of a pancreatic beta cell line that retains glucose-inducible insulin secretion: special reference to expression of glucose transporter isoforms, Endocrinology, 127, 126, 10.1210/endo-127-1-126 · DOI
  20. Ravassard, 2011, A genetically engineered human pancreatic β cell line exhibiting glucose-inducible insulin secretion, Journal of Clinical Investigation, 121, 3589, 10.1172/JCI58447 · DOI
  21. Bonner-Weir, 1993, A second pathway for regeneration of adult exocrine and endocrine pancreas. A possible recapitulation of embryonic development, Diabetes, 42, 1715, 10.2337/diab.42.12.1715 · DOI
  22. Elayat, 1995, An immunocytochemical and morphometric study of the rat pancreatic islets, Journal of Anatomy, 186, 629
  23. Chen, 2016, HLF/miR-132/TTK axis regulates cell proliferation, metastasis and radiosensitivity of glioma cells, Biomedicine & Pharmacotherapy, 83, 898, 10.1016/j.biopha.2016.08.004 · DOI
  24. Zhang, 2004, Staurosporine induces apoptosis of melanoma by both caspase-dependent and -independent apoptotic pathways, Molecular Cancer Therapeutics, 3, 187, 10.1158/1535-7163.187.3.2 · DOI
  25. Wang, 2015, A high-throughput chemical screen reveals that harmine-mediated inhibition of DYRK1A increases human pancreatic beta cell replication, Nature Medicine, 21, 383, 10.1038/nm.3820 · DOI
  26. Anand, 2010, MicroRNA-132-mediated loss of p120RasGAP activates the endothelium to facilitate pathological angiogenesis, Nature Medicine, 16, 909, 10.1038/nm.2186 · DOI · Paper page
  27. Deb, 2014, PTEN-mediated ERK1/2 inhibition and paradoxical cellular proliferation following Pnck overexpression, Cell Cycle, 13, 961, 10.4161/cc.27837 · DOI
  28. Huang, 2015, Roles of oxidative stress and the ERK1/2, PTEN and p70S6K signaling pathways in arsenite-induced autophagy, Toxicology Letters, 239, 172, 10.1016/j.toxlet.2015.09.022 · DOI
  29. Lee, 2011, Altered microRNA regulation in Huntington's disease models, Experimental Neurology, 227, 172, 10.1016/j.expneurol.2010.10.012 · DOI · Paper page
  30. Hansen, 2016, Targeted deletion of miR-132/-212 impairs memory and alters the hippocampal transcriptome, Learning & Memory, 23, 61, 10.1101/lm.039578.115 · DOI · Paper page
  31. Shang, 2015, Induction of miR-132 and miR-212 expression by Glucagon-Like Peptide 1 (GLP-1) in rodent and human pancreatic β-cells, Molecular Endocrinology, 29, 1243, 10.1210/me.2014-1335 · DOI
  32. Davis, 2008, SMAD proteins control DROSHA-mediated microRNA maturation, Nature, 454, 56, 10.1038/nature07086 · DOI
  33. Zhao, 2009, Obesity and genetics regulate microRNAs in islets, liver, and adipose of diabetic mice, Mammalian Genome, 20, 476, 10.1007/s00335-009-9217-2 · DOI
  34. Vo, 2005, A cAMP-response element binding protein-induced microRNA regulates neuronal morphogenesis, Proceedings of the National Academy of Sciences of the United States of America, 102, 16426, 10.1073/pnas.0508448102 · DOI · Paper page
  35. Wayman, 2008, An activity-regulated microRNA controls dendritic plasticity by down-regulating p250GAP, Proceedings of the National Academy of Sciences of the United States of America, 105, 9093, 10.1073/pnas.0803072105 · DOI · Paper page
  36. Shang, 2015, Induction of miR-132 and miR-212 expression by Glucagon-Like Peptide 1 (GLP-1) in rodent and human pancreatic β-cells, Molecular Endocrinology, 29, 1243, 10.1210/me.2014-1335 · DOI
  37. Haeusler, 2014, Integrated control of hepatic lipogenesis versus glucose production requires FoxO transcription factors, Nature Communications, 5, 5190, 10.1038/ncomms6190 · DOI
  38. Glauser, 2007, The emerging role of FOXO transcription factors in pancreatic beta cells, Journal of Endocrinology, 193, 195, 10.1677/JOE-06-0191 · DOI · Paper page
  39. Brunet, 1999, Akt promotes cell survival by phosphorylating and inhibiting a Forkhead transcription factor, Cell, 96, 857, 10.1016/S0092-8674(00)80595-4 · DOI · Paper page
  40. Durkin, 1986, Characterization of G1 transit induced by the mitogenic-oncogenic Ki-ras gene product, Molecular and Cellular Biology, 6, 1386
  41. Dobrowolski, 1994, Cellular ras activity is required for passage through multiple points of the G0/G1 phase in BALB/c 3T3 cells, Molecular and Cellular Biology, 14, 5441
  42. Downward, 1997, Routine role for ras, Current Biology, 7, R258, 10.1016/S0960-9822(06)00116-3 · DOI
  43. Yang, 2006, Variations in cyclin D1 levels through the cell cycle determine the proliferative fate of a cell, Cell Division, 1, 32, 10.1186/1747-1028-1-32 · DOI
  44. Carney, 2012, The microtubule cytoskeleton is required for a G2 cell cycle delay in cancer cells lacking stathmin and p53, Cytoskeleton, 69, 278, 10.1002/cm.21024 · DOI
  45. Van Hooser, 1998, Histone H3 phosphorylation is required for the initiation, but not maintenance, of mammalian chromosome condensation, Journal of Cell Science, 111, 3497, 10.1242/jcs.111.23.3497 · DOI
  46. Wang, 2013, MicroRNA-7 regulates the mTOR pathway and proliferation in adult pancreatic β-cells, Diabetes, 62, 887, 10.2337/db12-0451 · DOI
  47. Baroukh, 2007, MicroRNA-124a regulates Foxa2 expression and intracellular signaling in pancreatic beta-cell lines, Journal of Biological Chemistry, 282, 19575, 10.1074/jbc.M611841200 · DOI · Paper page
  48. Vijayaraghavan, 2014, miR-24 regulates menin in the endocrine pancreas, American Journal of Physiology Endocrinology and Metabolism, 307, E84, 10.1152/ajpendo.00542.2013 · DOI
  49. Gurung, 2014, Menin is required for optimal processing of the microRNA let-7a, Journal of Biological Chemistry, 289, 9902, 10.1074/jbc.M113.520692 · DOI
  50. Fu, 2013, MicroRNA-26a targets ten eleven translocation enzymes and is regulated during pancreatic cell differentiation, Proceedings of the National Academy of Sciences of the United States of America, 110, 17892, 10.1073/pnas.1317397110 · DOI
  51. Tattikota, 2014, Argonaute2 mediates compensatory expansion of the pancreatic beta cell, Cell Metabolism, 19, 122, 10.1016/j.cmet.2013.11.015 · DOI
  52. Joglekar, 2007, MicroRNA profiling of developing and regenerating pancreas reveal post-transcriptional regulation of neurogenin3, Developmental Biology, 311, 603, 10.1016/j.ydbio.2007.09.008 · DOI
  53. Magill, 2010, microRNA-132 regulates dendritic growth and arborization of newborn neurons in the adult hippocampus, Proceedings of the National Academy of Sciences of the United States of America, 107, 20382, 10.1073/pnas.1015691107 · DOI · Paper page
  54. Dusaulcy, 2019, miR-132-3p is a positive regulator of alpha-cell mass and is downregulated in obese hyperglycemic mice, Molecular Metabolism, 22, 84, 10.1016/j.molmet.2019.01.004 · DOI
  55. Lu, 2018, miR-205 suppresses tumor growth, invasion, and epithelial-mesenchymal transition by targeting SEMA4C in hepatocellular carcinoma, The FASEB Journal, 32, 6123, 10.1096/fj.201800113R · DOI
  56. Lu, 2019, miR-205-5p contributes to paclitaxel resistance and progression of endometrial cancer by downregulating FOXO1, Oncology Research Featuring Preclinical and Clinical Cancer Therapeutics, 10.3727/096504018X15452187888839 · DOI
  57. Cai, 2013, AKT signaling is constitutively activated in various cancers, due in large part to loss-of-function in the PTEN and PHLPP phosphatases that act as tumor suppressor, Cancer Research, 73, 5402, 10.1158/0008-5472.CAN-13-0297 · DOI

Cited by

Sorted by citations

See all 65

Metadata

Authors
Mziaut, H., Henniger, G., Ganss, K., Hempel, S., Wolk, S., McChord, J., Chowdhury, K., Ravassard, P., Knoch, K.-P., Krautz, C., Weitz, J., Grützmann, R., Pilarsky, C., Solimena, M., & Kersting, S.
Venue
Molecular Metabolism
Publisher
Elsevier BV
Published
2020-01
Volume
31
Pages
150-162
ISSN
2212-8778
Cited by
65
References
2
Language
en
Funders
  • Technische Universität Dresden
  • Bundesministerium für Bildung und Forschung

About these checks

Registry, retraction, Cites and statistics results are computed, not judged, with one exception: a printed reference that no index lists is read once by a model before it counts as a citation error. Claims are extracted by a model and kept only when their quote appears verbatim in the text; each cited source is then checked, with a model’s help, for whether it says what the claim relies on. Those verdicts can be wrong — read the claim’s quote and the cited source before relying on one.

Statistics and arithmetic are recomputed, not judged.

Confidence bands are shown only for fields calibrated on our annotated test set. None is calibrated yet, so no band is shown.

What counts as a claim ›How we measure confidence ›How we check this ›

Are you an author, or do you see a problem with this page? Request a review

How to cite

Cite CoChat for the checks on this page, and the paper for its own findings.

This page
CoChat. (2026). Citation check: MiR-132 controls pancreatic beta cell proliferation and survival through Pten/Akt/Foxo3 signaling. https://app.cochat.ai/papers/10.1016/j.molmet.2019.11.012
The paper
Mziaut, H., Henniger, G., Ganss, K., Hempel, S., Wolk, S., McChord, J., Chowdhury, K., Ravassard, P., Knoch, K.-P., Krautz, C., Weitz, J., Grützmann, R., Pilarsky, C., Solimena, M., & Kersting, S. (2020). MiR-132 controls pancreatic beta cell proliferation and survival through Pten/Akt/Foxo3 signaling. Molecular Metabolism. https://doi.org/10.1016/j.molmet.2019.11.012