

The DOI matches its Crossref record; 51 of the 51 references it cites were found in a registry or an index.
Mitochondrial impairment activates the Wallerian pathway through depletion of NMNAT2 leading to SARM1-dependent axon degeneration
Open accessPublished version of a preprint
Abstract
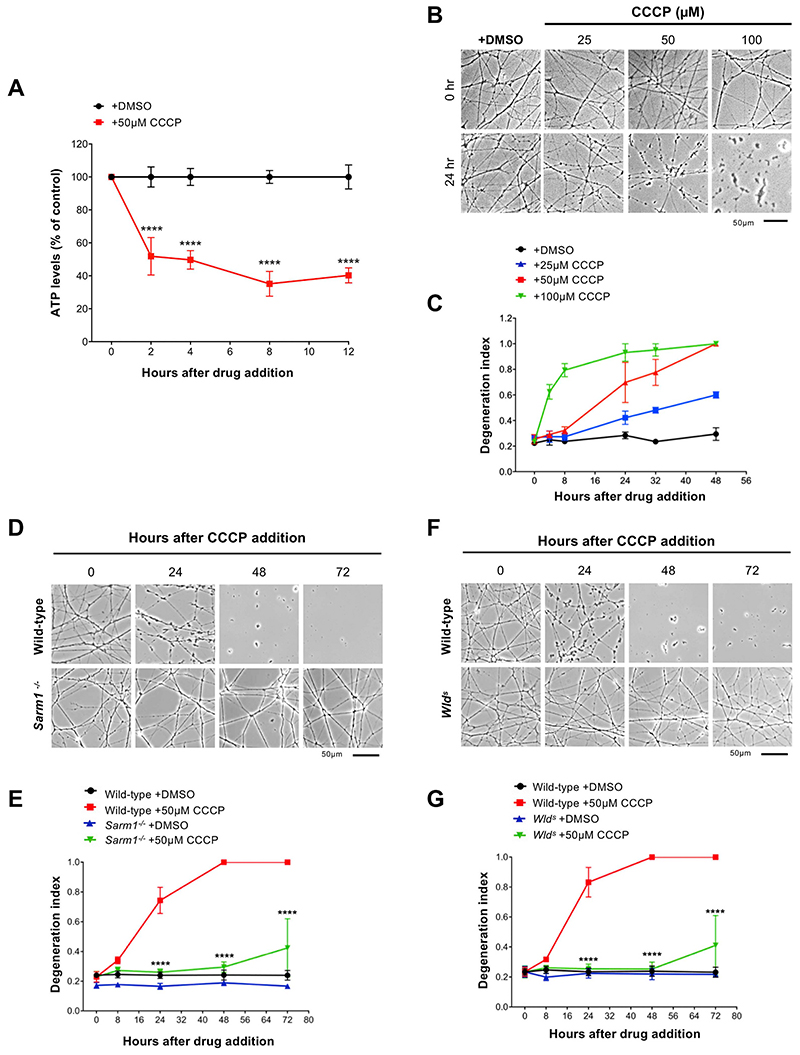
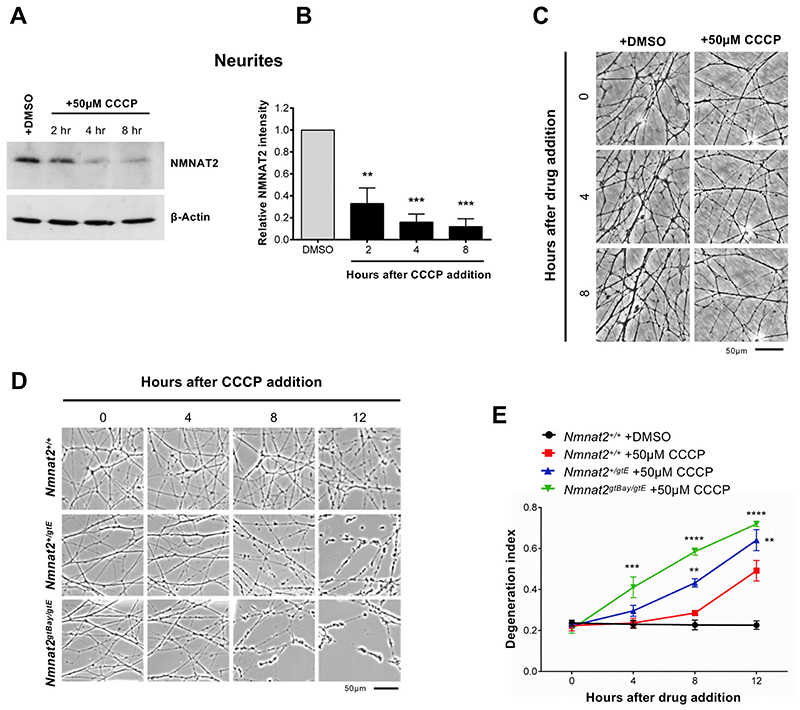
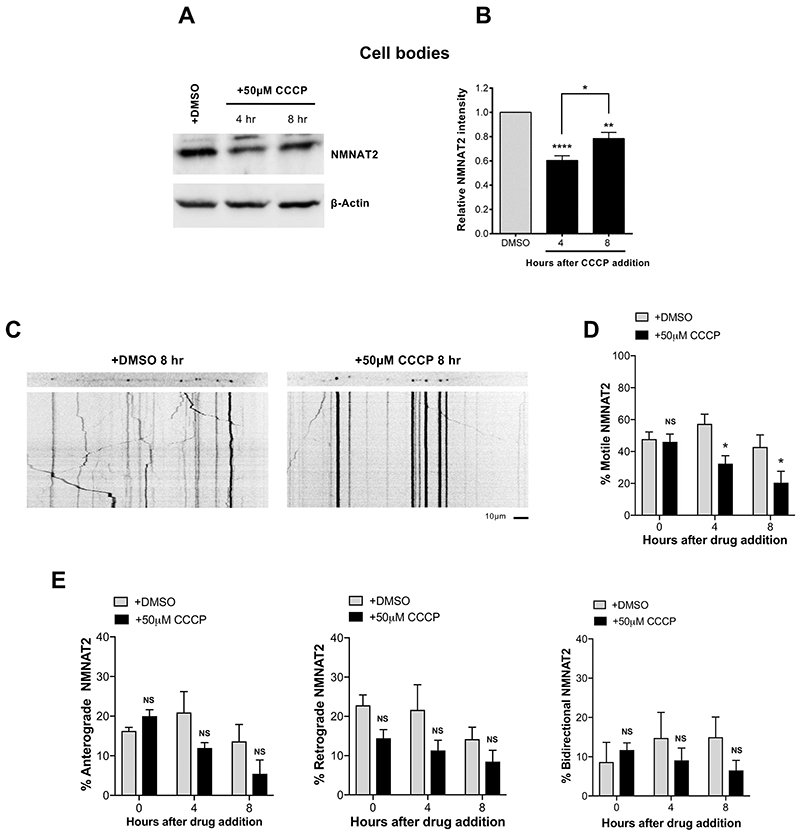
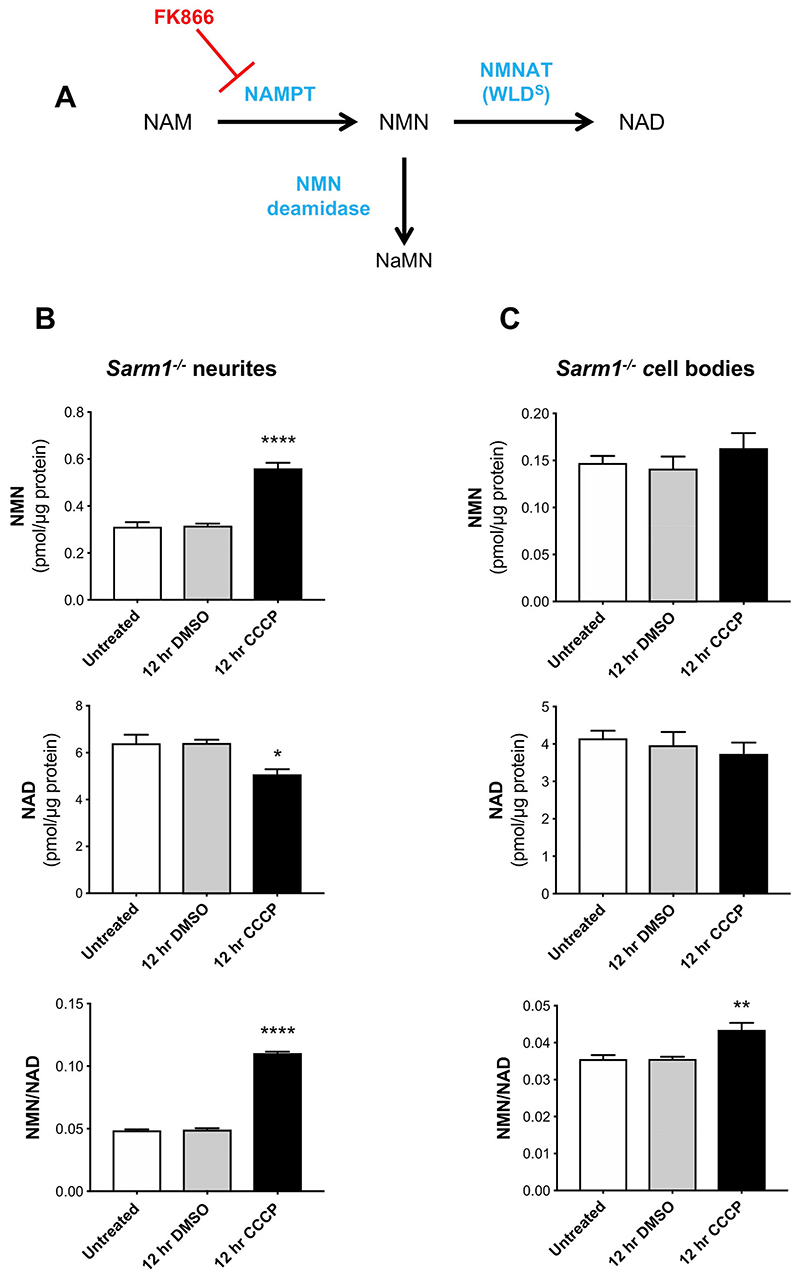
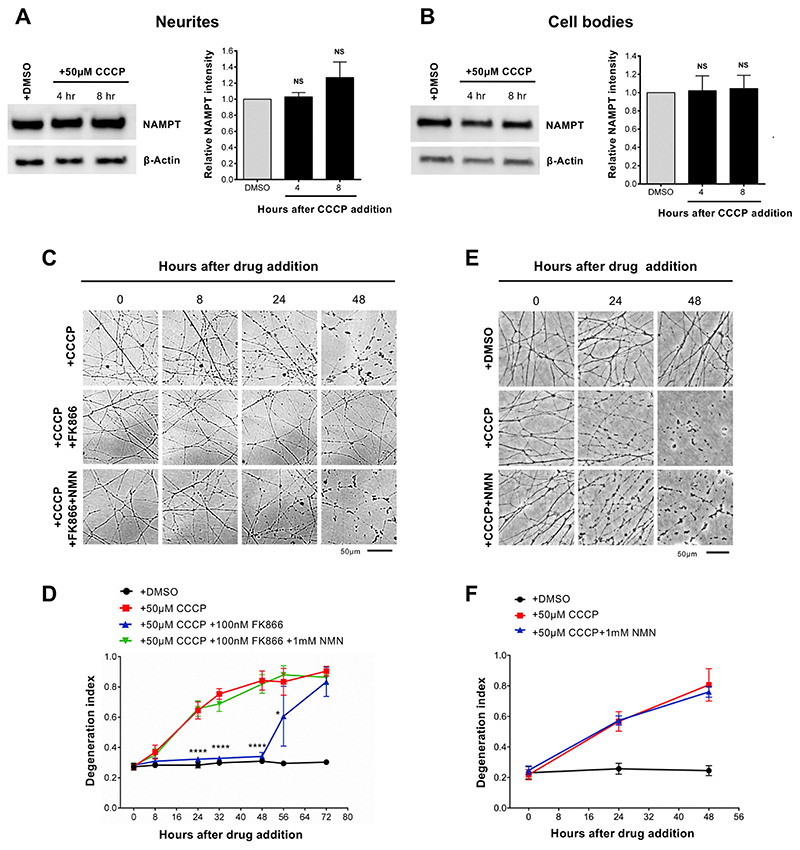
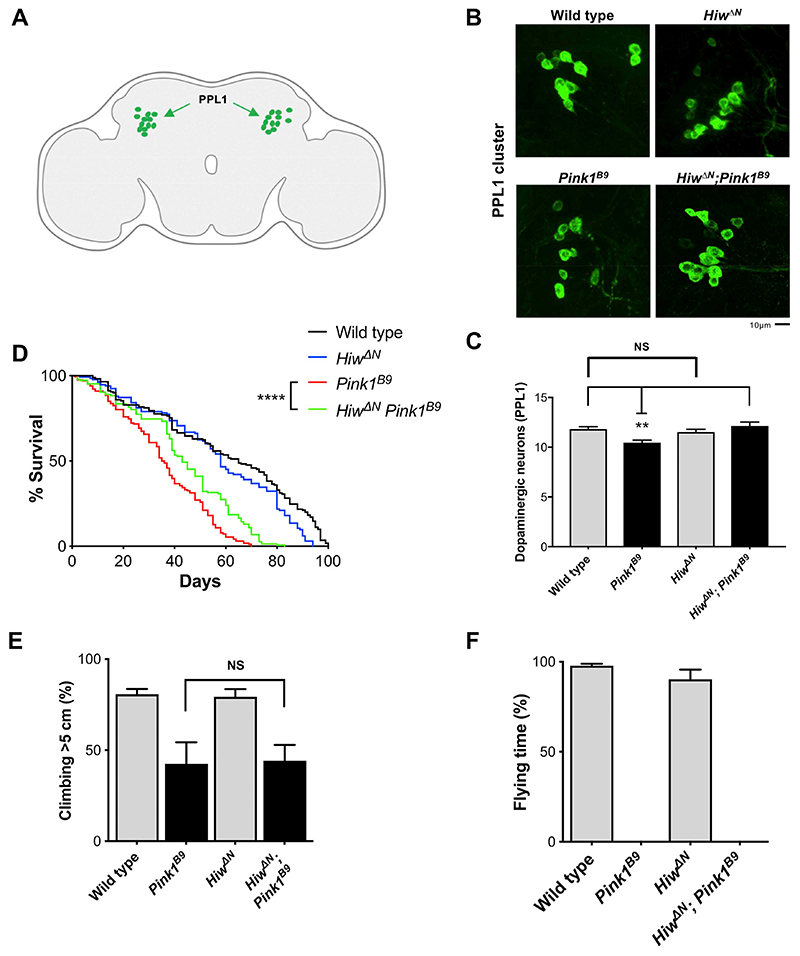
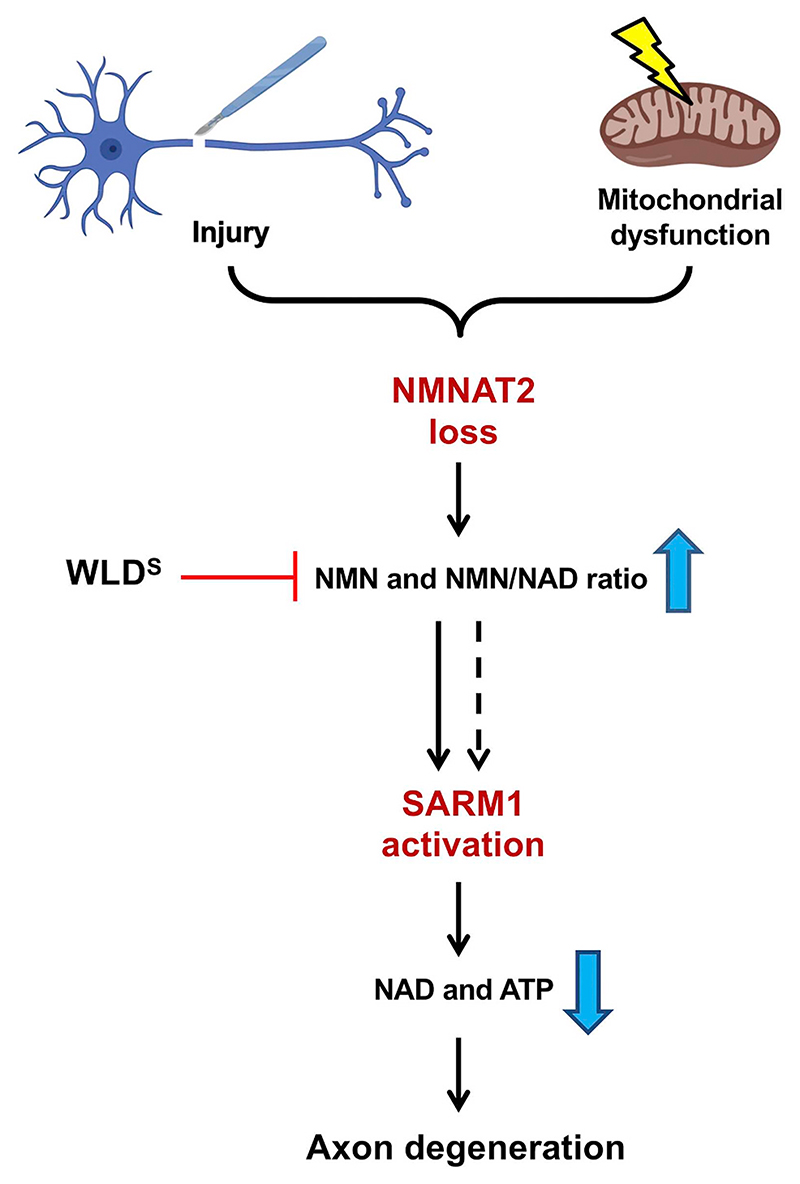
Wallerian degeneration of physically injured axons involves a well-defined molecular pathway linking loss of axonal survival factor NMNAT2 to activation of pro-degenerative protein SARM1. Manipulating the pathway through these proteins led to the identification of non-axotomy insults causing axon degeneration by a Wallerian-like mechanism, including several involving mitochondrial impairment. Mitochondrial dysfunction is heavily implicated in Parkinson's disease, Charcot-Marie-Tooth disease, hereditary spastic paraplegia and other axonal disorders. However, whether and how mitochondrial impairment activates Wallerian degeneration has remained unclear. Here, we show that disruption of mitochondrial membrane potential leads to axonal NMNAT2 depletion in mouse sympathetic neurons, increasing the substrate-to-product ratio (NMN/NAD) of this NAD-synthesising enzyme, a metabolic fingerprint of Wallerian degeneration. The mechanism appears to involve both impaired NMNAT2 synthesis and reduced axonal transport. Expression of WLDS and Sarm1 deletion both protect axons after mitochondrial uncoupling. Blocking the pathway also confers neuroprotection and increases the lifespan of flies with Pink1 loss-of-function mutation, which causes severe mitochondrial defects. These data indicate that mitochondrial impairment replicates all the major steps of Wallerian degeneration, placing it upstream of NMNAT2 loss, with the potential to contribute to axon pathology in mitochondrial disorders.
Overview
The claims and statistics of this paper haven’t been checked yet.
Run the check — free, no account needed. It reads the open-access text and checks the sources it cites.
Integrity signals
Registry
Cites
Statistics
Figures
Verification
Claims the paper makes
The claims and statistics of this paper haven’t been checked yet.
Run the check — free, no account needed. It reads the open-access text and checks the sources it cites.
Claims other papers make about this one
Each is checked against this paper’s own text: does it say what the citing paper says it does?
In the citing paper
“during axon degeneration, NMNAT2 axonal transport is blocked, and the axonal pool of the protein is rapidly degraded, leading to a critical depletion of NAD+ in the axon142,143.”
From NAD+ metabolism and its roles in cellular processes during ageing (2021) · cites this paper as [143]
Self-check
Percentages, sums and reported differences re-computed from the paper’s own numbers.
The self-check needs the paper’s full text.
Citations
Cites
Hereditary Early-Onset Parkinson's Disease Caused by Mutations in PINK1
Valente, E. M., Abou-Sleiman, P. M., Caputo, V., Muqit, M. M. K., Harvey, K., Gispert, S., Ali, Z., Del Turco, D., Bentivoglio, A. R., Healy, D. G., et al. (2004) · Science · doi:10.1126/science.1096284 · Cited by 3,481
The Roles of PINK1, Parkin, and Mitochondrial Fidelity in Parkinson’s Disease
Pickrell, A. M., & Youle, R. J. (2015) · Neuron · doi:10.1016/j.neuron.2014.12.007 · Cited by 2,310
Drosophila pink1 is required for mitochondrial function and interacts genetically with parkin
Clark, I. E., Dodson, M. W., Jiang, C., Cao, J. H., Huh, J. R., Seol, J. H., Yoo, S. J., Hay, B. A., & Guo, M. (2006) · Nature · doi:10.1038/nature04779 · Cited by 1,788
Mitochondrial dysfunction in Drosophila PINK1 mutants is complemented by parkin
Park, J., Lee, S. B., Lee, S., Kim, Y., Song, S., Kim, S., Bae, E., Kim, J., Shong, M., Kim, J.-M., et al. (2006) · Nature · doi:10.1038/nature04788 · Cited by 1,705
The mitochondrial membrane potential (Δψm) in apoptosis; an update
Ly, J. D., Grubb, D. R., & Lawen, A. (2003) · APOPTOSIS · doi:10.1023/a:1022945107762 · Cited by 1,607
Matsuda, W., Furuta, T., Nakamura, K. C., Hioki, H., Fujiyama, F., Arai, R., & Kaneko, T. (2009) · The Journal of Neuroscience · doi:10.1523/jneurosci.4029-08.2009 · Cited by 865
dSarm/Sarm1 Is Required for Activation of an Injury-Induced Axon Death Pathway
Osterloh, J. M., Yang, J. H., Rooney, T. M., Fox, A. N., Adalbert, R., Powell, E. H., Sheehan, A. E., Avery, M. A., Hackett, R., Logan, M. A., et al. (2012) · Science · doi:10.1126/science.1223899 · Cited by 688
Self-citationMelamed, Z., López-Erauskin, J., Baughn, M. W., Zhang, O., Drenner, K., Sun, Y., Freyermuth, F., McMahon, M. A., Beccari, M. S., Artates, J. W., et al. (2019) · Nature Neuroscience · doi:10.1038/s41593-018-0293-z · Cited by 635
Wallerian degeneration: an emerging axon death pathway linking injury and disease
Conforti, L., Gilley, J., & Coleman, M. P. (2014) · Nature reviews. Neuroscience · doi:10.1038/nrn3680 · Cited by 630
Self-citationEssuman, K., Summers, D. W., Sasaki, Y., Mao, X., DiAntonio, A., & Milbrandt, J. (2017) · Neuron · doi:10.1016/j.neuron.2017.02.022 · Cited by 619
Cited by
Sorted by citations
NAD+ metabolism and its roles in cellular processes during ageing
Covarrubias, A. J., Perrone, R., Grozio, A., & Verdin, E. (2021) · Nature Reviews Molecular Cell Biology · doi:10.1038/s41580-020-00313-x · Cited by 1,617
Hughes, R. O., Bosanac, T., Mao, X. R., Engber, T. M., DiAntonio, A., Milbrandt, J., Devraj, R. V., & Krauss, R. (2021) · Cell Reports · doi:10.1016/j.celrep.2020.108588 · Cited by 183
Liu, H., Zhang, J., Xu, X., Lu, S., Yang, D., Xie, C., Jia, M., Zhang, W., Jin, L., Wang, X., et al. (2021) · Theranostics · doi:10.7150/thno.49054 · Cited by 162
Figley, M. D., & DiAntonio, A. (2020) · Current Opinion in Neurobiology · doi:10.1016/j.conb.2020.02.012 · Cited by 144
SARM1 acts downstream of neuroinflammatory and necroptotic signaling to induce axon degeneration
Ko, K. W., Milbrandt, J., & DiAntonio, A. (2020) · The Journal of Cell Biology · doi:10.1083/jcb.201912047 · Cited by 137
Krauss, R., Bosanac, T., Devraj, R. V., Engber, T. M., & Hughes, R. O. (2020) · Trends in Pharmacological Sciences · doi:10.1016/j.tips.2020.01.006 · Cited by 128
Sasaki, Y., Engber, T. M., Hughes, R. O., Figley, M. D., Wu, T., Bosanac, T., Devraj, R. V., Milbrandt, J., Krauss, R., & DiAntonio, A. (2020) · Experimental Neurology · doi:10.1016/j.expneurol.2020.113252 · Cited by 111
Neuroprotection in glaucoma: Mechanisms beyond intraocular pressure lowering
Tribble, J. R., Hui, F., Quintero, H., Hajji, S. E., Bell, K. C., Polo, A. D., & Williams, P. A. (2023) · Molecular Aspects of Medicine · doi:10.1016/j.mam.2023.101193 · Cited by 124
Axonal Degeneration in AD: The Contribution of Aβ and Tau
Salvadores, N., Gerónimo‐Olvera, C., & Court, F. A. (2020) · Frontiers in Aging Neuroscience · doi:10.3389/fnagi.2020.581767 · Cited by 101
Angeletti, C., Amici, A., Gilley, J., Loreto, A., Trapanotto, A. G., Antoniou, C., Merlini, E., Coleman, M. P., & Orsomando, G. (2022) · iScience · doi:10.1016/j.isci.2022.103812 · Cited by 95
Self-citationAxonal energy metabolism, and the effects in aging and neurodegenerative diseases
Yang, S., Park, J. H., & Lu, H.-C. (2023) · Molecular Neurodegeneration · doi:10.1186/s13024-023-00634-3 · Cited by 94
Emergence of SARM1 as a Potential Therapeutic Target for Wallerian-type Diseases
Loring, H. S., & Thompson, P. R. (2019) · Cell chemical biology · doi:10.1016/j.chembiol.2019.11.002 · Cited by 76
Neurotoxin-mediated potent activation of the axon degeneration regulator SARM1
Loreto, A., Angeletti, C., Gu, W., Osborne, A., Nieuwenhuis, B., Gilley, J., Arthur‐Farraj, P., Merlini, E., Amici, A., Luo, Z., et al. (2021) · eLife · doi:10.7554/elife.72823 · Cited by 70
Self-citationEmerging Therapies for Charcot-Marie-Tooth Inherited Neuropathies
Stavrou, M., Sargiannidou, I., Georgiou, E., Kagiava, A., & Kleopa, K. A. (2021) · International Journal of Molecular Sciences · doi:10.3390/ijms22116048 · Cited by 76
White matter damage and degeneration in traumatic brain injury.
Armstrong, R. C., Sullivan, G. M., Perl, D. P., Rosarda, J. D., & Radomski, K. L. (2024) · Trends in Neurosciences · doi:10.1016/j.tins.2024.07.003 · Cited by 62
Arthur‐Farraj, P., & Coleman, M. P. (2021) · Neurotherapeutics · doi:10.1007/s13311-021-01125-3 · Cited by 63
Self-citationYamada, Y., Strickland, A. M., Sasaki, Y., Bloom, A. J., DiAntonio, A., & Milbrandt, J. (2022) · Journal of Clinical Investigation · doi:10.1172/jci161566 · Cited by 58
Mitochondrial dysfunction as a trigger of programmed axon death
Merlini, E., Coleman, M. P., & Loreto, A. (2021) · Trends in Neurosciences · doi:10.1016/j.tins.2021.10.014 · Cited by 57
Self-citationNeuroprotection in Glaucoma: NAD+/NADH Redox State as a Potential Biomarker and Therapeutic Target
Petriti, B., Williams, P. A., Lascaratos, G., Chau, K., & Garway‐Heath, D. F. (2021) · Cells · doi:10.3390/cells10061402 · Cited by 52
Chen, Y., Sasaki, Y., DiAntonio, A., & Milbrandt, J. (2021) · Experimental Neurology · doi:10.1016/j.expneurol.2021.113636 · Cited by 46
A Novel NAD Signaling Mechanism in Axon Degeneration and its Relationship to Innate Immunity
Hopkins, E. L., Gu, W., Kobe, B., & Coleman, M. P. (2021) · Frontiers in Molecular Biosciences · doi:10.3389/fmolb.2021.703532 · Cited by 48
Self-citationOzaki, E., Gibbons, L., Neto, N. G. B., Kenna, P. F., Carty, M., Humphries, M. M., Humphries, P., Campbell, M., Monaghan, M. G., Bowie, A., et al. (2020) · Life Science Alliance · doi:10.26508/lsa.201900618 · Cited by 43
The Current State of Charcot–Marie–Tooth Disease Treatment
Okamoto, Y., & Takashima, H. (2023) · Genes · doi:10.3390/genes14071391 · Cited by 43
Petriti, B., Rabiolo, A., Chau, K., Williams, P. A., Montesano, G., Lascaratos, G., & Garway‐Heath, D. F. (2024) · Nature Medicine · doi:10.1038/s41591-024-03068-6 · Cited by 45
NMNAT2 is a druggable target to drive neuronal NAD production
Tribble, J. R., Jöe, M., Varricchio, C., Otmani, A., Canovai, A., Habchi, B., Daskalakis, E., Chaleckis, R., Loreto, A., Gilley, J., et al. (2024) · Nature Communications · doi:10.1038/s41467-024-50354-5 · Cited by 47
Self-citationDing, C., Wu, Y., Dabas, H., & Hammarlund, M. (2022) · eLife · doi:10.7554/elife.73557 · Cited by 40
Groh, J., Abdelwahab, T., Kattimani, Y., Hörner, M., Loserth, S., Gudi, V., Adalbert, R., Imdahl, F., Saliba, A.-E., Coleman, M., et al. (2023) · Nature Communications · doi:10.1038/s41467-023-42570-2 · Cited by 39
Self-citationBradshaw, D. V., Knutsen, A. K., Korotcov, A. V., Sullivan, G. M., Radomski, K. L., Dardzinski, B. J., Zi, X., McDaniel, D. P., & Armstrong, R. C. (2021) · Acta Neuropathologica Communications · doi:10.1186/s40478-021-01193-8 · Cited by 41
Cimaglia, G., Votruba, M., Morgan, J. E., André, H., & Williams, P. A. (2020) · Nutrients · doi:10.3390/nu12092871 · Cited by 40
Sun, Y., Wang, Q., Wang, Y., Ren, W., Cao, Y., Li, J., Zhou, X., Fu, W., & Yang, J. H. (2021) · Protein & Cell · doi:10.1007/s13238-021-00835-w · Cited by 38
The role of RGC degeneration in the pathogenesis of glaucoma
Si, Z., Fan, Y., Wang, M., Zhao, J., Zhang, Y., Liu, D., & Zheng, Y. (2024) · International Journal of Biological Sciences · doi:10.7150/ijbs.103222 · Cited by 46
Protection against oxaliplatin-induced mechanical and thermal hypersensitivity in Sarm1−/− mice
Gould, S. A., White, M. A., Wilbrey, A. L., Pór, E., Coleman, M. P., & Adalbert, R. (2021) · Experimental Neurology · doi:10.1016/j.expneurol.2021.113607 · Cited by 33
Self-citationBrief Electrical Stimulation Promotes Recovery after Surgical Repair of Injured Peripheral Nerves
Gordon, T. (2024) · International Journal of Molecular Sciences · doi:10.3390/ijms25010665 · Cited by 32
Axonal mRNA translation in neurological disorders
Lin, J. Q., van Tartwijk, F. W., & Holt, C. E. (2020) · RNA Biology · doi:10.1080/15476286.2020.1822638 · Cited by 33
Ma, J., Goodwani, S., Acton, P. J., Buggia-Prévot, V., Kesler, S. R., Jamal, I., Mahant, I., Liu, Z., Mseeh, F., Roth, B. L., et al. (2021) · Pain · doi:10.1097/j.pain.0000000000002256 · Cited by 33
Yu, J., Meng, J., Qin, Z., Yuan, Y., Liang, Y., Wang, Y., & Min, D. (2023) · Journal of Neuroinflammation · doi:10.1186/s12974-023-02782-1 · Cited by 30
NAD+ Metabolism and Diseases with Motor Dysfunction
Lundt, S., & Ding, S. (2021) · Genes · doi:10.3390/genes12111776 · Cited by 27
NMN: The NAD precursor at the intersection between axon degeneration and anti-ageing therapies
Loreto, A., Antoniou, C., Merlini, E., Gilley, J., & Coleman, M. P. (2023) · Neuroscience Research · doi:10.1016/j.neures.2023.01.004 · Cited by 31
Self-citationYang, T., Wang, Y., Liao, W., Zhang, S., Wang, S., Xu, N., Xie, W., Luo, C., Wang, Y., Wang, Z., et al. (2021) · Cell & Bioscience · doi:10.1186/s13578-021-00705-2 · Cited by 30
Alexandris, A. S., Lee, Y., Lehar, M., Alam, Z., Samineni, P., Tripathi, S. J., Ryu, J., & Koliatsos, V. (2022) · Experimental Neurology · doi:10.1016/j.expneurol.2022.114252 · Cited by 25
McGuinness, H. Y., Gu, W., Shi, Y. Y., Kobe, B., & Ve, T. (2023) · The Neuroscientist · doi:10.1177/10738584231162508 · Cited by 29
Pathobiochemistry of Aging and Neurodegeneration: Deregulation of NAD+ Metabolism in Brain Cells
Kolotyeva, N. A., Groshkov, A. A., Rozanova, N. A., Berdnikov, A. K., Novikova, S. V., Komleva, Y. K., Salmina, A. B., Illarioshkin, S. N., & Пирадов, М. А. (2024) · Biomolecules · doi:10.3390/biom14121556 · Cited by 24
NMNAT2: An important metabolic enzyme affecting the disease progression
Li, W., Gao, M., Hu, C., Chen, X., & Zhou, Y. (2022) · Biomedicine & Pharmacotherapy · doi:10.1016/j.biopha.2022.114143 · Cited by 24
NAD + , Axonal Maintenance, and Neurological Disease
Alexandris, A. S., & Koliatsos, V. E. (2023) · Antioxidants and Redox Signaling · doi:10.1089/ars.2023.0350 · Cited by 20
Neurotoxin-mediated --potent activation of the axon degeneration regulator SARM1.
Loreto, A., Angeletti, C., Gu, W., Osborne, A., Nieuwenhuis, B., Gilley, J., Merlini, E., Arthur‐Farraj, P., Amici, A., Luo, Z., et al. (2021) · Apollo (University of Cambridge) · doi:10.17863/cam.79086 · Cited by 20
Self-citationAugustus Waller’s foresight realized: SARM1 in peripheral neuropathies
Geisler, S. (2024) · Current Opinion in Neurobiology · doi:10.1016/j.conb.2024.102884 · Cited by 19
Neuroinflammation: Breaking barriers and bridging gaps
Estera, L. A., Walsh, S. P., Headen, J. A., Williamson, R. E., & Kalinski, A. L. (2021) · Neuroscience Research · doi:10.1016/j.neures.2021.11.001 · Cited by 18
Snavely, A. R., Heo, K., Petrova, V., Ho, T. S., Huang, X., Hermawan, C., Kagan, R. D., Deng, T., Singeç, I., Chen, L., et al. (2022) · Disease Models & Mechanisms · doi:10.1242/dmm.049358 · Cited by 19
Alexandris, A. S., Lee, Y., Lehar, M., Alam, Z., McKenney, J., Perdomo, D., Ryu, J., Welsbie, D. S., Zack, D. J., & Koliatsos, V. E. (2023) · Journal of Neurotrauma · doi:10.1089/neu.2022.0416 · Cited by 18
Nmnat2 attenuates amyloidogenesis and up-regulates ADAM10 in AMPK activity-dependent manner
Cheng, X., Shi, F.-X., Zhao, K.-P., Lin, W., Li, X.-Y., Zhang, J., Bu, Y.-Y., Zhu, R., Li, X.-H., Duan, D.-X., et al. (2021) · Aging · doi:10.18632/aging.203634 · Cited by 18
Kievit, B., Johnstone, A. D., Gibon, J., & Barker, P. A. (2022) · Frontiers in Molecular Neuroscience · doi:10.3389/fnmol.2022.852181 · Cited by 16
Protective effects of NAMPT or MAPK inhibitors and NaR on Wallerian degeneration of mammalian axons
Alexandris, A. S., Ryu, J., Rajbhandari, L., Harlan, R., McKenney, J., Wang, Y., Aja, S. M., Graham, D. R. M., Venkatesan, A., & Koliatsos, V. E. (2022) · Neurobiology of Disease · doi:10.1016/j.nbd.2022.105808 · Cited by 16
NAD+ metabolism in peripheral neuropathic pain
Dai, Y., Lin, J., Ren, J., Zhu, B., Wu, C., & Yu, L. (2022) · Neurochemistry International · doi:10.1016/j.neuint.2022.105435 · Cited by 15
Hill, C. S., Sreedharan, J., Loreto, A., Menon, D. K., & Coleman, M. P. (2020) · Frontiers in Neurology · doi:10.3389/fneur.2020.00401 · Cited by 15
Self-citationMurata, H., Yasui, Y., Oiso, K., Ochi, T., Tomonobu, N., Yamamoto, K., Kinoshita, R., & Sakaguchi, M. (2023) · Cellular Signalling · doi:10.1016/j.cellsig.2023.110717 · Cited by 14
Loreto, A., Cramb, K. M. L., McDermott, L., Antoniou, C., Cirilli, I., Caiazza, M. C., Merlini, E., Arthur‐Farraj, P., du Preez, W. D., Mock, E. D., et al. (2025) · Neurobiology of Disease · doi:10.1016/j.nbd.2025.106986 · Cited by 14
Self-citationParsons, R. B., Kocinaj, A., Ruiz-Pulido, G., Prendergast, S. A., Parsons, A. E., Facey, P. D., & Hirth, F. (2022) · Human Molecular Genetics · doi:10.1093/hmg/ddac077 · Cited by 13
Beirowski, B. (2022) · Neurobiology of Disease · doi:10.1016/j.nbd.2022.105751 · Cited by 15
SARM1 is responsible for calpain-dependent dendrite degeneration in mouse hippocampal neurons
Miyamoto, T., Kim, C., Chow, J., Dugas, J. C., DeGroot, J., Bagdasarian, A. L., Thottumkara, A. P., Larhammar, M., Calvert, M., Fox, B. M., et al. (2024) · Journal of Biological Chemistry · doi:10.1016/j.jbc.2024.105630 · Cited by 13
Han, L., Dong, X., Qiu, T., Dou, Z., Wu, L., & Dai, H. (2022) · Materials Today Bio · doi:10.1016/j.mtbio.2022.100387 · Cited by 13
Wang, S., Zhang, Y., Lou, J., Yong, H., Shan, S., Liu, Z. Q., Song, M., Zhang, C., Kou, R., Liu, Z., et al. (2022) · Phytotherapy Research · doi:10.1002/ptr.7594 · Cited by 12
Hinz, F. I., Villegas, C. L. M., Roberts, J. T., Yao, H., Gaddam, S., Delwig, A., Green, S. A., Fredrickson, C., Adrian, M., Asuncion, R. R., et al. (2024) · Journal of Neuroscience · doi:10.1523/jneurosci.2424-23.2024 · Cited by 12
Díaz‐Amarilla, P., Arredondo, F., Dapueto, R., Boix, V., Carvalho, D. B., Santi, M. D., Vasilskis, E., Mesquita-Ribeiro, R., Dajas‐Bailador, F., Abin‐Carriquiry, J. A., et al. (2022) · Neurochemistry International · doi:10.1016/j.neuint.2022.105403 · Cited by 12
Self-citationTargeting SARM1 improves autophagic stress-induced axonal neuropathy
Kim, H. R., Lee, H. J., Jeon, Y., Jang, S. Y., Shin, Y. K., Yun, J. H., Park, H. J., Koh, H., Lee, K. E., Shin, J. E., et al. (2023) · Autophagy · doi:10.1080/15548627.2023.2244861 · Cited by 12
Otmani, A., Jóhannesson, G., Brautaset, R., Tribble, J. R., & Williams, P. A. (2024) · Acta Neuropathologica Communications · doi:10.1186/s40478-024-01724-z · Cited by 11
Programmed axon death: a promising target for treating retinal and optic nerve disorders
Loreto, A., Merlini, E., & Coleman, M. P. (2024) · Eye · doi:10.1038/s41433-024-03025-0 · Cited by 12
Self-citationDeep Learning to Decipher the Progression and Morphology of Axonal Degeneration
Palumbo, A., Grüning, P., Landt, S. K., Heckmann, L., Bartram, L., Pabst, A., Flory, C., Ikhsan, M., Pietsch, S., Schulz, R., et al. (2021) · Cells · doi:10.3390/cells10102539 · Cited by 11
SARM1 loss protects retinal ganglion cells in a mouse model of autosomal dominant optic atrophy
Ding, C., Ndiaye, P. S., Campbell, S. R., Fry, M. Y., Gong, J., Wienbar, S. R., Gibbs, W., Morquette, P., Chao, L. H., Do, M. T. H., et al. (2025) · Journal of Clinical Investigation · doi:10.1172/jci191315 · Cited by 8
Wang, S., Yang, Y., Yu, Z., Song, M., Liu, Z. Q., Shan, S., Yong, H., Ni, W., Qiang, Y., Zhang, C., et al. (2023) · Journal of Neurochemistry · doi:10.1111/jnc.15889 · Cited by 10
Montoro-Gámez, C., Nolte, H., Molinié, T., Evangelista, G., Tröder, S. E., Barth, E., Popović, M., Trifunović, A., Zevnik, B., Langer, T., et al. (2023) · Brain · doi:10.1093/brain/awad136 · Cited by 10
Phosphorylated SARM1 is involved in the pathological process of rotenone-induced neurodegeneration
Murata, H., Phoo, M. T. Z., Ochi, T., Tomonobu, N., Yamamoto, K., Kinoshita, R., Miyazaki, I., Nishibori, M., Asanuma, M., & Sakaguchi, M. (2023) · The Journal of Biochemistry · doi:10.1093/jb/mvad068 · Cited by 10
Inhibiting the SARM1-NAD+ axis reduces oxidative stress-induced damage to retinal and nerve cells
Zhang, Y., Yao, Y., Yang, J., Zhou, B., & Zhu, Y. (2024) · International Immunopharmacology · doi:10.1016/j.intimp.2024.112193 · Cited by 10
Song, M., Kang, K., Wang, S., Zhang, C., Zhao, X., & Song, F. (2024) · Toxicology · doi:10.1016/j.tox.2024.153812 · Cited by 9
Potential Therapeutic Interventions Targeting NAD+ Metabolism for ALS
Lundt, S., & Ding, S. (2024) · Cells · doi:10.3390/cells13171509 · Cited by 12
Targeting SARM1 as a novel neuroprotective therapy in neurotropic viral infections
He, S., Zhu, Y., Wang, X., Zhang, G., Hou, K., Xia, X., Jiang, Z., Gong, X., & Zhao, P. (2025) · Journal of Neuroinflammation · doi:10.1186/s12974-025-03423-5 · Cited by 8
Programmed axon degeneration: mechanism, inhibition and therapeutic potential
Loreto, A., & Neukomm, L. J. (2025) · Nature reviews. Neuroscience · doi:10.1038/s41583-025-00986-3 · Cited by 8
Self-citationDong, X., Zhang, H., Su, J., Liu, K., Li, Z., Liang, X., Huo, Y., Yang, J., Yan, L., Yu, A., et al. (2025) · Advanced Materials · doi:10.1002/adma.202510948 · Cited by 8
Viezuina, D.-M., Burlacu, I., Greșiță, A., Matache, I.-M., Târtea, E., Mușat, M. I., Amzoiu, M., Cătălin, B., Sfredel, V., & Mitran, S. (2025) · International Journal of Molecular Sciences · doi:10.3390/ijms27010419 · Cited by 9
Song, M., Kang, K., & Song, F. (2021) · Medical Hypotheses · doi:10.1016/j.mehy.2021.110666 · Cited by 8
Ex Vivo Integration of Human Stem Retinal Ganglion Cells into the Mouse Retina
Croteau, L., Risner, M. L., Wareham, L. K., McGrady, N. R., Chamling, X., Zack, D. J., & Calkins, D. J. (2022) · Cells · doi:10.3390/cells11203241 · Cited by 8
Antoniou, C., Loreto, A., Gilley, J., Merlini, E., Orsomando, G., & Coleman, M. P. (2024) · Molecular Neurobiology · doi:10.1007/s12035-024-04480-2 · Cited by 9
Self-citationExperimental Model Systems for Understanding Human Axonal Injury Responses
Lee, B., & Cho, Y. (2021) · International Journal of Molecular Sciences · doi:10.3390/ijms22020474 · Cited by 8
Pivotal roles for membrane phospholipids in axonal degeneration
Almasieh, M., Faris, H., & Levin, L. A. (2022) · The International Journal of Biochemistry & Cell Biology · doi:10.1016/j.biocel.2022.106264 · Cited by 8
Babetto, E., & Beirowski, B. (2022) · Biochimica et Biophysica Acta (BBA) - Bioenergetics · doi:10.1016/j.bbabio.2022.148545 · Cited by 7
Targeting SARM1: from inhibition for neuroprotection to activation for neuroablation
Arthur‐Farraj, P., & Loreto, A. (2025) · Trends in Pharmacological Sciences · doi:10.1016/j.tips.2025.09.003 · Cited by 7
Self-citationTri-ortho-cresyl phosphate induces axonal degeneration in chicken DRG neurons by the NAD+ pathway
Sun, Y., & Wu, Y. (2022) · Toxicology Letters · doi:10.1016/j.toxlet.2022.05.007 · Cited by 7
The Physiologic Basis of Molecular Therapeutics for Peripheral Nerve Injury: A Primer
Spezia, M. C., Dy, C. J., & Brogan, D. M. (2024) · Journal of Hand Surgery Global Online · doi:10.1016/j.jhsg.2024.01.017 · Cited by 6
Ni, W., Ye, Y., Wang, S., Li, X., Li, H., Cheng, D., Jia, Q., Liu, Z. Q., Shan, S., Qiang, Y., et al. (2024) · Environmental Pollution · doi:10.1016/j.envpol.2024.124651 · Cited by 4
Tricresylphosphate isomers: A review of toxicity pathways
Tkachuk, M., & Matiytsiv, N. P. (2025) · Neurotoxicology and Teratology · doi:10.1016/j.ntt.2025.107432 · Cited by 4
The rise and fall of SARM1 base-exchange inhibitors
Lundbäck, T., Chandrasekar, V., Gu, C., Ju, H., McAdam, R. L., Palomero, M., Sader, K., Peter, B., Wissler, L., Nevin, P., et al. (2026) · Communications Chemistry · doi:10.1038/s42004-026-02074-8 · Cited by 7
Niou, Z., Yang, S., Enriquez, A., Espinas, N. A., Sri, A., Hines, C. D., Tennessen, J. M., Wu, C., Huang, J.-Y., & Lu, H. (2025) · Advanced Science · doi:10.1002/advs.202509950 · Cited by 4
Emergence of the Wallerian degeneration pathway as a mechanism of secondary brain injury
Hill, C. S., & Loreto, A. (2020) · Neural Regeneration Research · doi:10.4103/1673-5374.297070 · Cited by 4
Self-citationPeripheral nerve injury and its regeneration processes: a biomolecular point of view
Sumarwoto, T., Poetera, C. Y., & Abimanyu, D. (2021) · Bali Medical Journal · doi:10.15562/bmj.v10i2.2343 · Cited by 4
Glycolytic System in Axons Supplement Decreased ATP Levels after Axotomy of the Peripheral Nerve
TAKENAKA, T., Ohnishi, Y., Yamamoto, M., Setoyama, D., & Kishima, H. (2023) · eNeuro · doi:10.1523/eneuro.0353-22.2023 · Cited by 5
Wu, H., Wan, J., Yuan, J., Xie, M., Nie, Q., Liu, Z., & Cai, S. (2024) · Beverage Plant Research · doi:10.48130/bpr-0024-0019 · Cited by 4
Niou, Z., Yang, S., Sri, A., Rodriquez, H., Gilley, J., Coleman, M. P., & Lu, H. (2022) · bioRxiv (Cold Spring Harbor Laboratory) · doi:10.1101/2022.02.05.479195 · Cited by 3
Self-citationSelf-adaptive hydrogels for treatment of spinal cord injury
Zhong, Z., Zhao, K., Hu, H., Chen, X., Zheng, W., & Gao, C. (2026) · Journal of Controlled Release · doi:10.1016/j.jconrel.2026.114854 · Cited by 3
Yang, B., Wei, S., Ma, Y., & Chu, S. (2020) · BioMed Research International · doi:10.1155/2020/4927547 · Cited by 3
SARM1 in the pathogenesis of immune-related disease
Ye, Y., & Song, F. (2024) · Toxicology Research · doi:10.1093/toxres/tfae208 · Cited by 2
Petrova, V., Mills, C. E., Hug, C. B., Cetinkaya‐Fisgin, A., Splaine, J., Fouladzadeh, S., Hakim, S., Powell, R., Zhen, S., Chung, M., et al. (2026) · Cell Reports Medicine · doi:10.1016/j.xcrm.2026.102787 · Cited by 2
Metadata
- Authors
- Loreto, A., Hill, C. S., Hewitt, V. L., Orsomando, G., Angeletti, C., Gilley, J., Lucci, C., Sanchez-Martinez, A., Whitworth, A. J., Conforti, L., Dajas-Bailador, F., & Coleman, M. P.
- Affiliations
- University of Cambridge (GB)
- Marche Polytechnic University (IT)
- University of Nottingham (GB)
- Corresponding author
- Loreto, Andrea
- Coleman, Michael P.
- ORCID
- Venue
- Neurobiology of Disease
- Publisher
- Elsevier BV
- Published
- 2020-02
- Volume
- 134
- Pages
- 104678
- ISSN
- 0969-9961 (ISSN-L)
- PMC
- PMC7611775
- OpenAlex
- W2984519822
- Cited by
- 131
- References
- 51
- Citations by year
- 2026: 12 · 2025: 13 · 2024: 23 · 2023: 16 · 2022: 22 · 2021: 30 · 2020: 13
- FWCI
- 7.84
- Type
- journal article
- Language
- en
- Open access
- hybrid
- doi.org
- Licence
- Locations
- Neurobiology of Disease (publishedVersion, cc-by)
- bioRxiv (Cold Spring Harbor Laboratory) (acceptedVersion, cc-by-nc-nd)
- PubMed (publishedVersion)
- Europe PMC (PubMed Central) (acceptedVersion, other-oa)
- PubMed Central (acceptedVersion, cc-by)
- DOAJ (DOAJ: Directory of Open Access Journals) (submittedVersion, cc-by-sa)
- UCL Discovery (University College London) (submittedVersion)
- Repository@Nottingham (University of Nottingham) (submittedVersion, cc-by)
- Università Politecnica delle Marche (Università Politecnica delle Marche) (submittedVersion, cc-by-nc-nd)
- Università Politecnica delle Marche (Università Politecnica delle Marche) (submittedVersion)
- Apollo (University of Cambridge) (submittedVersion)
- Apollo
- Funders
- Medical Research Council
- Parkinson's UK
- Wellcome Trust
- Topics
- Life Sciences › Neuroscience › Cellular and Molecular Neuroscience › Nerve injury and regeneration
- Life Sciences › Neuroscience › Cellular and Molecular Neuroscience › Hereditary Neurological Disorders
- Life Sciences › Biochemistry, Genetics and Molecular Biology › Molecular Biology › Mitochondrial Function and Pathology
- Keywords
- Wallerian degeneration, mitochondrial dysfunction, NMNAT2, SARM1, axonal degeneration, mitochondrial membrane potential, mitochondrial uncoupling, axonal transport, sympathetic neurons, NAD biosynthesis, PINK1, mitochondrial disease, neuroprotection
- MeSH terms
- Animals, Axons, Cytoskeletal Proteins, Drosophila, Male, Mice, Inbred C57BL, Mitochondria, Nicotinamide-Nucleotide Adenylyltransferase, Wallerian Degeneration, Armadillo Domain Proteins, Membrane Potential, Mitochondrial
About these checks
Registry, retraction, Cites and statistics results are computed, not judged, with one exception: a printed reference that no index lists is read once by a model before it counts as a citation error. Claims are extracted by a model and kept only when their quote appears verbatim in the text; each cited source is then checked, with a model’s help, for whether it says what the claim relies on. Those verdicts can be wrong — read the claim’s quote and the cited source before relying on one.
Statistics and arithmetic are recomputed, not judged.
Confidence bands are shown only for fields calibrated on our annotated test set. None is calibrated yet, so no band is shown.
What counts as a claim ›How we measure confidence ›How we check this ›
Are you an author, or do you see a problem with this page? Request a review
