

The DOI matches its Crossref record; 60 of the 63 references it cites were found in a registry or an index.
Empagliflozin rescues diabetic myocardial microvascular injury via AMPK-mediated inhibition of mitochondrial fission
Open accessAbstract
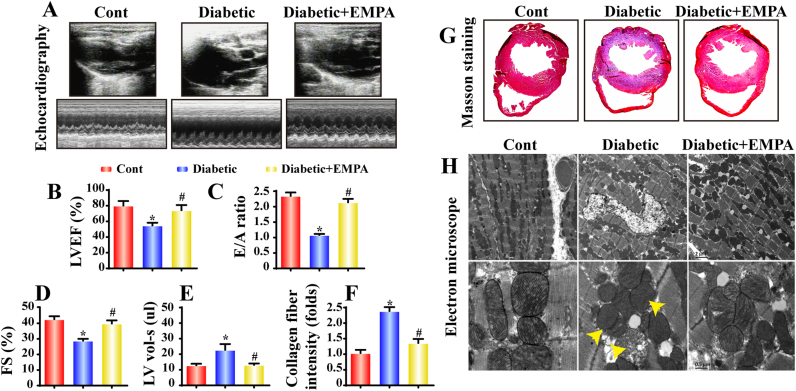
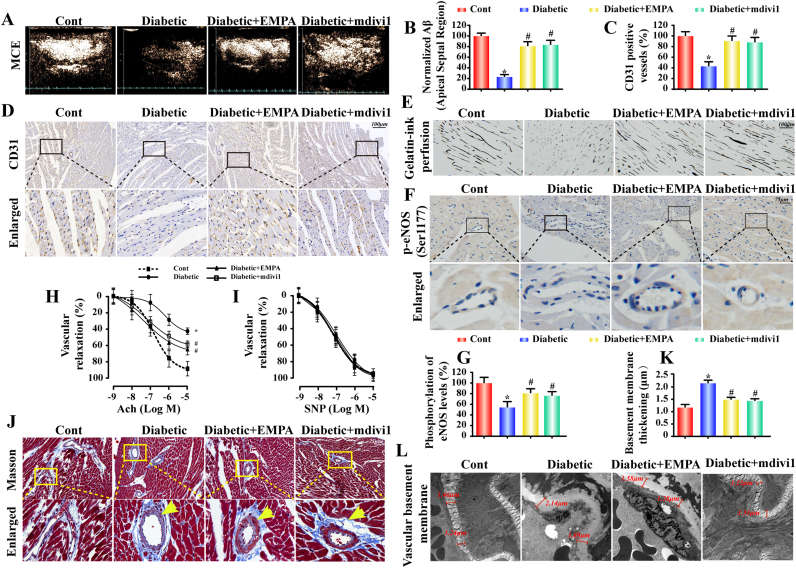
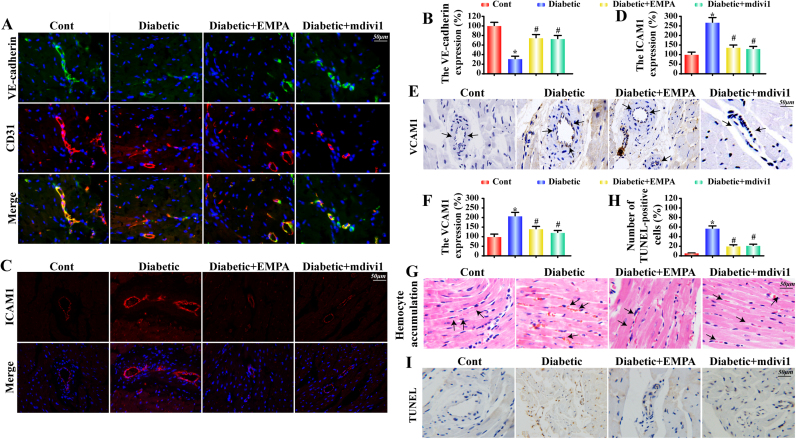
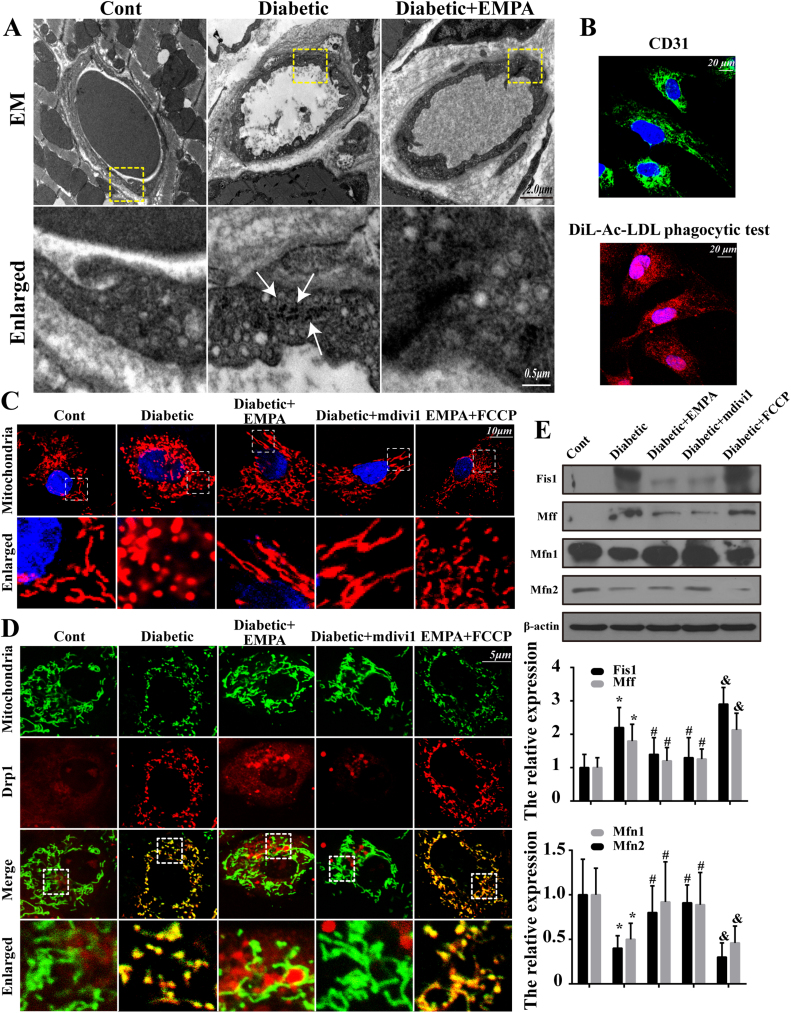
Impaired cardiac microvascular function contributes to diabetic cardiovascular complications although effective therapy remains elusive. Empagliflozin, a sodium-glucose cotransporter 2 (SGLT2) inhibitor recently approved for treatment of type 2 diabetes, promotes glycosuria excretion and offers cardioprotective actions beyond its glucose-lowering effects. This study was designed to evaluate the effect of empagliflozin on cardiac microvascular injury in diabetes and the underlying mechanism involved with a focus on mitochondria. Our data revealed that empagliflozin improved diabetic myocardial structure and function, preserved cardiac microvascular barrier function and integrity, sustained eNOS phosphorylation and endothelium-dependent relaxation, as well as improved microvessel density and perfusion. Further study suggested that empagliflozin exerted its effects through inhibition of mitochondrial fission in an adenosine monophosphate (AMP)-activated protein kinase (AMPK)-dependent manner. Empagliflozin restored AMP-to-ATP ratio to trigger AMPK activation, suppressed Drp1 S616 phosphorylation, and increased Drp1 S637 phosphorylation, ultimately leading to inhibition of mitochondrial fission. The empagliflozin-induced inhibition of mitochondrial fission preserved cardiac microvascular endothelial cell (CMEC) barrier function through suppressed mitochondrial reactive oxygen species (mtROS) production and subsequently oxidative stress to impede CMEC senescence. Empagliflozin-induced fission loss also favored angiogenesis by promoting CMEC migration through amelioration of F-actin depolymerization. Taken together, these results indicated the therapeutic promises of empagliflozin in the treatment of pathological microvascular changes in diabetes.
Overview
The claims and statistics of this paper haven’t been checked yet.
Run the check — free, no account needed. It reads the open-access text and checks the sources it cites.
Integrity signals
Registry
Cites
Statistics
Figures
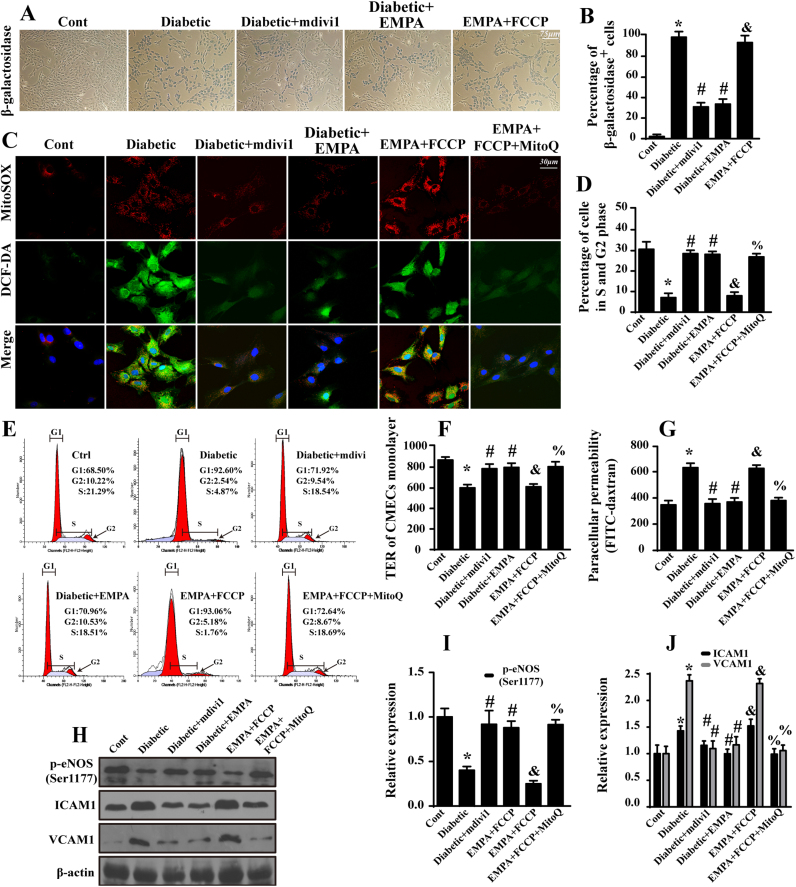
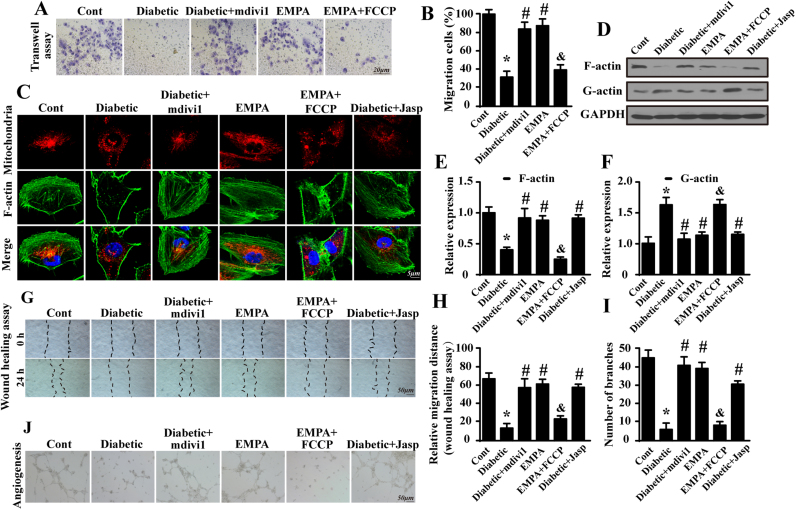
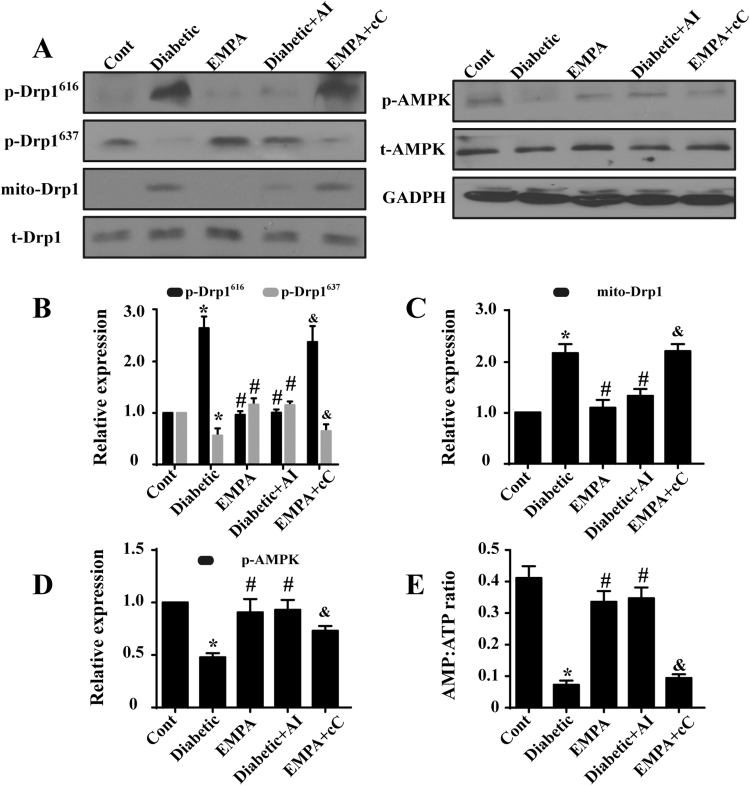
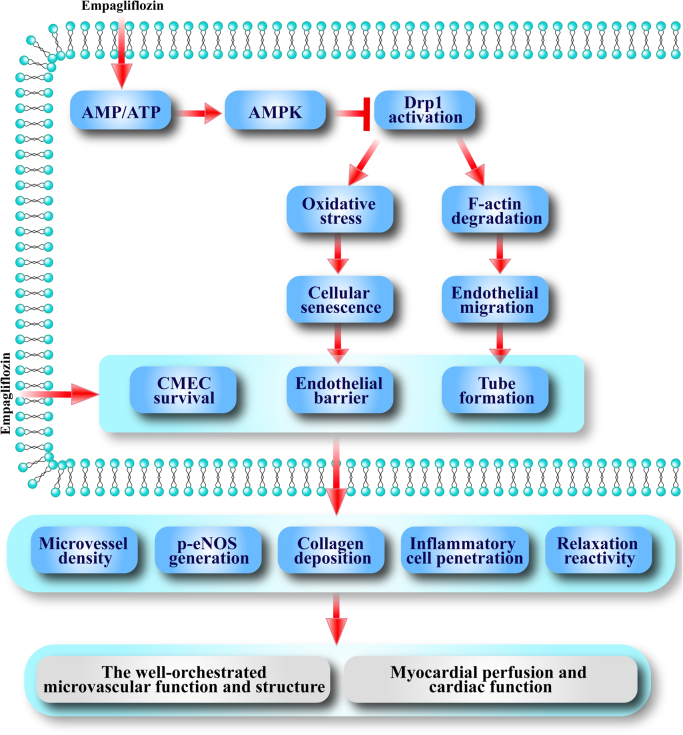
Verification
Claims the paper makes
The claims and statistics of this paper haven’t been checked yet.
Run the check — free, no account needed. It reads the open-access text and checks the sources it cites.
Claims other papers make about this one
Each is checked against this paper’s own text: does it say what the citing paper says it does?
In the citing paper
“Empagliflozin exerted its protective roles via inhibition of AMPK-dependent mitochondrial fission [229].”
From AMPK, Mitochondrial Function, and Cardiovascular Disease (2020) · cites this paper as [229]
In the citing paper
“Empagliflozin recovered the AMP-to-ATP ratio that is necessary for triggering AMPK activation [229].”
From AMPK, Mitochondrial Function, and Cardiovascular Disease (2020) · cites this paper as [229]
In the citing paper
“In the meantime, DRP1-S616 phosphorylation was decreased, while DRP1-S637 phosphorylation was increased, ultimately leading to mitochondrial fission [229].”
From AMPK, Mitochondrial Function, and Cardiovascular Disease (2020) · cites this paper as [229]
Self-check
Percentages, sums and reported differences re-computed from the paper’s own numbers.
The self-check needs the paper’s full text.
Citations
Cites
1 retracted
Zhou, H., Du, W., Li, Y., Chen, S., Hu, N., Ma, S., Wang, W., & Ren, J. T. (2017) · Journal of Pineal Research · doi:10.1111/jpi.12450 · Cited by 292
RetractedEmpagliflozin, Cardiovascular Outcomes, and Mortality in Type 2 Diabetes
Zinman, B., Wanner, C., Lachin, J. M., Fitchett, D., Bluhmki, E., Hantel, S., Mattheus, M., Devins, T., Johansen, O. E., Woerle, H. J., et al. (2015) · New England Journal of Medicine · doi:10.1056/nejmoa1504720 · Cited by 12,315
AMP-activated protein kinase mediates mitochondrial fission in response to energy stress
Toyama, E. Q., Herzig, S., Courchet, J., Lewis, T. L., Losón, O. C., Hellberg, K., Young, N. P., Chen, H., Polleux, F., Chan, D. C., et al. (2016) · Science · doi:10.1126/science.aab4138 · Cited by 1,085
Mitochondrial Fission Inhibitors Suppress Endothelin-1-Induced Artery Constriction
Chen, C., Gao, J., Liu, M., Li, S., Xuan, X., Zhang, X., Zhang, X.-Y., Wei, Y., Zhen, C., Jin, J., et al. (2017) · Cellular Physiology and Biochemistry · doi:10.1159/000479536 · Cited by 782
Empagliflozin, Cardiovascular Outcomes, and Mortality in Type 2 Diabetes
(2016) · New England Journal of Medicine · doi:10.1056/nejmc1600827 · Cited by 700
Mitochondrial composition and function under the control of hypoxia
Fuhrmann, D. C., & Brüne, B. (2017) · Redox Biology · doi:10.1016/j.redox.2017.02.012 · Cited by 665 · cited 1×
“The mitochondrial content is modest in endothelial cells compared to other cell types with a higher energy requirement, indicating a primary role for mitochondria as essential signaling organelles in vascular endothelium [10,11].”
BackgroundMitochondrial dynamics in type 2 diabetes: Pathophysiological implications
Rovira-Llopis, S., Bañuls, C., Diaz-Morales, N., Hernandez-Mijares, A., Rocha, M., & Victor, V. M. (2017) · Redox Biology · doi:10.1016/j.redox.2017.01.013 · Cited by 657 · cited 2×
“Besides, hyperglycemia-triggered mitochondrial fission may be lessened by mitophagy, a repair system for the mitochondrial homeostasis via timely clearance of the mitochondrial debris [15,53].”
BackgroundEndothelial Cell Metabolism in Normal and Diseased Vasculature
Eelen, G., de Zeeuw, P., Simons, M., & Carmeliet, P. (2015) · Circulation Research · doi:10.1161/circresaha.116.302855 · Cited by 637 · cited 1×
“Therefore, the hunt for means to protect the cardiac microvasculature against hyperglycemic damage is essential to retard or alleviate diabetic macrovascular complications [4].”
BackgroundChilton, R., Tikkanen, I., Cannon, C. P., Crowe, S., Woerle, H. J., Broedl, U. C., & Johansen, O. E. (2015) · Diabetes, Obesity and Metabolism · doi:10.1111/dom.12572 · Cited by 507 · cited 1×
“Considerable evidence has documented the ability of empagliflozin to reduce SBP through facilitating osmotic diuresis [38].”
BackgroundWang, W., Wang, Y., Long, J., Wang, J., Haudek, S. B., Overbeek, P., Chang, B. H. J., Schumacker, P. T., & Danesh, F. R. (2012) · Cell Metabolism · doi:10.1016/j.cmet.2012.01.009 · Cited by 476 · cited 3×
“ROCK triggers fission by phosphorylating Drp1 at the Serine(616) (Ser(616)) residue in kidney podocytes and endothelial cells [12].”
Background
Cited by
Sorted by citations
Sharifi-Rad, M., Anil Kumar, N. V., Zucca, P., Varoni, E. M., Dini, L., Panzarini, E., Rajkovic, J., Tsouh Fokou, P. V., Azzini, E., Peluso, I., et al. (2020) · Frontiers in Physiology · doi:10.3389/fphys.2020.00694 · Cited by 1,971
“A recent study demonstrated the beneficial effect of empagliflozin on cardiac microvascular injury in diabetes and the protective mechanism against oxidative stress in mitochondria (Zhou et al., 2018).”
BackgroundLi, C., Zhang, J., Xue, M., Li, X., Han, F., Liu, X., Xu, L., Lu, Y., Cheng, Y., Li, T., et al. (2019) · Cardiovascular Diabetology · doi:10.1186/s12933-019-0816-2 · Cited by 604
Packer, M. (2022) · Circulation · doi:10.1161/circulationaha.122.061732 · Cited by 456
“…cells Only canagliflozin increased activity of AMPK Effect of canagliflozin to reduce proinflammatory signaling was attenuated by AMPK knockout Zhou et al. (2018)192 Empagliflozin Cardiac microvascular endothelial cells from diabetic mice Increased AMPK phosphorylation Reduction in cardiac…”
BackgroundThe role of oxidative stress in diabetes mellitus-induced vascular endothelial dysfunction
An, Y., Xu, B.-T., Wan, S., Xiu-mei, M., Long, Y., Xu, Y., & Jiang, Z. (2023) · Cardiovascular Diabetology · doi:10.1186/s12933-023-01965-7 · Cited by 462
“However, empagliflozin causes CMECs to migrate and promotes angiogenesis [128].”
BackgroundZhang, Y., Wang, Y., Xu, J., Tian, F., Hu, S., Chen, Y., & Fu, Z. (2018) · Journal of Pineal Research · doi:10.1111/jpi.12542 · Cited by 393
Zhu, P., Hu, S., Jin, Q., Li, D., Tian, F., Toan, S., Li, Y., Zhou, H., & Chen, Y. (2018) · Redox Biology · doi:10.1016/j.redox.2018.02.019 · Cited by 379
“IR injury aggravates the irreversible cardiomyocyte death and infarcted zone expansion, predisposing AMI patients to adverse left-ventricular remodeling and poor clinical prognosis [6].”
BackgroundKetone bodies: from enemy to friend and guardian angel
Kolb, H., Kempf, K., Röhling, M., Lenzen-Schulte, M., Schloot, N. C., & Martin, S. (2021) · BMC Medicine · doi:10.1186/s12916-021-02185-0 · Cited by 389
Li, R., Xin, T., Li, D., Wang, C., Zhu, H., & Zhou, H. (2018) · Redox Biology · doi:10.1016/j.redox.2018.07.011 · Cited by 353
“The SOD/GPx activity and GSH concentration were measured using commercial kits (Beyotime Institute of Biotechnology, China) following the manufacturer's instructions [44].”
MethodNew insights into the role of mitochondria in cardiac microvascular ischemia/reperfusion injury
Wang, J., Toan, S., & Zhou, H. (2020) · Angiogenesis · doi:10.1007/s10456-020-09720-2 · Cited by 311
Bonnet, F., & Scheen, A. J. (2018) · Diabetes & Metabolism · doi:10.1016/j.diabet.2018.09.005 · Cited by 322
The role of mitochondrial fission in cardiovascular health and disease
Quiles, J. M., & Gustafsson, Å. B. (2022) · Nature Reviews Cardiology · doi:10.1038/s41569-022-00703-y · Cited by 315
Zhou, H., Wang, J., Zhu, P., Zhu, H., Toan, S., Hu, S., Ren, J. T., & Chen, Y. (2018) · Basic Research in Cardiology · doi:10.1007/s00395-018-0682-1 · Cited by 299
“During mitochondrial fission, Drp1 is a critical executor that can assemble into a ring structure along the mitochondrial tubules, leading to the division of mitochondrial cells into daughter mitochondria [56].”
BackgroundMethodRetractedShao, Q., Meng, L., Lee, S., Tse, G., Gong, M., Zhang, Z., Zhao, J., Zhao, Y., Li, G., & Liu, T. (2019) · Cardiovascular Diabetology · doi:10.1186/s12933-019-0964-4 · Cited by 304
Yang, D., Wang, M., Zhang, C., & Wang, Y. (2024) · Frontiers in Endocrinology · doi:10.3389/fendo.2024.1359255 · Cited by 356
AMPK, Mitochondrial Function, and Cardiovascular Disease
Wu, S., & Zou, M.-H. (2020) · International Journal of Molecular Sciences · doi:10.3390/ijms21144987 · Cited by 286
“Empagliflozin recovered the AMP‐ to‐ATP ratio that is necessary for triggering AMPK activation [229].”
BackgroundInfluentialPang, B., Dong, G., Pang, T., Sun, X., Liu, X., Nie, Y., & Chang, X. (2024) · Angiogenesis · doi:10.1007/s10456-024-09938-4 · Cited by 282
Tumilaar, S. G., Hardianto, A., Dohi, H., & Kurnia, D. (2024) · Journal of Chemistry · doi:10.1155/2024/5594386 · Cited by 356
Cai, C., Guo, Z., Chang, X., Li, Z., Wu, F., He, J., Cao, T., Wang, K., Shi, N., Zhou, H., et al. (2022) · Redox Biology · doi:10.1016/j.redox.2022.102288 · Cited by 272
“Regarding mitochondrial biology, empagliflozin was found to inhibit hyperglycemia-induced mitochondrial fission [20] and lipopolysaccharide-stimulated mitochondrial oxidative stress [21] by activating AMP-activated protein kinase catalytic subunit alpha 1 (AMPKα1).”
BackgroundMethodAn Overview of the Cardiorenal Protective Mechanisms of SGLT2 Inhibitors
Salvatore, T., Galiero, R., Caturano, A., Rinaldi, L., Martino, A. D., Albanese, G., Salvo, J. D., Epifani, R., Marfella, R., Docimo, G., et al. (2022) · International Journal of Molecular Sciences · doi:10.3390/ijms23073651 · Cited by 279
Role of mitochondrial quality surveillance in myocardial infarction: From bench to bedside
Zhou, H., Ren, J. T., Toan, S., & Mui, D. (2020) · Ageing Research Reviews · doi:10.1016/j.arr.2020.101250 · Cited by 253
Lee, D. M., Battson, M. L., Jarrell, D. K., Hou, S., Ecton, K. E., Weir, T. L., & Gentile, C. L. (2018) · Cardiovascular Diabetology · doi:10.1186/s12933-018-0708-x · Cited by 246
Zhou, H., Li, D., Zhu, P., Ma, Q., Toan, S., Wang, J., Hu, S., Chen, Y., & Zhang, Y. (2018) · Journal of Pineal Research · doi:10.1111/jpi.12503 · Cited by 247
RetractedWang, Y., Jasper, H., Toan, S., Muid, D., Chang, X., & Zhou, H. (2021) · Redox Biology · doi:10.1016/j.redox.2021.102049 · Cited by 241
Zhou, H., Ma, Q., Zhu, P., Ren, J. T., Reiter, R. J., & Chen, Y. (2018) · Journal of Pineal Research · doi:10.1111/jpi.12471 · Cited by 229
Wang, Y., Tian, M., Tan, J., Pei, X., Lu, C., Xin, Y., Deng, S., Zhao, F., Gao, Y., & Gong, Y. (2022) · Journal of Neuroinflammation · doi:10.1186/s12974-022-02438-6 · Cited by 232
Yu, L., Dong, X., Xue, X., Xu, S. C., Zhang, X., Xu, Y., Wang, Z., Wang, Y., Gao, H., Liang, Y., et al. (2020) · Journal of Pineal Research · doi:10.1111/jpi.12698 · Cited by 222
Wang, J., Zhu, P., Li, R., Ren, J. T., & Zhou, H. (2019) · Redox Biology · doi:10.1016/j.redox.2019.101415 · Cited by 225
“ROS quantification was performed through the fluorescence intensity of mito-ROS and cyto-ROS, based on our previous studies [37,38].”
MethodTian, J., Zhang, M., Suo, M., Liu, D., Wang, X., Liu, M. R., Pan, J., Jin, T., & An, F. (2021) · Journal of Cellular and Molecular Medicine · doi:10.1111/jcmm.16601 · Cited by 217
Lu, Q., Yang, L.-J., Xiao, J., Liu, Q., Ni, L., Hu, J.-W., Yu, H. J., Wu, X., & Zhang, B. (2022) · Free Radical Biology and Medicine · doi:10.1016/j.freeradbiomed.2022.12.088 · Cited by 223
Uthman, L., Homayr, A., Juni, R. P., Spin, E., Kerindongo, R. P., Boomsma, M., Hollmann, M. W., Preckel, B., Koolwijk, P., van Hinsbergh, V. W. M., et al. (2019) · Cellular Physiology and Biochemistry · doi:10.33594/000000178 · Cited by 214
Lee, H., Shiou, Y.-L., Jhuo, S., Chang, C.-Y., Liu, P., Jhuang, W.-J., Dai, Z., Chen, W., Chen, Y.-F., & Lee, A. (2019) · Cardiovascular Diabetology · doi:10.1186/s12933-019-0849-6 · Cited by 211
“Empagliflozin preserved cardiac microvascular endothelial cell function through suppressed mitochondrial reactive oxygen species production [12].”
BackgroundJuni, R. P., Kuster, D. W. D., Goebel, M., Helmes, M., Musters, R. J. P., van der Velden, J., Koolwijk, P., Paulus, W. J., & van Hinsbergh, V. W. M. (2019) · JACC Basic to Translational Science · doi:10.1016/j.jacbts.2019.04.003 · Cited by 208
“Several pathways have been shown to be activated by TNF-a, in particular, the nuclear factor-kB (NK-kB) pathway, p38 mitogenactivated protein kinase (MAPK), JNK pathways, and ROS generation (31,32), which might be attenuated by empagliflozin.”
BackgroundEmpagliflozin protects heart from inflammation and energy depletion via AMPK activation
Koyani, C. N., Plastira, I., Sourij, H., Hallström, S., Schmidt, A. G., Rainer, P. P., Bugger, H., Frank, S., Malle, E., & von Lewinski, D. (2020) · Pharmacological Research · doi:10.1016/j.phrs.2020.104870 · Cited by 194
Sun, X., Han, F., Lu, Q., Li, X., Ren, D., Zhang, J., Han, Y., Xiang, Y. K., & Li, J. (2020) · Diabetes · doi:10.2337/db19-0991 · Cited by 193
“We found that EMPA treatment triggered eNOS phosphorylation at Ser(1177), indicating endothelial-protective effects of EMPA, which is consistent with a previous study (42).”
Mitochondrial quality control mechanisms as molecular targets in diabetic heart
Chang, X., Li, Y., Cai, C., Wu, F., He, J., Zhang, Y., Zhong, J., Tan, Y., Liu, R., Zhu, H., et al. (2022) · Metabolism · doi:10.1016/j.metabol.2022.155313 · Cited by 193
Empagliflozin attenuates diabetic tubulopathy by improving mitochondrial fragmentation and autophagy
Lee, Y. H., Kim, S. H., Kang, J. M., Heo, J. H., Kim, D.-J., Park, S. H., Sung, M. J., Kim, J., Oh, J., Yang, D. H., et al. (2019) · American Journal of Physiology-Renal Physiology · doi:10.1152/ajprenal.00565.2018 · Cited by 192
Uthman, L., Baartscheer, A., Schumacher, C. A., Fiolet, J. W. T., Kuschma, M. C., Hollmann, M. W., Coronel, R., Weber, N. C., & Zuurbier, C. J. (2018) · Frontiers in Physiology · doi:10.3389/fphys.2018.01575 · Cited by 190
“In microvascular coronary endothelial cells of mice with STZ-induced diabetes, Empa administration resulted in activation of AMPK, improved mitochondrial function through inhibition of Drp1-mediated fission, restoration of vascular barrier function, eNOS phosphorylation, adhesion molecules expression and reduced mitoc…”
BackgroundMolecular Mechanisms of Mitochondrial Quality Control in Ischemic Cardiomyopathy
Chang, X., Liu, R., Li, R., Peng, Y., Zhu, P., & Zhou, H. (2022) · International Journal of Biological Sciences · doi:10.7150/ijbs.76223 · Cited by 196
“What’s more, it triggers AMPK activation, inhibits Drp1 S616 phosphorylation and increases Drp1 S637 phosphorylation, which ultimately inhibits mitochondrial fission and restores mitochondrial function [145].”
BackgroundZhou, H., Zhu, P., Wang, J., Toan, S., & Ren, J. T. (2019) · Signal Transduction and Targeted Therapy · doi:10.1038/s41392-019-0094-1 · Cited by 184
SGLT‐2 Inhibitors in Heart Failure: Current Management, Unmet Needs, and Therapeutic Prospects
Lam, C. S. P., Chandramouli, C., Ahooja, V., & Verma, S. (2019) · Journal of the American Heart Association · doi:10.1161/jaha.119.013389 · Cited by 200
Wang, J., Toan, S., & Zhou, H. (2020) · Pharmacological Research · doi:10.1016/j.phrs.2020.104771 · Cited by 187
Fan, H., Ding, R., Liu, W., Zhang, X., Li, R., Wei, B., Su, S., Jin, F., Wei, C., He, X., et al. (2021) · Redox Biology · doi:10.1016/j.redox.2021.101856 · Cited by 183
“Potent evidence displayed that activation of AMPK at the site of Thr172 could modulate mitochondrial biogenesis and fission [22,23], reduce ROS [24,25] and mitigate cell apoptosis [26] in various pathological processes.”
BackgroundSodium-glucose co-transporter 2 inhibitor therapy: mechanisms of action in heart failure
Joshi, S. S., Singh, T., Newby, D. E., & Singh, J. S. (2021) · Heart · doi:10.1136/heartjnl-2020-318060 · Cited by 191
Pang, B., Dong, G., Pang, T., Sun, X., Liu, X., Nie, Y., & Chang, X. (2024) · Frontiers in Pharmacology · doi:10.3389/fphar.2024.1422686 · Cited by 175
Dyck, J. R. B., Sossalla, S. T., Hamdani, N., Coronel, R., Weber, N. C., Light, P. E., & Zuurbier, C. J. (2022) · Journal of Molecular and Cellular Cardiology · doi:10.1016/j.yjmcc.2022.03.005 · Cited by 181
Zhou, H., Chen, S., Hu, S., Zhu, H., Ren, J. T., & Chen, Y. (2018) · Angiogenesis · doi:10.1007/s10456-018-9611-z · Cited by 173
“After reaching confluence, an electrical endothelial resistance system (Millipore, USA) was used to measure TER as previously described [31].”
MethodYu, Z., Xu, C., Song, B., Zhang, S., Chen, C., Li, C., & Zhang, S. (2023) · Journal of Translational Medicine · doi:10.1186/s12967-023-04554-0 · Cited by 191
“AMPKα is an intracellular energy receptor involved in the regulation of redox homeostasis [237].”
BackgroundSGLT2 inhibitors: from glucose-lowering to cardiovascular benefits
Preda, A., Montecucco, F., Carbone, F., Camici, G. G., Lüscher, T. F., Kraler, S. C., & Liberale, L. (2024) · Cardiovascular Research · doi:10.1093/cvr/cvae047 · Cited by 210
Zhang, Y., Li, M., Wang, Y., Han, F., Shen, K., Luo, L., Li, Y., Jia, Y., Zhang, J., Cai, W., et al. (2023) · Bioactive Materials · doi:10.1016/j.bioactmat.2023.01.020 · Cited by 166
ER–Mitochondria Microdomains in Cardiac Ischemia–Reperfusion Injury: A Fresh Perspective
Zhou, H., Wang, S., Hu, S., Chen, Y., & Ren, J. T. (2018) · Frontiers in Physiology · doi:10.3389/fphys.2018.00755 · Cited by 161
Endothelial response to glucose: dysfunction, metabolism, and transport
Clyne, A. M. (2021) · Biochemical Society Transactions · doi:10.1042/bst20200611 · Cited by 168
Zhou, H., Wang, J., Zhu, P., Hu, S., & Ren, J. T. (2018) · Cellular Signalling · doi:10.1016/j.cellsig.2018.01.020 · Cited by 151
Yaribeygi, H., Butler, A. E., Atkin, S. L., Katsiki, N., & Sahebkar, A. (2018) · Journal of Cellular Physiology · doi:10.1002/jcp.26851 · Cited by 149
“Furthermore, empagliflozin was shown to decrease markers of oxidative stress in both the circulation and the aorta of diabetic mice (Oelze et al., 2014) as well as in the mitochondria of cardiac endothelial cells (Zhou et al., 2018).”
BackgroundXiong, Y., Knoedler, S. A., Alfertshofer, M. G., Kim, B., Jiang, D., Liu, G., Rinkevich, Y., & Mi, B. (2025) · Cell Death and Disease · doi:10.1038/s41419-025-07583-3 · Cited by 157
Li, Q., Tan, Y., Chen, S., Xiao, X., Zhang, M., Wu, Q., & Dong, M. (2020) · Journal of Receptors and Signal Transduction · doi:10.1080/10799893.2020.1808675 · Cited by 137
“Cell viability and LDH in the supernatant was then measured based on the absorbance of the converted dye according to the manufacturer’s protocol [31,32].”
MethodWang, J., Zhu, P., Li, R., Ren, J. T., Zhang, Y., & Zhou, H. (2019) · Theranostics · doi:10.7150/thno.40098 · Cited by 134
“steps were repeated for three times before centrifugation of supernatants at 10,000 × g to extract mitochondrial fraction [37].”
MethodDanan, S., Wang, J., Toan, S., Muid, D., Li, R., Chang, X., & Zhou, H. (2022) · Angiogenesis · doi:10.1007/s10456-022-09835-8 · Cited by 136
Zhou, H., & Toan, S. (2020) · Biomolecules · doi:10.3390/biom10010085 · Cited by 136
Tuleta, I., & Frangogiannis, N. G. (2021) · Advanced Drug Delivery Reviews · doi:10.1016/j.addr.2021.113904 · Cited by 142
Chang, X., Zhang, Q., Huang, Y., Liu, J., Wang, Y., Guan, X., Wu, Q., Liu, Z., & Liu, R. (2024) · Phytotherapy Research · doi:10.1002/ptr.8177 · Cited by 134
Emergence of SGLT2 Inhibitors as Powerful Antioxidants in Human Diseases
Tsai, K., Chen, Y., Chiou, T. T., Chu, T., Li, L., Ng, H., Lee, W., & Lee, C. (2021) · Antioxidants · doi:10.3390/antiox10081166 · Cited by 140
Durante, W., Behnammanesh, G., & Peyton, K. J. (2021) · International Journal of Molecular Sciences · doi:10.3390/ijms22168786 · Cited by 135
Lu, Y., Chang, Y., Li, T., Han, F., Li, C., Li, X., Xue, M., Cheng, Y., Meng, Z., Han, Z., et al. (2020) · International Journal of Biological Sciences · doi:10.7150/ijbs.33007 · Cited by 131
“Empagliflozin has been previously reported to trigger AMPK activation [40], which increased phosphorylation of AKT [41], resulting in CREB phosphorylation [42].”
BackgroundXu, H.-X., Cui, S., Zhang, Y., & Ren, J. T. (2020) · Acta Pharmacologica Sinica · doi:10.1038/s41401-020-0476-5 · Cited by 134
Kulkarni, A. S., Aleksić, S., Berger, D. M., Sierra, F., Kuchel, G. A., & Barzilai, N. (2022) · Aging Cell · doi:10.1111/acel.13596 · Cited by 132
“…empagliflozin increased the AMP/ATP ratio in a cardiac injury model, induced renoprotection in diabetic mouse kidneys via inhibition of mTORC1 hyperactivation, while aspirin recapitulated metabolic effects of caloric restriction (Pietrocola et al., 2018; Tomita et al., 2020; H. Zhou et al., 2018).”
BackgroundZou, R., Shi, W., Qiu, J., Zhou, N., Du, N., Zhou, H., Chen, X., & Ma, L. (2022) · Cardiovascular Diabetology · doi:10.1186/s12933-022-01532-6 · Cited by 132
“Empagliflozin has already been widely reported to inhibit mitochondrial fission in various cell types, including adipocytes [68], renal tubular cells [69] and endothelial cells[32].”
BackgroundMethodChen, Y., Su, L., Yin, M., Li, Y., Chen, C., Zhang, J., Sun, K., Kong, X., Chen, Z., & Qian, J. (2022) · Diabetes · doi:10.2337/db22-0553 · Cited by 130
SGLT2 Inhibitors Play a Salutary Role in Heart Failure via Modulation of the Mitochondrial Function
Maejima, Y. (2020) · Frontiers in Cardiovascular Medicine · doi:10.3389/fcvm.2019.00186 · Cited by 133
Packer, M. (2020) · Journal of the American Society of Nephrology · doi:10.1681/asn.2020010010 · Cited by 126
Ma, L., Zou, R., Shi, W., Zhou, N., Chen, S., Zhou, H., Chen, X., & Wu, Y. (2022) · Theranostics · doi:10.7150/thno.75121 · Cited by 125
“endothelial survival and improved coronary function in diabetic mice [44].”
BackgroundZhou, H., Yue, Y., Wang, J., Ma, Q., & Chen, Y. (2018) · Cellular Signalling · doi:10.1016/j.cellsig.2018.03.012 · Cited by 124
DNA-PKcs promotes sepsis-induced multiple organ failure by triggering mitochondrial dysfunction
Zou, R., Tao, J., Qiu, J., Lu, H., Wu, J., Zhu, H., Li, R., Mui, D., Toan, S., Chang, X., et al. (2022) · Journal of Advanced Research · doi:10.1016/j.jare.2022.01.014 · Cited by 124
“Our previous studies reported dysregulatedmitochondrial homeostasis as a potential mechanism participating in organ dysfunction mediated by myocardial ischemic injury [9], chronic alcoholic liver damage [10], sepsis-related acute kidney injury [11], and hyperglycemia-induced cardiac microvascular dysfunction [12].”
BackgroundLiu, X., Xu, C., Xu, L., Li, X., Sun, H., Xue, M., Li, T., Yu, X., Sun, B., & Chen, L. (2020) · Metabolism · doi:10.1016/j.metabol.2020.154334 · Cited by 126
Diabetes Mellitus, Mitochondrial Dysfunction and Ca2+-Dependent Permeability Transition Pore
Belosludtsev, K. N., Belosludtseva, N. V., & Dubinin, M. V. (2020) · International Journal of Molecular Sciences · doi:10.3390/ijms21186559 · Cited by 124
“Notably, the SGLT2 inhibitors empagliflozin and dapagliflozin modulate the activity of mitochondrial dynamics via the regulation of fission (FIS1 and DRP1) and fusion (MFN1 and MFN2) proteins [34,94,95].”
BackgroundMeng, Z., Liu, X., Li, T., Fang, T., Cheng, Y., Han, L., Sun, B., & Chen, L. (2021) · International Immunopharmacology · doi:10.1016/j.intimp.2021.107492 · Cited by 123
El-Daly, M., Pulakazhi Venu, V. K., Saifeddine, M., Mihara, K., Kang, S., Fedak, P. W. M., Alston, L. A., Hirota, S. A., Ding, H., Triggle, C. R., et al. (2018) · Vascular Pharmacology · doi:10.1016/j.vph.2018.06.006 · Cited by 117
Pandey, A. K., Bhatt, D. L., Pandey, A. K., Marx, N., Cosentino, F., Pandey, A., & Verma, S. (2023) · European Heart Journal · doi:10.1093/eurheartj/ehad389 · Cited by 125
Luna-Marco, C., Iannantuoni, F., Hermo-Argibay, A., Devos, D., Salazar, J. D., Víctor, V. M., & Rovira-Llopis, S. (2024) · Free Radical Biology and Medicine · doi:10.1016/j.freeradbiomed.2024.01.015 · Cited by 114
Zhang, X., Zhou, H., & Chang, X. (2023) · Archives of Toxicology · doi:10.1007/s00204-023-03599-w · Cited by 115
Impact of SGLT2 Inhibitors on Heart Failure: From Pathophysiology to Clinical Effects
Palmiero, G., Cesaro, A., Vetrano, E., Pafundi, P. C., Galiero, R., Caturano, A., Moscarella, E., Gragnano, F., Salvatore, T., Rinaldi, L., et al. (2021) · International Journal of Molecular Sciences · doi:10.3390/ijms22115863 · Cited by 124
“These are followed by an improvement of the barrier function of the vascular system by the phosphorylation of nitric oxide endothelial synthase (eNOS) and reduction of microvascular endothelial lesions in coronary endothelial cells [145].”
BackgroundTargeting mitochondrial fusion and fission proteins for cardioprotection
Hernández‐Reséndiz, S., Prunier, F., Girão, H., Dorn, G. W., Hausenloy, D. J., & (CA16225), E. C. A. (2020) · Journal of Cellular and Molecular Medicine · doi:10.1111/jcmm.15384 · Cited by 114
Packer, M. (2020) · Cardiovascular Diabetology · doi:10.1186/s12933-020-01041-4 · Cited by 113
Yang, L., Li, X., Jiang, A., Li, X., Chang, W., Chen, J., & Ye, F. (2020) · Redox Biology · doi:10.1016/j.redox.2020.101626 · Cited by 112
“However, in study of Empagliflozin-ameliorated diabetic cardiac microvascular injury, activation of AMPK induces mitochondrial fission via dynamin-related/-like protein 1 (Drp1) phosphorylation and activation, which is a critical modulator to stimulate mitochondrial fission [14].”
BackgroundHoong, C. W. S., & Chua, M. W. J. (2021) · Endocrinology · doi:10.1210/endocr/bqab079 · Cited by 112
Insights into SGLT2 inhibitor treatment of diabetic cardiomyopathy: focus on the mechanisms
Huang, K., Luo, X., Liao, B., Li, G., & Feng, J. (2023) · Cardiovascular Diabetology · doi:10.1186/s12933-023-01816-5 · Cited by 117
“SGLT2i were reported to improve endothelial function in mice with STZ-induced diabetes by inhibiting abnormal mitochondrial fission and endothelial inflammation [46].”
BackgroundAutophagy as an emerging target in cardiorenal metabolic disease: From pathophysiology to management
Zhang, Y., Whaley‐Connell, A. T., Sowers, J. R., & Ren, J. T. (2018) · Pharmacology & Therapeutics · doi:10.1016/j.pharmthera.2018.06.004 · Cited by 109
“Recent findings from our own lab suggested that empagliflozin rescuedmyocardialmicrovascular injury in diabetes via AMPK-mediated inhibition of mitochondrial fission (Zhou et al., 2018) although direct impact on mitophagy by SGLT-2 inhibitors remains to be explored.”
Alshnbari, A. S., Millar, S., O’Sullivan, S. E., & IDRIS, I. R. (2020) · Diabetes Therapy · doi:10.1007/s13300-020-00885-z · Cited by 109
Empagliflozin attenuates ischemia and reperfusion injury through LKB1/AMPK signaling pathway
Lü, Q., Liu, J., Li, X., Sun, X., Zhang, J., Ren, D., Tong, N., & Li, J. (2019) · Molecular and Cellular Endocrinology · doi:10.1016/j.mce.2019.110642 · Cited by 107
Mitophagy Receptors and Mediators: Therapeutic Targets in the Management of Cardiovascular Ageing
Ajoolabady, A., Aslkhodapasandhokmabad, H., Aghanejad, A., Zhang, Y., & Ren, J. T. (2020) · Ageing Research Reviews · doi:10.1016/j.arr.2020.101129 · Cited by 103
Ortega, R., Collado, A., Selles, F., Navarro, H. G., Sanz, M., Real, J. T., & Piqueras, L. (2019) · Arteriosclerosis Thrombosis and Vascular Biology · doi:10.1161/atvbaha.119.312659 · Cited by 102
Empagliflozin prevents cardiomyopathy via sGC-cGMP-PKG pathway in type 2 diabetes mice
Xue, M., Li, T., Wang, Y., Chang, Y., Cheng, Y., Lu, Y., Liu, X., Xu, L., Li, X., Yu, X., et al. (2019) · Clinical Science · doi:10.1042/cs20190585 · Cited by 101
Salvatore, T., Galiero, R., Caturano, A., Vetrano, E., Loffredo, G., Rinaldi, L., Catalini, C., Gjeloshi, K., Albanese, G., Di Martino, A., et al. (2022) · Biomedicines · doi:10.3390/biomedicines10092274 · Cited by 98
“At the end of treatment, all mice were euthanized, and the hearts were collected for further experimentation [283].”
BackgroundMethodInfluentialYap regulates gastric cancer survival and migration via SIRT1/Mfn2/mitophagy
Yan, H., Qiu, C., Sun, W., Gu, M., Xiao, F., Zou, J., & Zhang, L. (2018) · Oncology Reports · doi:10.3892/or.2018.6252 · Cited by 96
“Mitophagy activation may reduce mitochondrial oxidative stress injury, alleviate mitochondrial calcium overload, block mitochondrial pro-apoptotic factor leakage and promote cellular ATP generation (6-8).”
RetractedPacker, M. (2020) · European Journal of Heart Failure · doi:10.1002/ejhf.1732 · Cited by 100
Andreadou, I., Bell, R. M., Bøtker, H. E., & Zuurbier, C. J. (2020) · Biochimica et Biophysica Acta (BBA) - Molecular Basis of Disease · doi:10.1016/j.bbadis.2020.165770 · Cited by 98
Yang, H., Lv, D., Qu, S., Xu, H., Li, S., Wang, Z., Cao, X., Rong, Y., Li, X., Wu, H., et al. (2024) · Advanced Science · doi:10.1002/advs.202403219 · Cited by 100
Zhou, H., Wang, J., Hu, S., Zhu, H., Toan, S., & Ren, J. T. (2018) · Journal of Cellular Physiology · doi:10.1002/jcp.27308 · Cited by 94
Chen, Z., Wang, C., Yu, N., Si, L., Zhu, L. F., Zeng, A., Liu, Z., & Wang, X. (2018) · Biomedicine & Pharmacotherapy · doi:10.1016/j.biopha.2018.12.046 · Cited by 91
RetractedLiu, J., Yan, W., Zhao, X., Jia, Q., Wang, J., Zhang, H., Liu, C., He, K., & Sun, Z. (2018) · Cellular Signalling · doi:10.1016/j.cellsig.2018.09.009 · Cited by 90
Metadata
- Authors
- Zhou, H., Wang, S., Zhu, P., Hu, S., Chen, Y., & Ren, J.
- Affiliations
- Chinese PLA General Hospital (CN)
- University of Wyoming (US)
- Corresponding author
- Zhou, Hao
- Chen, Yundai
- Ren, Jun
- Venue
- Redox Biology
- Publisher
- Elsevier BV
- Published
- 2018-05
- Volume
- 15
- Pages
- 335-346
- ISSN
- 2213-2317 (ISSN-L)
- PMC
- PMC5756062
- OpenAlex
- W2777514005
- Cited by
- 550
- References
- 63
- Citations by year
- 2026: 34 · 2025: 53 · 2024: 87 · 2023: 71 · 2022: 71 · 2021: 65 · 2020: 63 · 2019: 53 · 2018: 50
- FWCI
- 35.91
- Type
- journal article
- Language
- en
- Update notices
- erratum (2024-05-01)
- Open access
- gold
- doi.org
- Licence
- Locations
- Redox Biology (publishedVersion, cc-by-nc-nd)
- PubMed Central (publishedVersion, cc-by-nc-nd)
- PubMed (publishedVersion)
- DOAJ (DOAJ: Directory of Open Access Journals) (submittedVersion, cc-by-sa)
- Funders
- National Natural Science Foundation of China (81441008, 81030002, 81102079, 81270186)
- Topics
- Health Sciences › Medicine › Endocrinology, Diabetes and Metabolism › Diabetes Treatment and Management
- Health Sciences › Medicine › Cardiology and Cardiovascular Medicine › Cardiovascular Function and Risk Factors
- Life Sciences › Biochemistry, Genetics and Molecular Biology › Molecular Biology › Mitochondrial Function and Pathology
- Keywords
- empagliflozin, SGLT2 inhibitors, diabetic cardiomyopathy, mitochondrial fission, AMPK, Drp1 phosphorylation, endothelial barrier function, endothelial cell senescence, mitochondrial reactive oxygen species, oxidative stress, angiogenesis, endothelial cell migration, F-actin depolymerization, eNOS phosphorylation, type 2 diabetes
- MeSH terms
- AMP-Activated Protein Kinase Kinases, Animals, Benzhydryl Compounds, Diabetes Mellitus, Type 2, Glucosides, Heart Injuries, Humans, Mitochondria, Protein Kinases, Endothelial Cells, Mice, Mitochondrial Dynamics
About these checks
Registry, retraction, Cites and statistics results are computed, not judged, with one exception: a printed reference that no index lists is read once by a model before it counts as a citation error. Claims are extracted by a model and kept only when their quote appears verbatim in the text; each cited source is then checked, with a model’s help, for whether it says what the claim relies on. Those verdicts can be wrong — read the claim’s quote and the cited source before relying on one.
Statistics and arithmetic are recomputed, not judged.
Confidence bands are shown only for fields calibrated on our annotated test set. None is calibrated yet, so no band is shown.
What counts as a claim ›How we measure confidence ›How we check this ›
Are you an author, or do you see a problem with this page? Request a review
