

The DOI matches its Crossref record; 47 of the 48 references it cites were found in a registry or an index.
Small-Molecule-Driven Hepatocyte Differentiation of Human Pluripotent Stem Cells
Open accessAbstract
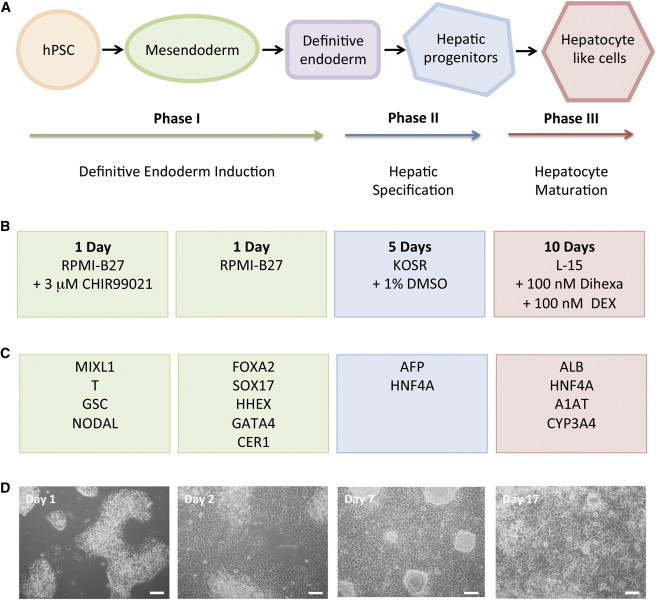
The differentiation of pluripotent stem cells to hepatocytes is well established, yet current methods suffer from several drawbacks. These include a lack of definition and reproducibility, which in part stems from continued reliance on recombinant growth factors. This has remained a stumbling block for the translation of the technology into industry and the clinic for reasons associated with cost and quality. We have devised a growth-factor-free protocol that relies on small molecules to differentiate human pluripotent stem cells toward a hepatic phenotype. The procedure can efficiently direct both human embryonic stem cells and induced pluripotent stem cells to hepatocyte-like cells. The final population of cells demonstrates marker expression at the transcriptional and protein levels, as well as key hepatic functions such as serum protein production, glycogen storage, and cytochrome P450 activity.
Overview
The claims and statistics of this paper haven’t been checked yet.
Run the check — free, no account needed. It reads the open-access text and checks the sources it cites.
Integrity signals
Registry
Cites
Statistics
Figures
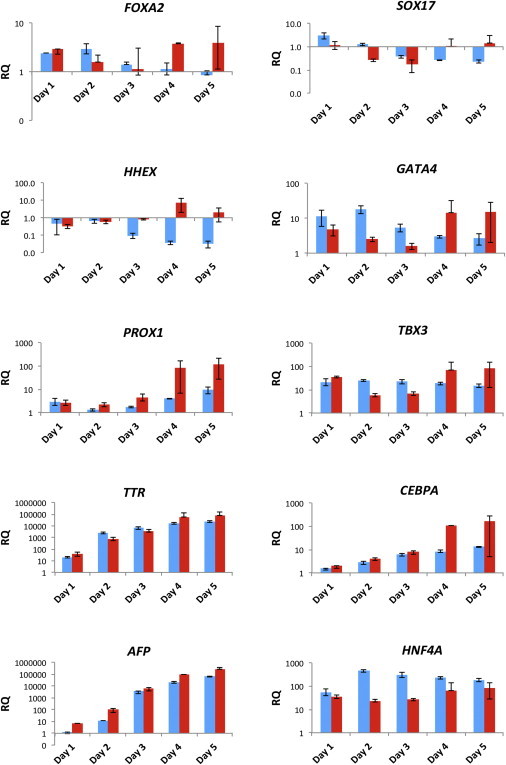
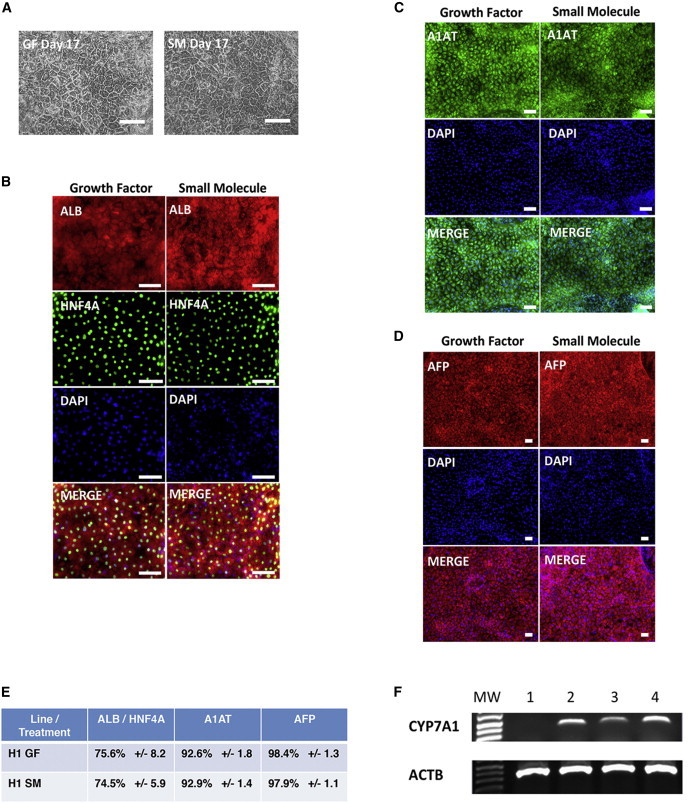
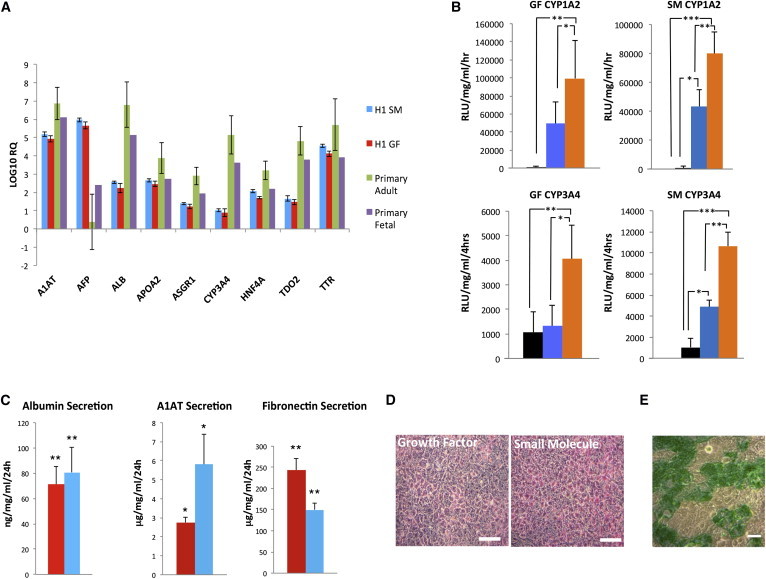
Verification
Claims the paper makes
The claims and statistics of this paper haven’t been checked yet.
Run the check — free, no account needed. It reads the open-access text and checks the sources it cites.
Claims other papers make about this one
Each is checked against this paper’s own text: does it say what the citing paper says it does?
The source backs part of the claim, not all of it — or backs it for a different population, condition or comparison.
In the citing paper
“While growth factors could be costly and unstable, and many small-molecule drugs can affect multiple pathways resulting in poor reproducibility78”
From Organoids (2022) · cites this paper as [78]
Experimental — accuracy not yet measuredThe source backs part of the claim, not all of it — or backs it for a different population, condition or comparison.
In the citing paper
“The differentiation protocol utilized was developed and optimized from the published literatures18–21, specifically chosen for its capacity to generate iHLOs with high CYP enzyme activity, particularly CYP3A4, which is crucial for drug metabolism and toxicology evaluations.”
From Temporal proteomic profiling of iPSC-derived human liver organoids reveals optimal maturation for drug metabolism and toxicology (2026) · cites this paper as [18]
Experimental — accuracy not yet measuredThe source backs part of the claim, not all of it — or backs it for a different population, condition or comparison.
In the citing paper
“This protocol was chosen due to its demonstrated capacity to generate iHLOs with high CYP enzyme activity, particularly CYP3A4, which is crucial for our subsequent compound or drug metabolism and toxicology evaluations.”
From Temporal proteomic profiling of iPSC-derived human liver organoids reveals optimal maturation for drug metabolism and toxicology (2026) · cites this paper as [18]
Experimental — accuracy not yet measured
Self-check
Percentages, sums and reported differences re-computed from the paper’s own numbers.
The self-check needs the paper’s full text.
Citations
Cites
Sato, N., Meijer, L., Skaltsounis, A., Greengard, P., & Brivanlou, A. H. (2003) · Nature Medicine · doi:10.1038/nm979 · Cited by 2,139 · cited 2×
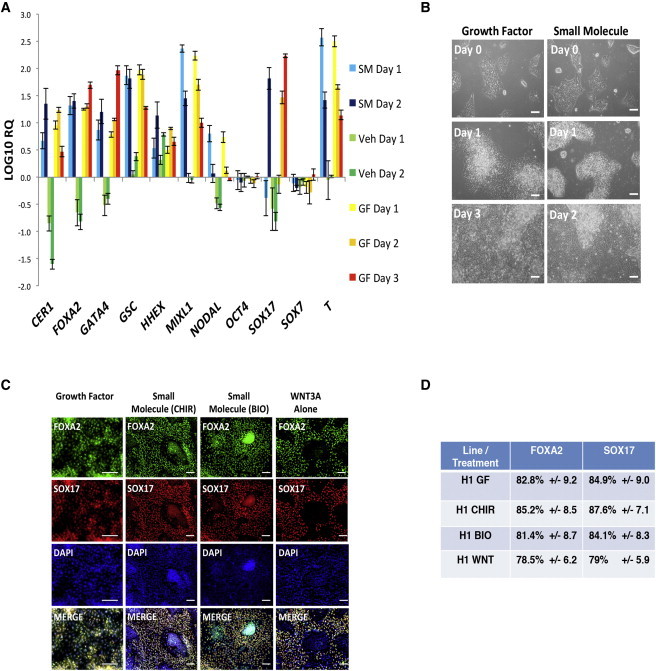
“…well documented that BIO and CHIR99021 are potent pharmacological GSK3-specific inhibitors that result in activation of the Wnt signaling pathway (Sato et al., 2004; Sineva and Pospelov, 2010), so we next assessed the ability of the protein Wnt3a alone to drive differentiation toward DE. Figure…”
BackgroundEfficient differentiation of human embryonic stem cells to definitive endoderm
D'Amour, K. A., Agulnick, A. D., Eliazer, S., Kelly, O. G., Kroon, E., & Baetge, E. E. (2005) · Nature Biotechnology · doi:10.1038/nbt1163 · Cited by 1,730
Lian, X., Hsiao, C., Wilson, G., Zhu, K., Hazeltine, L. B., Azarin, S. M., Raval, K. K., Zhang, J., Kamp, T. J., & Palecek, S. P. (2012) · Proceedings of the National Academy of Sciences · doi:10.1073/pnas.1200250109 · Cited by 1,717
Itskovitz‐Eldor, J., Schuldiner, M., Kenyagin‐Karsenti, D., Eden, A., Yanuka, O., Amit, M., Soreq, H., & Benvenisty, N. (2000) · Molecular Medicine · doi:10.1007/bf03401776 · Cited by 1,502
Embryonic stem cell trials for macular degeneration: a preliminary report
Schwartz, S. D., Hubschman, J.-P., Heilwell, G., Franco-Cardenas, V., Pan, C. K., Ostrick, R. M., Mickunas, E., Gay, R., Klimanskaya, I., & Lanza, R. (2012) · The Lancet · doi:10.1016/s0140-6736(12)60028-2 · Cited by 1,409 · cited 1×
“Meanwhile, cell culture and production technologies are rapidly improving, and the first instances of pluripotent-cellderived therapies have entered clinical trials (Schwartz et al., 2012).”
BackgroundHighly efficient generation of human hepatocyte-like cells from induced pluripotent stem cells
Si-Tayeb, K., Noto, F. K., Nagaoka, M., Li, J., Battle, M. A., Duris, C., North, P. E., Dalton, S., & Duncan, S. A. (2010) · Hepatology · doi:10.1002/hep.23354 · Cited by 1,282 · cited 2×
“…growth factor (VEGF), epidermal growth factor (EGF), and bone morphogenetic protein 4 (BMP4) (Agarwal et al., 2008; Brolén et al., 2010; Cai et al., 2007; Chen et al., 2012; Hay et al., 2008; Liu et al., 2010; Si-Tayeb et al., 2010b; Song et al., 2009; Sullivan et al., 2010; Touboul et al., 2010).”
BackgroundMethodOrganogenesis and development of the liver
Si-Tayeb, K., Lemaigre, F. P., & Duncan, S. A. (2010) · Developmental Cell · doi:10.1016/j.devcel.2010.01.011 · Cited by 800 · cited 2×
“…growth factor (VEGF), epidermal growth factor (EGF), and bone morphogenetic protein 4 (BMP4) (Agarwal et al., 2008; Brolén et al., 2010; Cai et al., 2007; Chen et al., 2012; Hay et al., 2008; Liu et al., 2010; Si-Tayeb et al., 2010b; Song et al., 2009; Sullivan et al., 2010; Touboul et al., 2010).”
BackgroundMethodDepletion of definitive gut endoderm in Sox17 -null mutant mice
Kanai-Azuma, M., Kanai, Y., Gad, J. M., Tajima, Y., Taya, C., Kurohmaru, M., Sanai, Y., Yonekawa, H., Yazaki, K., Tam, P. P. L., et al. (2002) · Development · doi:10.1242/dev.129.10.2367 · Cited by 704
Sasaki, H., & Hogan, B. L. M. (1993) · Development · doi:10.1242/dev.118.1.47 · Cited by 665
Directed differentiation of human embryonic stem cells into functional hepatic cells†
Cai, J., Zhao, Y., Liu, Y., Ye, F., Song, Z., Qin, H., Meng, S., Chen, Y., Zhou, R., Song, X., et al. (2007) · Hepatology · doi:10.1002/hep.21582 · Cited by 628 · cited 3×
“…endothelial growth factor (VEGF), epidermal growth factor (EGF), and bone morphogenetic protein 4 (BMP4) (Agarwal et al., 2008; Brolén et al., 2010; Cai et al., 2007; Chen et al., 2012; Hay et al., 2008; Liu et al., 2010; Si-Tayeb et al., 2010b; Song et al., 2009; Sullivan et al., 2010; Touboul…”
Background
Cited by
Sorted by citations
Zhao, Z., Chen, X., Dowbaj, A. M., Sljukic, A., Bratlie, K., Lin, L., Fong, E. L. S., Balachander, G. M., Chen, Z., Soragni, A., et al. (2022) · Nature Reviews Methods Primers · doi:10.1038/s43586-022-00174-y · Cited by 1,082
Cell sources for in vitro human liver cell culture models
Zeilinger, K., Freyer, N., Damm, G., Seehofer, D., & Knöspel, F. (2016) · Experimental Biology and Medicine · doi:10.1177/1535370216657448 · Cited by 230
Cardiac differentiation of human pluripotent stem cells in scalable suspension culture
Kempf, H., Kropp, C., Olmer, R., Martin, U., & Zweigerdt, R. (2015) · Nature Protocols · doi:10.1038/nprot.2015.089 · Cited by 161
Recombinant Laminins Drive the Differentiation and Self-Organization of hESC-Derived Hepatocytes
Cameron, K., Tan, R., Schmidt‐Heck, W., Campos, G., Lyall, M. J., Wang, Y., Lucendo‐Villarin, B., Szkolnicka, D., Bates, N., Kimber, S. J., et al. (2015) · Stem Cell Reports · doi:10.1016/j.stemcr.2015.10.016 · Cited by 151
“Other studies have used small molecules to replace growth factors to drive down the cost of the method (Hay et al., 2007, 2008; Siller et al., 2015); however, those publishedmethods both still rely upon the use of undefined components, highlighting the need to develop defined systems.”
MethodLiver Organoids: Recent Developments, Limitations and Potential
Harrison, S. P., Baumgarten, S., Verma, R., Lunov, O., Dejneka, A., & Sullivan, G. J. (2021) · Frontiers in Medicine · doi:10.3389/fmed.2021.574047 · Cited by 152
Self-citationKempf, H., Olmer, R., Haase, A., Franke, A., Bolesani, E., Schwanke, K., Diaz, D. R., Coffee, M., Göhring, G., Dräger, G., et al. (2016) · Nature Communications · doi:10.1038/ncomms13602 · Cited by 128
Fernández-Checa, J. C., Bagnaninchi, P., Ye, H., Sancho‐Bru, P., Falcón‐Pérez, J. M., Royo, F., García‐Ruiz, C., Konu, Ö., Miranda, J. P., Lunov, O., et al. (2021) · Journal of Hepatology · doi:10.1016/j.jhep.2021.06.021 · Cited by 131
Self-citationCurrent progress in hepatic tissue regeneration by tissue engineering
Hosseini, V., Maroufi, N. F., Saghati, S., Asadi, N., Darabi, M., Ahmad, S. N. S., Hosseinkhani, H., & Rahbarghazi, R. (2019) · Journal of Translational Medicine · doi:10.1186/s12967-019-02137-6 · Cited by 122
Scalable production of tissue-like vascularized liver organoids from human PSCs
Harrison, S. P., Siller, R., Tanaka, Y., Chollet, M. E., de la Morena-Barrio, M. E., Xiang, Y., Patterson, B., Andersen, E., Bravo-Pérez, C., Kempf, H., et al. (2023) · Experimental & Molecular Medicine · doi:10.1038/s12276-023-01074-1 · Cited by 119
Self-citationBiotechnology Challenges to In Vitro Maturation of Hepatic Stem Cells
Chen, C., Soto–Gutiérrez, A., Baptista, P. M., & Spee, B. (2018) · Gastroenterology · doi:10.1053/j.gastro.2018.01.066 · Cited by 108
Du, C., Feng, Y., Qiu, D., Xu, Y., Pang, M., Cai, N., Xiang, A. P., & Zhang, Q. (2018) · Stem Cell Research & Therapy · doi:10.1186/s13287-018-0794-4 · Cited by 106
“In contrast to published protocols using RPMI 1640 and B-27 Supplement as the basal medium [34], we also changed the basal medium to RPMI 1640 and B-27 Supplement Minus Insulin to improve the definitive endoderm generation efficiency.”
BackgroundResultInfluentialThe potential of induced pluripotent stem cell derived hepatocytes
Hannoun, Z., Steichen, C., Dianat, N., Weber, A., & Dubart‐Kupperschmitt, A. (2016) · Journal of Hepatology · doi:10.1016/j.jhep.2016.02.025 · Cited by 107
“pluripotent stem cells to hepatocytes [58].”
Halloin, C., Schwanke, K., Löbel, W., Franke, A., Szepes, M., Biswanath, S., Wunderlich, S., Merkert, S., Weber, N., Osten, F., et al. (2019) · Stem Cell Reports · doi:10.1016/j.stemcr.2019.06.004 · Cited by 100
“Notably, chemical WNT pathway stimulators (particularly the GSK3 inhibitor CHIR99021 [CHIR]) or suppressors (including IWP2, IWR1, and Wnt-C59) have also been applied to specify other mesendodermal lineages including hepatocytes (Siller et al., 2015) and skeletal muscle cells (Shelton et al.”
BackgroundComparing in vitro human liver models to in vivo human liver using RNA-Seq
Gupta, R., Schrooders, Y., Hauser, D. A., van Herwijnen, M. H. M., Albrecht, W., ter Braak, B., Brecklinghaus, T., Castell, J. V., Elenschneider, L., Escher, S. E., et al. (2020) · Archives of Toxicology · doi:10.1007/s00204-020-02937-6 · Cited by 98
Laco, F., Woo, T. L., Zhong, Q., Szmyd, R., Ting, S., Khan, F. J., Chai, C. L. L., Reuveny, S., Chen, A., & Oh, S. (2018) · Stem Cell Reports · doi:10.1016/j.stemcr.2018.03.023 · Cited by 98
“A low CHIR concentration has been shown to lead to endoderm development, which can induce hepatocyte differentiation (Siller et al., 2015).”
BackgroundHuang, J., Guo, X., Li, W., & Zhang, H. (2017) · Scientific Reports · doi:10.1038/srep40716 · Cited by 95
Small molecule–driven direct conversion of human pluripotent stem cells into functional osteoblasts
Kang, H., Shih, Y.-R. V., Nakasaki, M., Kabra, H., & Varghese, S. (2016) · Science Advances · doi:10.1126/sciadv.1600691 · Cited by 80
Stem Cell-Based Therapies for Liver Diseases: An Overview and Update
Wang, J., Sun, M., Liu, W., Li, Y., & Li, M. (2019) · Tissue Engineering and Regenerative Medicine · doi:10.1007/s13770-019-00178-y · Cited by 77
“Most of them apply growth factors and cytokines such as activin A, Wnt3a, hepatocyte growth factor (HGF), oncostatin M (OsM) to induce liver development in vitro [76, 77].”
BackgroundHuman Pluripotent Stem Cell-Derived Endoderm for Modeling Development and Clinical Applications
Yiangou, L., Ross, A., Goh, K. J., & Vallier, L. (2018) · Cell stem cell · doi:10.1016/j.stem.2018.03.016 · Cited by 76
“…be involved in liver development and functional maturation (Agarwal et al., 2008; Brolén et al., 2010; Cai et al., 2007; Chen et al., 2012; Hannan et al., 2013b;Mallanna and Duncan, 2013; Si-Tayeb et al., 2010; Siller et al., 2015; Song et al., 2009; Sullivan et al., 2010; Touboul et al., 2010).”
Therapeutic Potential of Differentiated Mesenchymal Stem Cells for Treatment of Osteoarthritis
Ham, O., Lee, C. Y., Kim, R., Lee, J., Oh, S., Lee, M., Kim, J., Hwang, K., Maeng, L.-S., & Chang, W. (2015) · International Journal of Molecular Sciences · doi:10.3390/ijms160714961 · Cited by 78
Direct On-Chip Differentiation of Intestinal Tubules from Induced Pluripotent Stem Cells
Naumovska, E., Aalderink, G., Valencia, C. W., Kosim, K., Nicolas, A., Brown, S., Vulto, P., Erdmann, K. S., & Kurek, D. (2020) · International Journal of Molecular Sciences · doi:10.3390/ijms21144964 · Cited by 72
“GSK-3 inhibition by CHIR99021 alone is sufficient for the generation of SOX17 and FOXA2 positive cells [19,47].”
BackgroundSelf-citationLiver cell therapy: is this the end of the beginning?
Alwahsh, S. M., Rashidi, H., & Hay, D. C. (2017) · Cellular and Molecular Life Sciences · doi:10.1007/s00018-017-2713-8 · Cited by 71
“have devised a growth factor-free protocol that relies on small molecules to efficiently differentiate human PSCs toward a hepatic phenotype [103], however, their approach still relied on fetal bovine serum and Matrigel, limiting GMP-grade.”
BackgroundMoskot, M., Jakóbkiewicz‐Banecka, J., Kłoska, A., Piotrowska, E., Narajczyk, M., & Gabig‐Cimińska, M. (2019) · International Journal of Molecular Sciences · doi:10.3390/ijms20020304 · Cited by 66
“5–5% v/v, or even 10% v/v, it is frequently applied to induce differentiation of various cell lines [34], including fibroblasts [31,32].”
BackgroundLiver diseases in the dish: iPSC and organoids as a new approach to modeling liver diseases
Fiorotto, R., Amenduni, M., Mariotti, V., Fabris, L., Spirlı̀, C., & Strazzabosco, M. (2018) · Biochimica et Biophysica Acta (BBA) - Molecular Basis of Disease · doi:10.1016/j.bbadis.2018.08.038 · Cited by 63
Hepatic differentiation of human iPSCs in different 3D models: A comparative study
Meier, F., Freyer, N., Brzeszczyńska, J., spel, F. K. ⁄., Armstrong, L., Lako, M., Greuel, S., Damm, G., Ludwig-Schwellinger, E., Deschl, U., et al. (2017) · International Journal of Molecular Medicine · doi:10.3892/ijmm.2017.3190 · Cited by 59
“The generated HLCs demonstrate some characteristics of hepatocytes, such as susceptibility to hepatitis C virus infection (13), secretion of hepatic proteins (14,15) and activity of metabolic enzymes (16,17).”
Disease‐specific phenotypes in iPSC‐derived neural stem cells with POLG mutations
Liang, K. X., Kristiansen, C. K., Mostafavi, S., Vatne, G. H., Zantingh, G. A., Kianian, A., Tzoulis, C., Høyland, L. E., Ziegler, M., Pérez, R., et al. (2020) · EMBO Molecular Medicine · doi:10.15252/emmm.202012146 · Cited by 62
“Hepatocyte differentiation from iPSCs was optimized for patient and control lines using a previously established approach (Siller et al, 2015, 2016; Siller & Sullivan, 2017).”
MethodSelf-citationBiomaterials used in stem cell therapy for spinal cord injury
Higuchi, A., Kumar, S. S., Benelli, G., Ling, Q., Li, H.-F., Alarfaj, A. A., Munusamy, M. A., Sung, T., Chang, Y., & Murugan, K. (2019) · Progress in Materials Science · doi:10.1016/j.pmatsci.2019.02.002 · Cited by 59
Generation of heart-forming organoids from human pluripotent stem cells
Drakhlis, L., Biswanath, S., & Zweigerdt, R. (2021) · Nature Protocols · doi:10.1038/s41596-021-00629-8 · Cited by 58
Cox, C. R., Lynch, S., Goldring, C. E., & Sharma, P. (2020) · Frontiers in Medical Technology · doi:10.3389/fmedt.2020.611913 · Cited by 58
“This includes the use of growth factors and small molecules (61, 154, 155), small molecules alone (59, 156), or transcription factors (157).”
BackgroundGraffmann, N., Scherer, B., & Adjaye, J. (2022) · Stem Cell Research · doi:10.1016/j.scr.2022.102763 · Cited by 54
Differentiation of hepatocyte-like cells from human pluripotent stem cells using small molecules
Asumda, F. Z., Hatzistergos, K. E., Dykxhoorn, D. M., Jakubski, S., Edwards, J. S., Thomas, E., & Schiff, E. R. (2018) · Differentiation · doi:10.1016/j.diff.2018.03.002 · Cited by 52
“Accordingly, here we tested the efficacy of a previously published (Siller et al., 2015; Mathapati et al., 2016) small-molecule based differentiation protocol for deriving HLCs with a mature phenotype from hPSCs.”
BackgroundMethodInfluentialBalafkan, N., Mostafavi, S., Schubert, M., Siller, R., Liang, K. X., Sullivan, G. J., & Bindoff, L. A. (2020) · Scientific Reports · doi:10.1038/s41598-020-73656-2 · Cited by 53
Self-citationPluripotent stem cells to hepatocytes, the journey so far
Palakkan, A. A., Nanda, J., & Ross, J. A. (2017) · Biomedical Reports · doi:10.3892/br.2017.867 · Cited by 49
“3 μM CHIR99021(mimic 1 FOXA2, SOX17, (55)”
Myotubes derived from human-induced pluripotent stem cells mirror in vivo insulin resistance
Iovino, S., Burkart, A., Warren, L., Patti, M., & Kahn, C. R. (2016) · Proceedings of the National Academy of Sciences · doi:10.1073/pnas.1525665113 · Cited by 50
Fetal liver development and implications for liver disease pathogenesis
Lotto, J., Stephan, T. L., & Hoodless, P. A. (2023) · Nature Reviews Gastroenterology & Hepatology · doi:10.1038/s41575-023-00775-2 · Cited by 47
Small‐Molecule‐Directed Hepatocyte‐Like Cell Differentiation of Human Pluripotent Stem Cells
Mathapati, S., Siller, R., Impellizzeri, A. A. R., Lycke, M., Vegheim, K., Almaas, R., & Sullivan, G. J. (2016) · Current Protocols in Stem Cell Biology · doi:10.1002/cpsc.13 · Cited by 47
Self-citationGurevich, I., Burton, S., Munn, C. G., Ohshima, M., Goedland, M., Czysz, K., & Rajesh, D. (2020) · Biology Open · doi:10.1242/bio.055087 · Cited by 49
“The protocol evolved from several published (Mallanna and Duncan, 2013; Peters et al., 2016; Siller et al., 2015; Takayama et al., 2012) hepatocyte differentiation protocols (Fig.”
Yan, Y., Bejoy, J., Xia, J., Guan, J., Zhou, Y., & Li, Y. (2016) · Acta Biomaterialia · doi:10.1016/j.actbio.2016.06.027 · Cited by 45
Hepatocyte-like cells derived from induced pluripotent stem cells
Roy‐Chowdhury, N., Wang, X., Guha, C., & Roy‐Chowdhury, J. (2016) · Hepatology International · doi:10.1007/s12072-016-9757-y · Cited by 45
Siller, R., Naumovska, E., Mathapati, S., Lycke, M., Greenhough, S., & Sullivan, G. (2016) · Scientific Reports · doi:10.1038/srep37178 · Cited by 43
Self-citationDevelopment of organoid-based drug metabolism model
Park, E., Kim, H. K., Jee, J., Hahn, S., Jeong, S., & Yoo, J. (2019) · Toxicology and Applied Pharmacology · doi:10.1016/j.taap.2019.114790 · Cited by 44
Szkolnicka, D., & Hay, D. C. (2016) · Stem Cells · doi:10.1002/stem.2368 · Cited by 42
Advancements in stem cell-derived hepatocyte-like cell models for hepatotoxicity testing
Jin, M., Xiao, Y., Liao, W., Chen, Q., Yang, W., Li, Y., Li, S., Gao, Y., Peng, Q., & Zhou, S. (2021) · Stem Cell Research & Therapy · doi:10.1186/s13287-021-02152-9 · Cited by 41
“Researchers have shown that the use of small molecules [42, 43] regulating the extracellular nutrient level [44, 45], inducing overexpression of hepatic transcription factors [46, 47], and manipulating miRNA expression [48, 49] represents powerful methods for the efficient generation of metabolically functional hepato…”
BackgroundGao, X., Li, R., Cahan, P., Zhao, Y., Yourick, J. J., & Sprando, R. L. (2020) · Stem Cell Research & Therapy · doi:10.1186/s13287-020-01914-1 · Cited by 40
Li, Q., Lin, H., Du, Q., Liu, K., Wang, O., Evans, C. S., Christian, H., Zhang, C., & Lei, Y. (2018) · Biofabrication · doi:10.1088/1758-5090/aaa6b5 · Cited by 38
Oxygen drives hepatocyte differentiation and phenotype stability in liver cell lines
van Wenum, M., Adam, A. A. A., van der Mark, V. A., Chang, J., Wildenberg, M. E., Hendriks, E. J., Jongejan, A., Moerland, P. D., van Gulik, T. M., Elferink, R. P. J. O., et al. (2018) · Journal of Cell Communication and Signaling · doi:10.1007/s12079-018-0456-4 · Cited by 41
“…(Huch et al. 2015), and of ways to influence these in vitro through co-culturing (Kidambi et al. 2009; Takebe et al. 2013), culture platforms (vanWenum et al. 2014), small molecules (Huch et al. 2015; Siller et al. 2015) and extracellular matrix constructs (Park et al. 2016; Dunn et al. 1989).”
BackgroundStem-cell derived hepatocyte-like cells for the assessment of drug-induced liver injury
Donato, M. T., & Tolosa, L. (2019) · Differentiation · doi:10.1016/j.diff.2019.02.004 · Cited by 38
Parmentier, C., Couttet, P., Wolf, A., Zaccharias, T., Heyd, B., Bachellier, P., Uteng, M., & Richert, L. (2017) · Archives of Toxicology · doi:10.1007/s00204-017-1930-0 · Cited by 39
“The measure of mRNA signatures of hepatocyte phase I, II and II differentiation stages (Siller et al. 2015) across the five PHH cultures showed a predominance of fully matured hepatocytes , which was, moreover, not affected by the 14 days of 2D-sandwich culture.”
BackgroundMethodSmall molecule-induced cellular conversion
De, D., Halder, D., Shin, I., & Kim, K. K. (2017) · Chemical Society Reviews · doi:10.1039/c7cs00330g · Cited by 36
Tricot, T., Verfaillie, C. M., & Kumar, M. (2022) · Cells · doi:10.3390/cells11030442 · Cited by 36
“To enhance fating of HLCs to the level of PHHs, adapted differentiation protocols have included the addition of small molecules that influence different signaling pathways believed to play a role in PHH development, during the differentiation protocol [65,81,82], the use of medium that has optimized nutrient levels [7…”
BackgroundGeneration of human pluripotent stem cell-derived hepatocyte-like cells for drug toxicity screening
Takayama, K., & Mizuguchi, H. (2016) · Drug Metabolism and Pharmacokinetics · doi:10.1016/j.dmpk.2016.10.408 · Cited by 33
Govarthanan, K., Vidyasekar, P., Gupta, P. K., Lenka, N., & Verma, R. S. (2020) · Cytotherapy · doi:10.1016/j.jcyt.2019.12.007 · Cited by 32
Varghese, D. S., Alawathugoda, T. T., & Ansari, S. A. (2019) · Stem Cells International · doi:10.1155/2019/5968236 · Cited by 32
“Both methods of DE induction from hESCs have been used in the previous studies [9, 12].”
BackgroundMethodElectromembrane Extraction and Mass Spectrometry for Liver Organoid Drug Metabolism Studies
Skottvoll, F. S., Hansen, F. A., Harrison, S. P., Boger, I. C. S., Mrsa, A., Restan, M. S., Stein, M., Lundanes, E., Pedersen‐Bjergaard, S., Aizenshtadt, A., et al. (2021) · Analytical Chemistry · doi:10.1021/acs.analchem.0c05082 · Cited by 33
Self-citationKim, J., Kim, Y., Choi, J., Jung, H., Lee, K.-J., Kang, J., Park, N., Rim, Y. A., Nam, Y., & Ju, J. H. (2018) · Stem Cell Research & Therapy · doi:10.1186/s13287-018-1100-1 · Cited by 32
Cotovio, J. P., & Fernandes, T. G. (2020) · Bioengineering · doi:10.3390/bioengineering7020036 · Cited by 31
“, 2015 RPMI+B27 – DMEM+SR+DMSO – L15 CHIR – Dihexa/DEX [48]”
BackgroundHydrogel-Based Strategies for Liver Tissue Engineering
Zhang, Y., Li, L., Dong, L., Cheng, Y., Huang, X., Xue, B., Jiang, C., Cao, Y., & Yang, J. (2024) · Chem & Bio Engineering · doi:10.1021/cbe.4c00079 · Cited by 33
Li, Z., Wu, J., Wang, L., Han, W., Yu, J., Liu, X., Wang, Y., Zhang, Y., Feng, G., Li, W., et al. (2019) · Cell Death and Disease · doi:10.1038/s41419-019-1967-5 · Cited by 30
Raasch, M., Fritsche, E., Kurtz, A., Bauer, M. W., & Mosig, A. S. (2018) · Advanced Drug Delivery Reviews · doi:10.1016/j.addr.2018.06.008 · Cited by 30
Gheibi, S., Singh, T., da Cunha, J. P. M. C. M., Fex, M., & Mulder, H. (2020) · Cells · doi:10.3390/cells9112465 · Cited by 29
“Expands the PDX1+ PPs and promotes endocrine cell fate [155]”
BackgroundFarzaneh, Z., Najarasl, M., Abbasalizadeh, S., Vosough, M., & Baharvand, H. (2018) · Stem Cells and Development · doi:10.1089/scd.2017.0074 · Cited by 28
“B-27 supplement without insulin or vitamin A have been used to develop a defined and serum-free medium for differentiation of hPSCs to endodermal cells [32,33].”
Advances in generating liver cells from pluripotent stem cells as a tool for modeling liver diseases
Maepa, W., & Ndlovu, H. (2020) · Stem Cells · doi:10.1002/stem.3154 · Cited by 29
Advancements in Disease Modeling and Drug Discovery Using iPSC-Derived Hepatocyte-like Cells
Blaszkiewicz, J., & Duncan, S. A. (2022) · Genes · doi:10.3390/genes13040573 · Cited by 28
Thakur, G., Lee, H., Jeon, R., Lee, S., & Rho, G. (2020) · International Journal of Molecular Sciences · doi:10.3390/ijms21072388 · Cited by 31
“Small molecules are used to attain many different cell lineages such as osteoblasts [35], neurons [36], cardiomyocytes [37], hepatocytes [38], and pancreaticβ-like cells [19].”
BackgroundXie, Y., Yao, J., Jin, W., Ren, L., & Li, X. (2021) · Frontiers in Cell and Developmental Biology · doi:10.3389/fcell.2021.765980 · Cited by 30
Kempf, H., & Zweigerdt, R. (2017) · Advances in biochemical engineering, biotechnology · doi:10.1007/10_2017_30 · Cited by 26
Technological advancements for the development of stem cell-based models for hepatotoxicity testing
Natale, A., Vanmol, K., Arslan, A., Vlierberghe, S. V., Dubruel, P., Erps, J. V., Hugo Thienpont, A., Buzgo, M., Boeckmans, J., Kock, J. D., et al. (2019) · Archives of Toxicology · doi:10.1007/s00204-019-02465-y · Cited by 25
The Use of Human Pluripotent Stem Cells for Modeling Liver Development and Disease
Heslop, J. A., & Duncan, S. A. (2018) · Hepatology · doi:10.1002/hep.30288 · Cited by 23
Deng, S., Zhao, X., Zhu, Y., Tang, N., Wang, R., Zhang, X., Qu, F., Ho, Y., Lee, W., Chen, J., et al. (2022) · Biofabrication · doi:10.1088/1758-5090/aca79b · Cited by 22
Schöbel, A., Rösch, K., & Herker, E. (2018) · Scientific Reports · doi:10.1038/s41598-018-22243-7 · Cited by 23
Török, G., Erdei, Z., Lilienberg, J., Apáti, Á., & Homolya, L. (2020) · PLoS ONE · doi:10.1371/journal.pone.0227751 · Cited by 22
“These include chemically defined xeno-free media [47,48], different coating substances and 3D culturing compositions [35–39], as well as co-culturing with supporting cells [26], bioprinting of HLCs onto structures mimicking in vivo situation [49].”
BackgroundSignalling pathways and transcriptional regulators orchestrating liver development and cancer
Campbell, S. A., Stephan, T. L., Lotto, J., Cullum, R., Drissler, S., & Hoodless, P. A. (2021) · Development · doi:10.1242/dev.199814 · Cited by 22
Li, Y., Yang, X., Plummer, R., Hayashi, Y., Deng, X.-S., Nie, Y., & Taniguchi, H. (2021) · International Journal of Molecular Sciences · doi:10.3390/ijms221910471 · Cited by 24
Parmentier, C., Hendriks, D. F. G., Heyd, B., Bachellier, P., Ingelman‐Sundberg, M., & Richert, L. (2018) · Toxicology Letters · doi:10.1016/j.toxlet.2018.06.1069 · Cited by 22
Tissue-Engineered Bile Ducts for Disease Modeling and Therapy
Wang, Z., Faria, J., Penning, L. C., Masereeuw, R., & Spee, B. (2020) · Tissue Engineering Part C Methods · doi:10.1089/ten.tec.2020.0283 · Cited by 22
“Because the HNF4 subfamily is exclusively involved in hepatocyte differentiation, 88–90 it is not further discussed in this review.”
Vanhove, J., Pistoni, M., Welters, M., Eggermont, K., Vanslembrouck, V., Helsen, N., Boon, R., Najimi, M., Sokal, E. M., Collas, P., et al. (2016) · Stem Cell Reports · doi:10.1016/j.stemcr.2016.06.013 · Cited by 23
Pisal, R. V., Suchánek, J., Siller, R., Soukup, T., Hrebíková, H., Bezrouk, A., Kunke, D., Mičuda, S., Filip, S., Sullivan, G. J., et al. (2018) · Scientific Reports · doi:10.1038/s41598-018-24421-z · Cited by 20
Self-citationDerivation and applications of human hepatocyte-like cells
Li, S., Huang, S., Zhao, Y., Ding, Y.-J., Ma, D., & Ding, Q. (2019) · World Journal of Stem Cells · doi:10.4252/wjsc.v11.i8.535 · Cited by 19
3D Printed Tooling for Injection Molded Microfluidics
Convery, N., Samardzhieva, I., Stormonth-Darling, J., Harrison, S. P., Sullivan, G. J., & Gadegaard, N. (2021) · Macromolecular Materials and Engineering · doi:10.1002/mame.202100464 · Cited by 20
Self-citationDistinct Mitochondrial Remodeling During Mesoderm Differentiation in a Human-Based Stem Cell Model
Mostafavi, S., Balafkan, N., Pettersen, I. K., Nido, G., Siller, R., Tzoulis, C., Sullivan, G., & Bindoff, L. (2021) · Frontiers in Cell and Developmental Biology · doi:10.3389/fcell.2021.744777 · Cited by 13
Self-citationDifferentiation therapy: Unlocking phenotypic plasticity of hepatocellular carcinoma
Zheng, S., Bian, H., Li, J., Shen, Y., Yang, Y., & Hu, W. (2022) · Critical Reviews in Oncology/Hematology · doi:10.1016/j.critrevonc.2022.103854 · Cited by 22
Liver Bioengineering: Promise, Pitfalls, and Hurdles to Overcome
Acun, A., Oganesyan, R. V., & Uygun, B. E. (2019) · Current Transplantation Reports · doi:10.1007/s40472-019-00236-3 · Cited by 23
Huang, H., Bader, T., & Jin, S. (2020) · International Journal of Molecular Sciences · doi:10.3390/ijms21165867 · Cited by 21
“For example, enhancing Wingless and Int-1 (WNT) [13], nodal growth differentiation factor (NODAL) [14], and transforming growth factor β (TGF-β) signaling [13] during the generation of definitive endoderm could increase the yield of this lineage.”
BackgroundSong, D., Takahashi, G., Zheng, Y., Matsuo‐Takasaki, M., Li, J., Takami, M., An, Y., Hemmi, Y., Miharada, N., Fujioka, T., et al. (2022) · Human Molecular Genetics · doi:10.1093/hmg/ddac080 · Cited by 19
“A stepwise differentiation protocol was adopted to differentiate iPSCs into hepatocytes in this study, as modified from a previous study (31).”
In Vitro Generated Hepatocyte-Like Cells: A Novel Tool in Regenerative Medicine and Drug Discovery.
Zakikhan, K., Pournasr, B., Massoud, V., & Marjan, N. A. (2017) · PubMed Central · doi:10.22074/cellj.2016.4362 · Cited by 19
“Therefore, numbers of research group have been trying to increase the efficiency of differentiation of iPSCs to HLCs in 2D and 3D with different differentiation protocols (9, 24, 40, 46, 47).”
BackgroundLiang, S., Liang, S., Yin, N., & Faiola, F. (2019) · Ecotoxicology and Environmental Safety · doi:10.1016/j.ecoenv.2019.02.091 · Cited by 19
Is Transforming Stem Cells to Pancreatic Beta Cells Still the Holy Grail for Type 2 Diabetes?
Kahraman, S., Okawa, E. R., & Kulkarni, R. (2016) · Current Diabetes Reports · doi:10.1007/s11892-016-0764-0 · Cited by 16
Addressing Key Questions in Organoid Models: Who, Where, How, and Why?
Gómez‐Álvarez, M., Agustina‐Hernández, M., Francés‐Herrero, E., Rodríguez‐Eguren, A., Bueno-Fernández, C., & Cervelló, I. (2023) · International Journal of Molecular Sciences · doi:10.3390/ijms242116014 · Cited by 18
“Thus, one study experimented with combining biologics and small-molecule drugs in organoid cultures and obtained positive results [138].”
BackgroundHuman iPSC-derived liver co-culture spheroids to model liver fibrosis
Cools, L., Dastjerd, M. K., Smout, A., Merens, V., Yang, Y., Reynaert, H., Messaoudi, N., Smet, V. D., Kumar, M., Verhulst, S., et al. (2024) · Biofabrication · doi:10.1088/1758-5090/ad5766 · Cited by 19
“Previous studies have already shown that growth factors can be (partly) replaced by small molecules, leading to successful differentiation of hepatocytes (Siller et al 2015, Pan et al 2022, Vanmarcke et al 2023).”
BackgroundGuo, X., Li, W., Ma, M., Lü, X., & Zhang, H. (2017) · Journal of Cellular and Molecular Medicine · doi:10.1111/jcmm.13195 · Cited by 18
Recent advances in lineage differentiation from stem cells: hurdles and opportunities?
Terryn, J., Tricot, T., Gajjar, M. K., & Verfaillie, C. M. (2018) · F1000Research · doi:10.12688/f1000research.12596.1 · Cited by 19
“Similar examples can be found in the literature for other cell types, including hepatic, neuronal, or cardiac progeny 36,83,84 .”
ResultRaju, R., Chau, D., Notelaers, T., Myers, C. L., Verfaillie, C. M., & Hu, W. (2018) · Stem Cells and Development · doi:10.1089/scd.2017.0270 · Cited by 19
Advancing hepatotoxicity assessment: current advances and future directions
Kim, Y., Kim, Y., & Kim, Y. (2025) · Toxicological Research · doi:10.1007/s43188-025-00289-w · Cited by 22
The translational potential of human induced pluripotent stem cells for clinical neurology
Devine, H. E., & Patani, R. (2016) · Cell Biology and Toxicology · doi:10.1007/s10565-016-9372-7 · Cited by 18
“Hepatocyte-like cells have been differentiated from hiPSCs with success by several groups (Siller et al. 2015).”
BackgroundModeling Inborn Errors of Hepatic Metabolism Using Induced Pluripotent Stem Cells
Pournasr, B., & Duncan, S. A. (2017) · Arteriosclerosis Thrombosis and Vascular Biology · doi:10.1161/atvbaha.117.309199 · Cited by 17
Rapid Screening of the Endodermal Differentiation Potential of Human Pluripotent Stem Cells
Siller, R., & Sullivan, G. J. (2017) · Current Protocols in Stem Cell Biology · doi:10.1002/cpsc.36 · Cited by 17
Self-citationAutophagy modulates cell fate decisions during lineage commitment
Sharma, K., Asp, N., Harrison, S. P., Siller, R., Baumgarten, S., Gupta, S., Chollet, M. E., Andersen, E. W., Sullivan, G. J., & Simonsen, A. (2021) · Autophagy · doi:10.1080/15548627.2021.2008691 · Cited by 16
“To efficiently differentiate hiPSCs toward DE, we took advantage of a growth-factor-free protocol that employs the GSK3 (glycogen synthase kinase 3) inhibitor CHIR99021 (WNT agonist) [28,40,41].”
MethodResultInfluentialSelf-citationKalantarMotamedi, Y., Peymani, M., Baharvand, H., Nasr‐Esfahani, M. H., & Bender, A. (2016) · Cell Death Discovery · doi:10.1038/cddiscovery.2016.7 · Cited by 15
Reprogramming cell fate with artificial transcription factors
Heiderscheit, E. A., Eguchi, A., Spurgat, M. C., & Ansari, A. Z. (2018) · FEBS Letters · doi:10.1002/1873-3468.12993 · Cited by 18
Apáti, Á., Varga, N., Berecz, T., Erdei, Z., Homolya, L., & Sarkadi, B. (2018) · Expert Opinion on Drug Metabolism & Toxicology · doi:10.1080/17425255.2019.1558207 · Cited by 17
Metadata
- Authors
- Siller, R., Greenhough, S., Naumovska, E., & Sullivan, G. J.
- Affiliations
- University of Oslo (NO)
- Oslo University Hospital (NO)
- Corresponding author
- Sullivan, Gareth J.
- Venue
- Stem Cell Reports
- Publisher
- Elsevier BV
- Published
- 2015-05
- Volume
- 4
- Issue
- 5
- Pages
- 939-952
- ISSN
- 2213-6711 (ISSN-L)
- PMC
- PMC4437467
- OpenAlex
- W2012281335
- Cited by
- 203
- References
- 48
- Citations by year
- 2026: 8 · 2025: 9 · 2024: 11 · 2023: 13 · 2022: 19 · 2021: 30 · 2020: 25 · 2019: 15 · 2018: 27 · 2017: 19 · 2016: 19 · 2015: 6
- FWCI
- 10.27
- Type
- journal article
- Language
- en
- Open access
- gold
- doi.org
- Licence
- Locations
- Stem Cell Reports (publishedVersion, cc-by-nc-nd)
- Europe PMC (PubMed Central) (publishedVersion, cc-by-nc-nd)
- PubMed Central (publishedVersion, cc-by-nc-nd)
- PubMed (publishedVersion)
- DOAJ (DOAJ: Directory of Open Access Journals) (submittedVersion, cc-by-sa)
- NORA - Norwegian Open Research Archives (submittedVersion, cc-by-nc-nd)
- Topics
- Life Sciences › Biochemistry, Genetics and Molecular Biology › Molecular Biology › Pluripotent Stem Cells Research
- Life Sciences › Biochemistry, Genetics and Molecular Biology › Cell Biology › Mesenchymal stem cell research
- Health Sciences › Medicine › Endocrinology, Diabetes and Metabolism › Pancreatic function and diabetes
- Keywords
- hepatocyte differentiation, human pluripotent stem cells, small molecules, human embryonic stem cells, induced pluripotent stem cells, hepatocyte-like cells, glycogen storage, cytochrome P450 activity, hepatic differentiation
- MeSH terms
- Blood Proteins, Cell Differentiation, Cells, Cultured, Dexamethasone, Dimethyl Sulfoxide, Glycogen, Humans, Microscopy, Fluorescence, Oligopeptides, Proto-Oncogene Proteins c-met, Hepatocytes, Glycogen Synthase Kinase 3, Pluripotent Stem Cells, Small Molecule Libraries
About these checks
Registry, retraction, Cites and statistics results are computed, not judged, with one exception: a printed reference that no index lists is read once by a model before it counts as a citation error. Claims are extracted by a model and kept only when their quote appears verbatim in the text; each cited source is then checked, with a model’s help, for whether it says what the claim relies on. Those verdicts can be wrong — read the claim’s quote and the cited source before relying on one.
Statistics and arithmetic are recomputed, not judged.
Confidence bands are shown only for fields calibrated on our annotated test set. None is calibrated yet, so no band is shown.
What counts as a claim ›How we measure confidence ›How we check this ›
Are you an author, or do you see a problem with this page? Request a review
