

The DOI matches its Crossref record; 1 of the 1 references it cites were found in a registry or an index.
Cells Adapt to Resist Fluoride through Metabolic Deactivation and Intracellular Acidification
Overview
The claims and statistics of this paper haven’t been checked yet.
Run the check — free, no account needed. It reads the open-access text and checks the sources it cites.
Integrity signals
Registry
Cites
Statistics
Figures
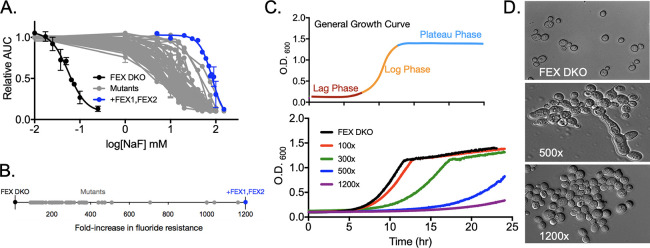
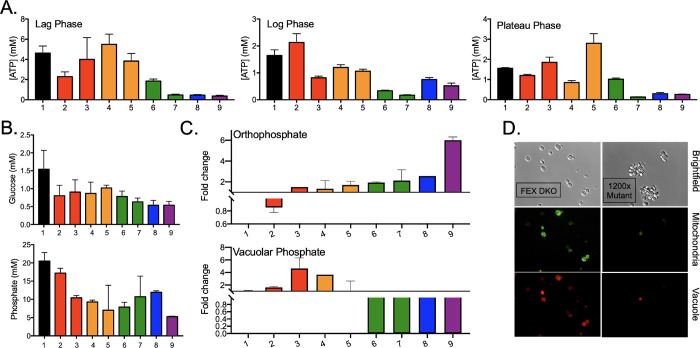
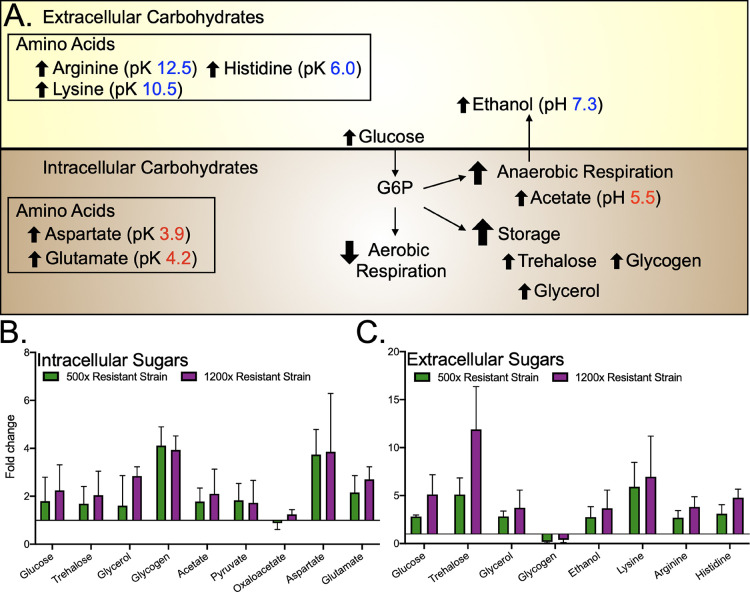
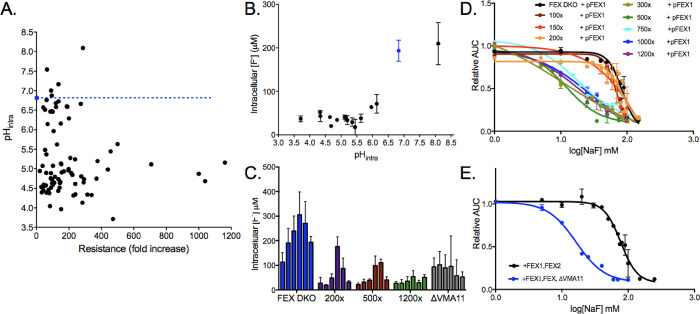
Verification
Claims the paper makes
The claims and statistics of this paper haven’t been checked yet.
Run the check — free, no account needed. It reads the open-access text and checks the sources it cites.
Claims other papers make about this one
Each is checked against this paper’s own text: does it say what the citing paper says it does?
The source backs part of the claim, not all of it — or backs it for a different population, condition or comparison.
In the citing paper
“As a result, maintaining pH homeostasis is important for fluoride resistance in microorganisms, and acid stress-response pathways are commonly upregulated in response to fluoride88,93.”
From The link between ancient microbial fluoride resistance mechanisms and bioengineering organofluorine degradation or synthesis (2024) · cites this paper as [88]
Experimental — accuracy not yet measuredThe check wasn’t confident either way, so it gives no verdict — never disputed.
In the citing paper
“For example, some plants accumulate fluoride as insoluble calcium or magnesium complexes in the vacuole121, and fluoride-acclimated yeast exhibited far lower soluble calcium compared to total calcium, suggesting calcium’s presence in an insoluble form88.”
From The link between ancient microbial fluoride resistance mechanisms and bioengineering organofluorine degradation or synthesis (2024) · cites this paper as [88]
Experimental — accuracy not yet measuredIn the citing paper
“We are not aware of any systematic investigation of fluoride acclimation in bacteria, but the example of S. cerevisiae is encouraging, as fluoride acclimation over multiple generations yielded strains with ~700-fold better fluoride resistance, independent of fluoride exporter expression88.”
From The link between ancient microbial fluoride resistance mechanisms and bioengineering organofluorine degradation or synthesis (2024) · cites this paper as [88]
In the citing paper
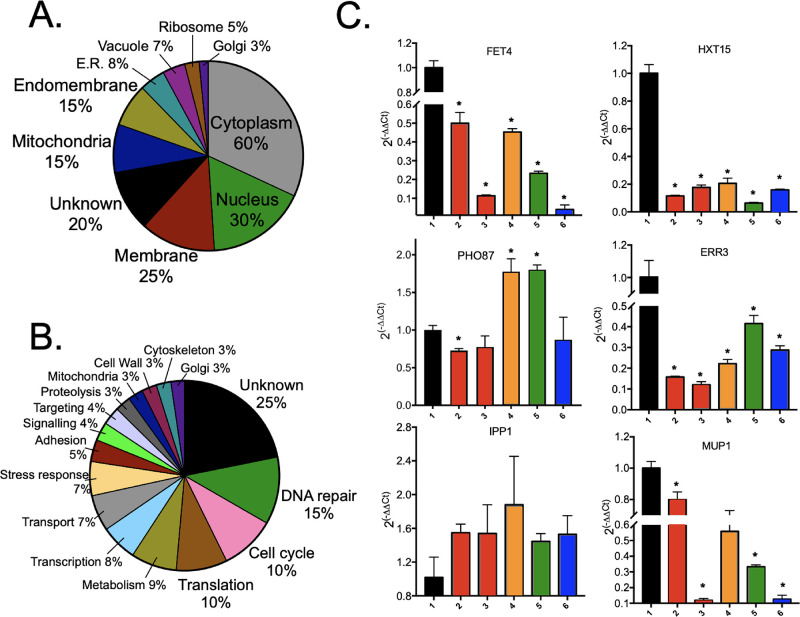
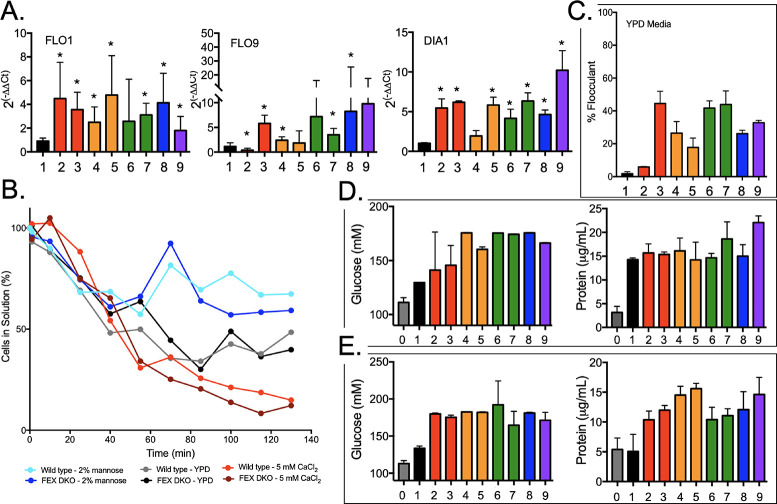
“Fluoride-acclimated S. cerevisiae exhibited increased clumping and mutations to genes associated with flocculation, pseudohyphal growth, cell surface properties, and adhesion88.”
From The link between ancient microbial fluoride resistance mechanisms and bioengineering organofluorine degradation or synthesis (2024) · cites this paper as [88]
In the citing paper
“In one illustration of the potential contribution of these additional fluoride resistance mechanisms, fluoride-acclimated strains of Saccharomyces cerevisiae exhibited a 700-fold gain in fluoride resistance, independent of fluoride export88.”
From The link between ancient microbial fluoride resistance mechanisms and bioengineering organofluorine degradation or synthesis (2024) · cites this paper as [88]
In the citing paper
“In fluoride-acclimated S. cerevisiae, one of the most frequent physiological adjustments was tolerance to lower homeostatic pH88.”
From The link between ancient microbial fluoride resistance mechanisms and bioengineering organofluorine degradation or synthesis (2024) · cites this paper as [88]
In the citing paper
“Fluoride-adapted S. cerevisiae also exhibit metabolic shifts to anaerobic fermentation pathways, and like P. putida, are depleted in TCA cycle intermediates88.”
From The link between ancient microbial fluoride resistance mechanisms and bioengineering organofluorine degradation or synthesis (2024) · cites this paper as [88]
In the citing paper
“But there is also evidence that increased cytoplasmic phosphate is protective against fluoride toxicity88,97, perhaps partly due to phosphate’s buffering capacity at neutral pH.”
From The link between ancient microbial fluoride resistance mechanisms and bioengineering organofluorine degradation or synthesis (2024) · cites this paper as [88]
In the citing paper
“Stress-response pathways, especially oxidative stress responses, are activated in a broad cross-section of bacterial species upon fluoride challenge21,88,95,97,101.”
From The link between ancient microbial fluoride resistance mechanisms and bioengineering organofluorine degradation or synthesis (2024) · cites this paper as [88]
Self-check
Percentages, sums and reported differences re-computed from the paper’s own numbers.
The self-check needs the paper’s full text.
Citations
Cites
Bacterial fluoride resistance, Fluc channels, and the weak acid accumulation effect
Ji, C., Stockbridge, R. B., & Miller, C. (2014) · Journal of General Physiology · doi:10.1085/jgp.201411243 · Cited by 97
Research works printed but not linked: 44
- Garcia M. G., 2015, Fluorine: Chemistry, Analysis, Function, and Effects, 3, 10.1039/9781782628507-00003 · DOI
- 10.1139/m95-133 · DOI
- 10.1359/jbmr.1998.13.11.1660 · DOI
- NRC Fluoride in Drinking Water: A Scientific Review of EPA’s Standards . National Academies Press, 2006, pp. 224–267
- 10.1177/0022034510384626 · DOI
- 10.1007/s12011-018-1458-z · DOI
- 10.1016/j.toxlet.2008.03.002 · DOI
- 10.1016/j.cbi.2010.07.011 · DOI · Paper page
- 10.1016/S1734-1140(12)70885-X · DOI
- 10.1021/acs.chemrestox.9b00315 · DOI · Paper page
- Gumińska M., 1976, Acta Biochim. Pol., 23, 285
- 10.1016/0022-2836(70)90306-2 · DOI
- 10.1016/0005-2760(72)90129-4 · DOI
- 10.1016/S0166-1116(08)71847-8 · DOI
- 10.3748/wjg.v12.i7.1144 · DOI
- 10.1289/ehp.11375 · DOI
- 10.3389/fmicb.2020.01410 · DOI · Paper page
- 10.1126/science.1215063 · DOI · Paper page
- 10.1073/pnas.1310439110 · DOI · Paper page
- 10.1080/00022470.1966.10468494 · DOI
- 10.1016/j.archoralbio.2011.06.011 · DOI
- 10.1371/journal.pone.0122630 · DOI · Paper page
- 10.1128/AAC.01366-16 · DOI
- 10.1007/s10295-016-1827-6 · DOI · Paper page
- 10.1038/s41598-017-06988-1 · DOI · Paper page
- 10.1002/2211-5463.12236 · DOI · Paper page
- 10.1091/mbc.e08-08-0852 · DOI
- 10.1091/mbc.e10-08-0721 · DOI
- 10.1093/femsyr/fow072 · DOI
- 10.1371/journal.pgen.1007744 · DOI
- 10.1074/jbc.M101487200 · DOI
- 10.1016/j.redox.2017.09.007 · DOI
- 10.7554/eLife.09347 · DOI
- 10.1111/j.1365-2672.2010.04897.x · DOI
- 10.1111/j.1567-1364.2008.00462.x · DOI
- 10.1371/journal.pgen.1005684 · DOI
- 10.1371/journal.pgen.1008308 · DOI
- 10.1099/00221287-148-8-2599 · DOI
- 10.1021/jf070866p · DOI
- 10.1371/journal.pone.0070309 · DOI
- 10.1016/S0014-5793(03)01462-5 · DOI
- 10.1083/jcb.200310014 · DOI · Paper page
- 10.1111/j.1567-1364.2009.00482.x · DOI
- 10.1038/s41598-017-09990-9 · DOI
Cited by
Sorted by citations
Stockbridge, R. B., & Wackett, L. P. (2024) · Nature Communications · doi:10.1038/s41467-024-49018-1 · Cited by 80
Metadata
- Authors
- Johnston, N. R., Cline, G., & Strobel, S. A.
- Venue
- Chemical Research in Toxicology
- Publisher
- American Chemical Society (ACS)
- Published
- 2022-10-25
- Volume
- 35
- Issue
- 11
- Pages
- 2085-2096
- ISSN
- 0893-228X
- 1520-5010
- PMC
- PMC9683101
- Cited by
- 9
- References
- 1
- Language
- en
- Funders
- National Institute of Diabetes and Digestive and Kidney Diseases (P30 DK045735, R01 DK116774)
- National Science Foundation (GR108639)
About these checks
Registry, retraction, Cites and statistics results are computed, not judged, with one exception: a printed reference that no index lists is read once by a model before it counts as a citation error. Claims are extracted by a model and kept only when their quote appears verbatim in the text; each cited source is then checked, with a model’s help, for whether it says what the claim relies on. Those verdicts can be wrong — read the claim’s quote and the cited source before relying on one.
Statistics and arithmetic are recomputed, not judged.
Confidence bands are shown only for fields calibrated on our annotated test set. None is calibrated yet, so no band is shown.
What counts as a claim ›How we measure confidence ›How we check this ›
Are you an author, or do you see a problem with this page? Request a review
