

The DOI matches its Crossref record; 62 of the 62 references it cites were found in a registry or an index.
Heterogeneity of genomic evolution and mutational profiles in multiple myeloma
Open accessAbstract
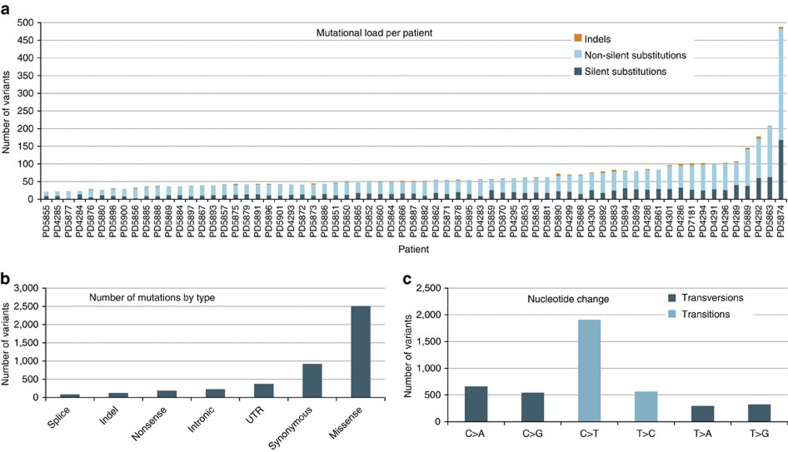
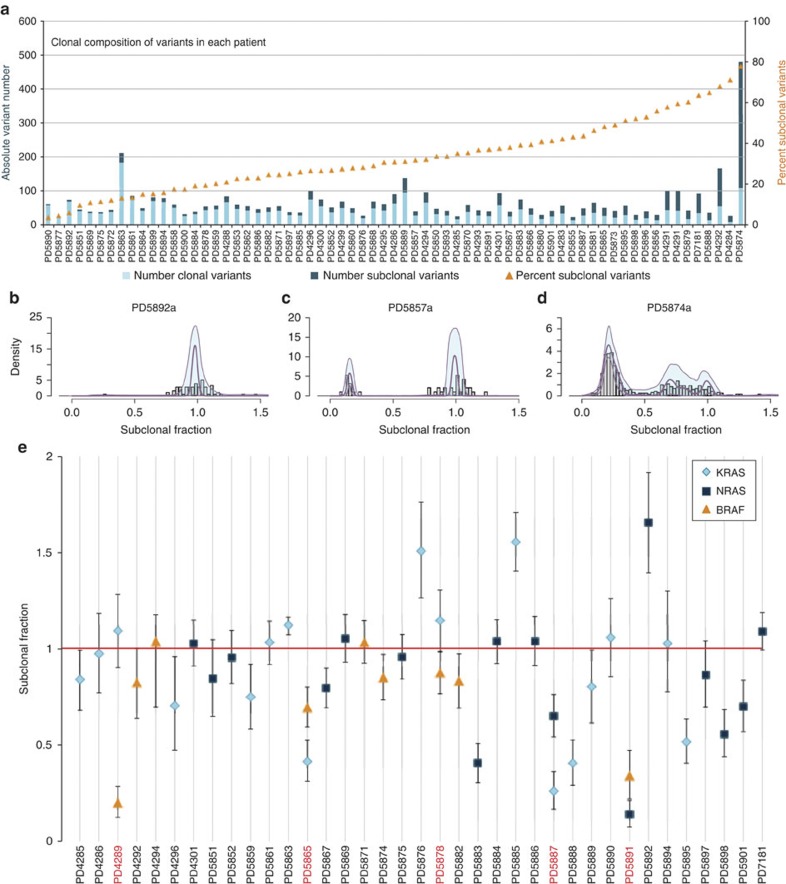
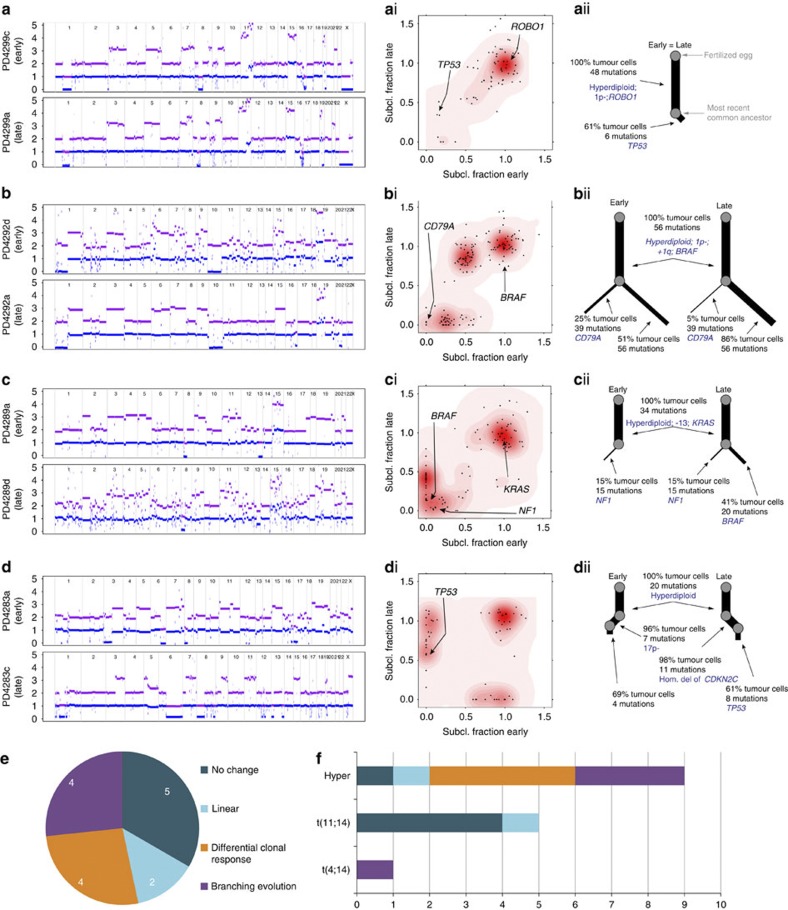
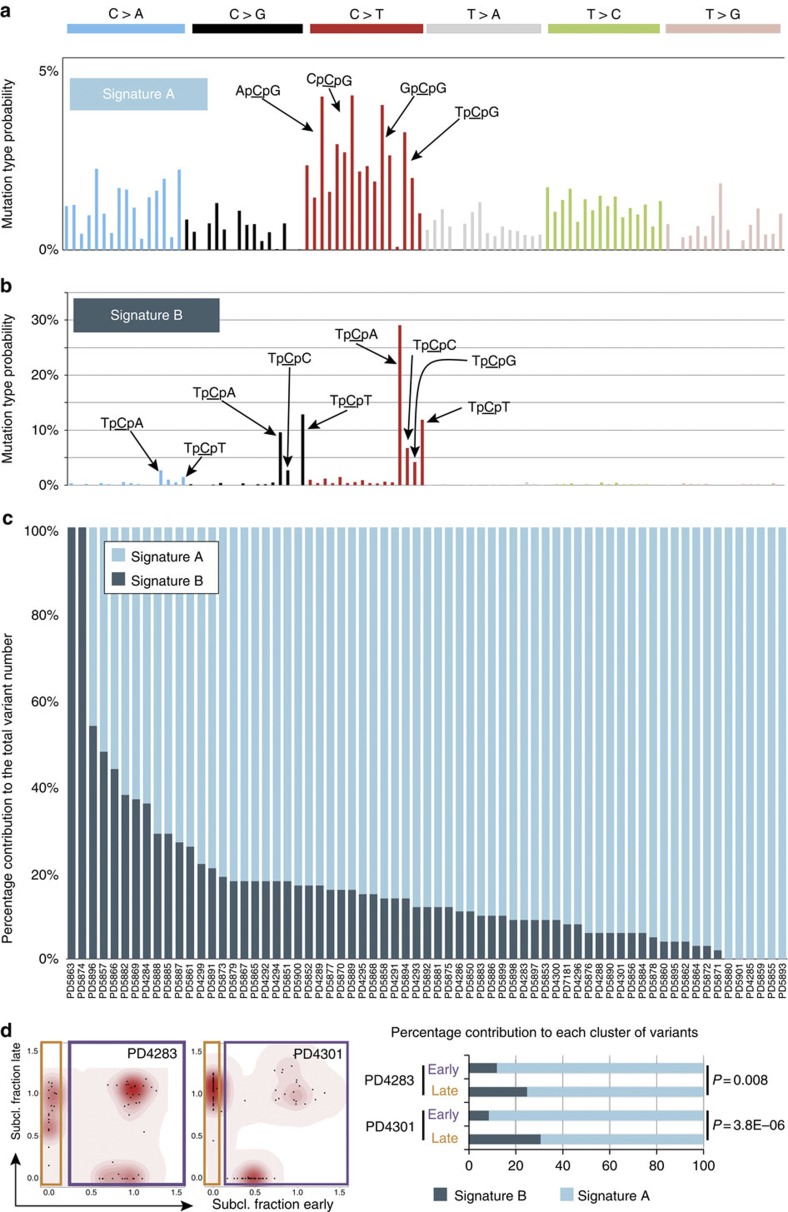
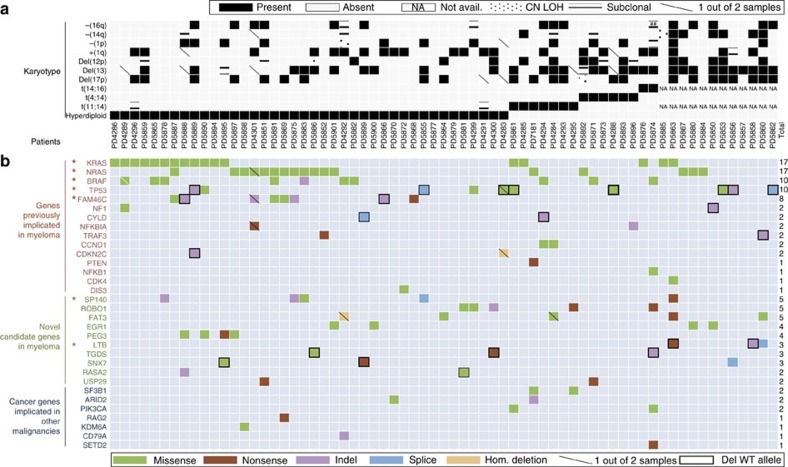
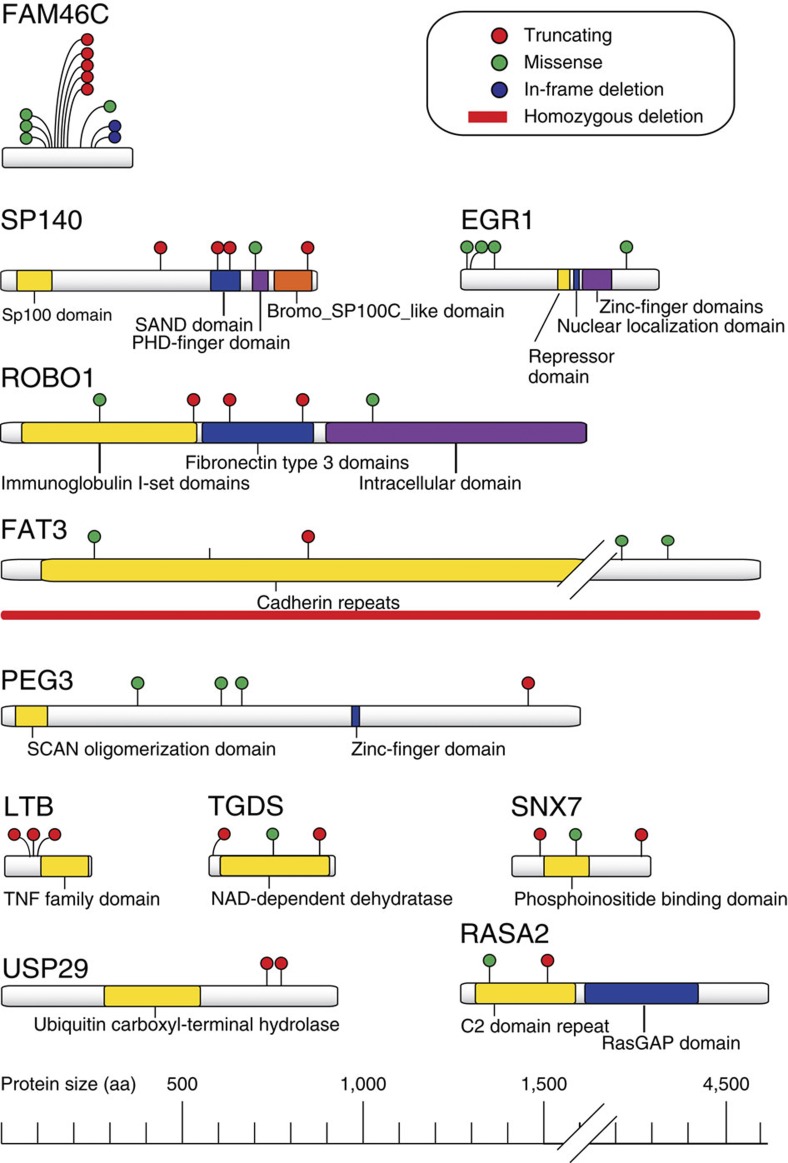
Multiple myeloma is an incurable plasma cell malignancy with a complex and incompletely understood molecular pathogenesis. Here we use whole-exome sequencing, copy-number profiling and cytogenetics to analyse 84 myeloma samples. Most cases have a complex subclonal structure and show clusters of subclonal variants, including subclonal driver mutations. Serial sampling reveals diverse patterns of clonal evolution, including linear evolution, differential clonal response and branching evolution. Diverse processes contribute to the mutational repertoire, including kataegis and somatic hypermutation, and their relative contribution changes over time. We find heterogeneity of mutational spectrum across samples, with few recurrent genes. We identify new candidate genes, including truncations of SP140, LTB, ROBO1 and clustered missense mutations in EGR1. The myeloma genome is heterogeneous across the cohort, and exhibits diversity in clonal admixture and in dynamics of evolution, which may impact prognostic stratification, therapeutic approaches and assessment of disease response to treatment. Multiple myeloma is a malignant plasma cell disorder with a complex molecular pathogenesis. Here, the authors perform whole-exome sequencing, copy-number profiling and cytogenetic analysis in 84 myeloma samples and highlight the diversity and evolution of the mutational profile underlying the disease.
Overview
The claims and statistics of this paper haven’t been checked yet.
Run the check — free, no account needed. It reads the open-access text and checks the sources it cites.
Integrity signals
Registry
Cites
Statistics
Figures
Verification
Claims the paper makes
The claims and statistics of this paper haven’t been checked yet.
Run the check — free, no account needed. It reads the open-access text and checks the sources it cites.
Claims other papers make about this one
Each is checked against this paper’s own text: does it say what the citing paper says it does?
In the citing paper
“this cancer is known to be frequently multiclonal55,56”
From The origins and genetic interactions of KRAS mutations are allele- and tissue-specific (2021) · cites this paper as [56]
Self-check
Percentages, sums and reported differences re-computed from the paper’s own numbers.
The self-check needs the paper’s full text.
Citations
Cites
Fast and accurate short read alignment with Burrows-Wheeler transform
Li, H., & Durbin, R. (2009) · Bioinformatics · doi:10.1093/bioinformatics/btp324 · Cited by 58,607
Fast and accurate long-read alignment with Burrows-Wheeler transform.
Li, H., & Durbin, R. (2010) · Bioinformatics · doi:10.1093/bioinformatics/btp698 · Cited by 12,063
Signatures of mutational processes in human cancer
Initiative, A. P. C. G., Alexandrov, L. B., ICGC Breast Cancer Consortium, ICGC MMML-Seq Consortium, PedBrain, I., Nik-Zainal, S., Wedge, D. C., Aparicio, S. A. J. R., Behjati, S., Biankin, A. V., et al. (2013) · Nature · doi:10.1038/nature12477 · Cited by 9,660
Self-citationVogelstein, B., Papadopoulos, N., Velculescu, V. E., Zhou, S., Diaz, L. A., & Kinzler, K. W. (2013) · Science · doi:10.1126/science.1235122 · Cited by 7,863
Intratumor Heterogeneity and Branched Evolution Revealed by Multiregion Sequencing
Gerlinger, M., Rowan, A. J., Horswell, S., Larkin, J., Endesfelder, D., Gronroos, E., Martinez, P., Matthews, N., Stewart, A., Tarpey, P., et al. (2012) · New England Journal of Medicine · doi:10.1056/nejmoa1113205 · Cited by 7,774
Self-citationMutational heterogeneity in cancer and the search for new cancer-associated genes
Lawrence, M. S., Stojanov, P., Polak, P., Kryukov, G. V., Cibulskis, K., Sivachenko, A., Carter, S. L., Stewart, C., Mermel, C. H., Roberts, S. A., et al. (2013) · Nature · doi:10.1038/nature12213 · Cited by 5,461
Muramatsu, M., Kinoshita, K., Fagarasan, S., Yamada, S., Shinkai, Y., & Honjo, T. (2000) · Cell · doi:10.1016/s0092-8674(00)00078-7 · Cited by 3,475
Greaves, M., & Maley, C. C. (2012) · Nature · doi:10.1038/nature10762 · Cited by 3,162
Systematic identification of genomic markers of drug sensitivity in cancer cells
Garnett, M. J., Edelman, E. J., Heidorn, S. J., Greenman, C. D., Dastur, A., Lau, K. W., Greninger, P., Thompson, I. R., Luo, X., Soares, J., et al. (2012) · Nature · doi:10.1038/nature11005 · Cited by 2,456
Self-citationMassive genomic rearrangement acquired in a single catastrophic event during cancer development
Stephens, P. J., Greenman, C. D., Fu, B., Yang, F., Bignell, G. R., Mudie, L. J., Pleasance, E. D., Lau, K. W., Beare, D., Stebbings, L. A., et al. (2011) · Cell · doi:10.1016/j.cell.2010.11.055 · Cited by 2,414
Self-citation
Cited by
Sorted by citations
Clonal heterogeneity and tumor evolution: past, present, and the future
McGranahan, N., & Swanton, C. (2017) · Cell · doi:10.1016/j.cell.2017.01.018 · Cited by 2,840
Universal Patterns of Selection in Cancer and Somatic Tissues
Martincorena, I., Raine, K. M., Gerstung, M., Dawson, K. J., Haase, K., Van Loo, P., Davies, H., Stratton, M. R., & Campbell, P. J. (2017) · Cell · doi:10.1016/j.cell.2017.09.042 · Cited by 1,523
Self-citationThe evolutionary history of lethal metastatic prostate cancer
ICGC Prostate UK Group, Gundem, G., Loo, P. V., Kremeyer, B., Alexandrov, L. B., Tubío, J. M. C., Papaemmanuil, E., Brewer, D. S., Kallio, H. M. L., Högnäs, G., et al. (2015) · Nature · doi:10.1038/nature14347 · Cited by 1,358
Self-citationKumar, S. K., Rajkumar, S. V., Kyle, R. A., van Duin, M., Sonneveld, P., Mateos, M., Gay, F., & Anderson, K. C. (2017) · Nature Reviews Disease Primers · doi:10.1038/nrdp.2017.46 · Cited by 1,261
Self-citationSpatial and temporal diversity in genomic instability processes defines lung cancer evolution
de Bruin, E. C., McGranahan, N., Mitter, R., Salm, M., Wedge, D. C., Yates, L., Jamal-Hanjani, M., Shafi, S., Murugaesu, N., Rowan, A. J., et al. (2014) · Science · doi:10.1126/science.1253462 · Cited by 1,117
Self-citationMutational signatures associated with tobacco smoking in human cancer
Alexandrov, L. B., Ju, Y. S., Haase, K., Van Loo, P., Martincorena, I., Nik-Zainal, S., Totoki, Y., Fujimoto, A., Nakagawa, H., Shibata, T., et al. (2016) · Science · doi:10.1126/science.aag0299 · Cited by 1,100
Self-citationBiological and therapeutic impact of intratumor heterogeneity in cancer evolution
McGranahan, N., & Swanton, C. (2015) · Cancer Cell · doi:10.1016/j.ccell.2014.12.001 · Cited by 1,077
Clock-like mutational processes in human somatic cells
Alexandrov, L. B., Jones, P. H., Wedge, D. C., Sale, J. E., Campbell, P. J., Nik‐Zainal, S., & Stratton, M. R. (2015) · Nature Genetics · doi:10.1038/ng.3441 · Cited by 1,065
Self-citationIntratumor heterogeneity in localized lung adenocarcinomas delineated by multiregion sequencing
Zhang, J., Fujimoto, J., Zhang, J., Wedge, D. C., Song, X., Zhang, J., Seth, S., Chow, C.-W., Cao, Y., Gumbs, C., et al. (2014) · Science · doi:10.1126/science.1256930 · Cited by 965
Self-citationSubclonal diversification of primary breast cancer revealed by multiregion sequencing
Yates, L. R., Gerstung, M., Knappskog, S., Desmedt, C., Gundem, G., Loo, P. V., Aas, T., Alexandrov, L. B., Larsimont, D., Davies, H., et al. (2015) · Nature Medicine · doi:10.1038/nm.3886 · Cited by 833
Self-citationBrudno, J. N., Marić, I., Hartman, S. D., Rose, J. J., Wang, M., Lam, N., Stetler‐Stevenson, M., Salem, D., Yuan, C. M., Pavletic, S. Z., et al. (2018) · Journal of Clinical Oncology · doi:10.1200/jco.2018.77.8084 · Cited by 792
Clonal status of actionable driver events and the timing of mutational processes in cancer evolution
McGranahan, N., Favero, F., de Bruin, E. C., Birkbak, N. J., Szallasi, Z., & Swanton, C. (2015) · Science Translational Medicine · doi:10.1126/scitranslmed.aaa1408 · Cited by 685
Walker, B. A., Boyle, E. M., Wardell, C. P., Murison, A., Begum, D. B., Dahir, N. M., Proszek, P. Z., Johnson, D. C., Kaiser, M. F., Melchor, L., et al. (2015) · Journal of Clinical Oncology · doi:10.1200/jco.2014.59.1503 · Cited by 567
Genomic complexity of multiple myeloma and its clinical implications
Manier, S., Salem, K. Z., Park, J., Landau, D. A., Getz, G. A., & Ghobrial, I. M. (2016) · Nature Reviews Clinical Oncology · doi:10.1038/nrclinonc.2016.122 · Cited by 579
Translational Implications of Tumor Heterogeneity
Jamal‐Hanjani, M., Quezada, S. A., Larkin, J., & Swanton, C. (2015) · Clinical Cancer Research · doi:10.1158/1078-0432.ccr-14-1429 · Cited by 567
Characterizing genetic intra-tumor heterogeneity across 2,658 human cancer genomes
Dentro, S. C., Leshchiner, I., Haase, K., Tarabichi, M., Wintersinger, J., Deshwar, A. G., Yu, K., Rubanova, Y., Macintyre, G., Demeulemeester, J., et al. (2021) · Cell · doi:10.1016/j.cell.2021.03.009 · Cited by 533
Self-citationDetecting ultralow-frequency mutations by Duplex Sequencing
Kennedy, S. R., Schmitt, M. W., Fox, E. J., Kohrn, B. F., Salk, J. J., Ahn, E. H., Prindle, M. J., Kuong, K. J., Shen, J.-C., Risques, R.-A., et al. (2014) · Nature Protocols · doi:10.1038/nprot.2014.170 · Cited by 503
Timing the Landmark Events in the Evolution of Clear Cell Renal Cell Cancer: TRACERx Renal
Mitchell, T. J., Turajlic, S., Rowan, A., Nicol, D. L., Farmery, J. H. R., O’Brien, T., Martincorena, I., Tarpey, P. S., Angelopoulos, N., Yates, L. R., et al. (2018) · Cell · doi:10.1016/j.cell.2018.02.020 · Cited by 522
Self-citationAPOBEC Enzymes: Mutagenic Fuel for Cancer Evolution and Heterogeneity
Swanton, C., McGranahan, N., Starrett, G. J., & Harris, R. S. (2015) · Cancer Discovery · doi:10.1158/2159-8290.cd-15-0344 · Cited by 492
Identification of novel mutational drivers reveals oncogene dependencies in multiple myeloma
Walker, B. A., Mavrommatis, K., Wardell, C. P., Ashby, T. C., Bauer, M., Davies, F. E., Rosenthal, A., Wang, H., Qu, P., Hoering, A., et al. (2018) · Blood · doi:10.1182/blood-2018-03-840132 · Cited by 475
Self-citationKatoh, M. (2017) · International Journal of Oncology · doi:10.3892/ijo.2017.4129 · Cited by 478
A high-risk, Double-Hit, group of newly diagnosed myeloma identified by genomic analysis
Walker, B. A., Mavrommatis, K., Wardell, C. P., Ashby, C., Bauer, M., Davies, F. E., Rosenthal, A., Wang, H., Qu, P., Hoering, A., et al. (2018) · Leukemia · doi:10.1038/s41375-018-0196-8 · Cited by 457
Self-citationMiller, C. A., White, B. S., Dees, N. D., Griffith, M., Welch, J. S., Griffith, O. L., Vij, R., Tomasson, M. H., Graubert, T. A., Walter, M. J., et al. (2014) · PLoS Computational Biology · doi:10.1371/journal.pcbi.1003665 · Cited by 461
Spatial genomic heterogeneity in multiple myeloma revealed by multi-region sequencing
Rasche, L., Chavan, S. S., Stephens, O. W., Patel, P. H., Tytarenko, R., Ashby, C., Bauer, M., Stein, C., Deshpande, S., Wardell, C., et al. (2017) · Nature Communications · doi:10.1038/s41467-017-00296-y · Cited by 417
Tumour heterogeneity and the evolution of polyclonal drug resistance
Burrell, R. A., & Swanton, C. (2014) · Molecular Oncology · doi:10.1016/j.molonc.2014.06.005 · Cited by 435
Hypermutation in human cancer genomes: footprints and mechanisms
Roberts, S. A., & Gordenin, D. A. (2014) · Nature reviews. Cancer · doi:10.1038/nrc3816 · Cited by 403
Nijhof, I. S., Casneuf, T., van Velzen, J. F., van Kessel, B., Axel, A. E., Syed, K. W., Groen, R. W. J., van Duin, M., Sonneveld, P., Minnema, M. C., et al. (2016) · Blood · doi:10.1182/blood-2016-03-703439 · Cited by 393
Osteoclasts control reactivation of dormant myeloma cells by remodelling the endosteal niche
Lawson, M. A., McDonald, M. M., Kovačić, N., Khoo, W. H., Terry, R. L., Down, J. M., Kaplan, W. H., Paton‐Hough, J., Fellows, C., Pettitt, J. A., et al. (2015) · Nature Communications · doi:10.1038/ncomms9983 · Cited by 389
Tracking the origins and drivers of subclonal metastatic expansion in prostate cancer
Hong, M. K. H., Macintyre, G., Wedge, D. C., Loo, P. V., Patel, K., Lunke, S., Alexandrov, L. B., Sloggett, C., Cmero, M., Marass, F., et al. (2015) · Nature Communications · doi:10.1038/ncomms7605 · Cited by 367
Self-citationIntegrated genomic characterization of IDH1-mutant glioma malignant progression
Bai, H., Harmancı, A. S., Erson-Omay, Z., Li, J., Coşkun, S., Simon, M., Krischek, B., Özduman, K., Omay, S. B., Sorensen, E. A., et al. (2015) · Nature Genetics · doi:10.1038/ng.3457 · Cited by 328
The evolution of tumour phylogenetics: principles and practice
Schwartz, R. S., & Schäffer, A. A. (2017) · Nature Reviews Genetics · doi:10.1038/nrg.2016.170 · Cited by 329
Li, X., Francies, H. E., Secrier, M., Perner, J., Miremadi, A., Galeano-Dalmau, N., Barendt, W. J., Letchford, L., Leyden, G. M., Goffin, E. K., et al. (2018) · Nature Communications · doi:10.1038/s41467-018-05190-9 · Cited by 316
Self-citationKorde, N., Roschewski, M. J., Zingone, A., Kwok, M., Manasanch, E. E., Bhutani, M., Tageja, N., Kazandjian, D. G., Mailankody, S., Wu, P., et al. (2015) · JAMA Oncology · doi:10.1001/jamaoncol.2015.2010 · Cited by 308
Pan-cancer analysis of intratumor heterogeneity as a prognostic determinant of survival
Morris, L. G. T., Riaz, N., Desrichard, A., Şenbabaoğlu, Y., Hakimi, A. A., Makarov, V., Reis-Filho, J. S., & Chan, T. A.-T. (2016) · Oncotarget · doi:10.18632/oncotarget.7067 · Cited by 307
Targeting immune checkpoints potentiates immunoediting and changes the dynamics of tumor evolution
Efremova, M., Rieder, D., Klepsch, V., Charoentong, P., Finotello, F., Hackl, H., Hermann‐Kleiter, N., Löwer, M., Baier, G., Krogsdam, A., et al. (2017) · Nature Communications · doi:10.1038/s41467-017-02424-0 · Cited by 308
Pathogenesis beyond the cancer clone(s) in multiple myeloma
Bianchi, G., & Munshi, N. C. (2015) · Blood · doi:10.1182/blood-2014-11-568881 · Cited by 298
Self-citationGenomic landscape and chronological reconstruction of driver events in multiple myeloma
Maura, F., Bolli, N., Angelopoulos, N., Dawson, K. J., Leongamornlert, D., Martincorena, I., Mitchell, T. J., Fullam, A., Gonzalez, S., Szalat, R., et al. (2019) · Nature Communications · doi:10.1038/s41467-019-11680-1 · Cited by 278
Self-citationMutational signatures of ionizing radiation in second malignancies
Behjati, S., Gundem, G., Wedge, D. C., Roberts, N. D., Tarpey, P. S., Cooke, S. L., Van Loo, P., Alexandrov, L. B., Ramakrishna, M., Davies, H., et al. (2016) · Nature Communications · doi:10.1038/ncomms12605 · Cited by 274
Self-citationCAR T cell therapies for patients with multiple myeloma
Mikkilineni, L., & Kochenderfer, J. N. (2020) · Nature Reviews Clinical Oncology · doi:10.1038/s41571-020-0427-6 · Cited by 277
B Cell Super-Enhancers and Regulatory Clusters Recruit AID Tumorigenic Activity
Qian, J., Wang, Q., Dose, M., Pruett, N. D., Kieffer-Kwon, K.-R., Resch, W., Liang, G., Tang, Z., Mathé, E. A., Benner, C. W., et al. (2014) · Cell · doi:10.1016/j.cell.2014.11.013 · Cited by 279
Single cell dissection of plasma cell heterogeneity in symptomatic and asymptomatic myeloma
Ledergor, G., Weiner, A., Zada, M., Wang, S.-Y., Cohen, Y. C., Gatt, M. E., Snir, N., Magen, H., Koren-Michowitz, M., Herzog-Tzarfati, K., et al. (2018) · Nature Medicine · doi:10.1038/s41591-018-0269-2 · Cited by 263
The kinome 'at large' in cancer
Fleuren, E. D. G., Zhang, L., Wu, J., & Daly, R. J. (2016) · Nature reviews. Cancer · doi:10.1038/nrc.2015.18 · Cited by 268
Kortüm, K. M., Mai, E. K., Hanafiah, N. H., Shi, C.-X., Zhu, Y.-X., Bruins, L., Barrio, S., Jedlowski, P., Merz, M., Xu, J., et al. (2016) · Blood · doi:10.1182/blood-2016-02-698092 · Cited by 255
Tisato, V., Voltan, R., Gonelli, A., Secchiero, P., & Zauli, G. (2017) · Journal of Hematology & Oncology · doi:10.1186/s13045-017-0500-5 · Cited by 259
Clonal expansion in non-cancer tissues
Kakiuchi, N., & Ogawa, S. (2021) · Nature Reviews Cancer · doi:10.1038/s41568-021-00335-3 · Cited by 252
Diagnosis and classification of hematologic malignancies on the basis of genetics
Taylor, J., Xiao, W., & Abdel-Wahab, O. I. (2017) · Blood · doi:10.1182/blood-2017-02-734541 · Cited by 260
Mapping single-cell transcriptomes in the intra-tumoral and associated territories of kidney cancer
Li, R., Ferdinand, J. R., Loudon, K. W., Bowyer, G., Laidlaw, S., Muyas, F., Mamanova, L., Neves, J. B., Bolt, L., Fasouli, E. S., et al. (2022) · Cancer Cell · doi:10.1016/j.ccell.2022.11.001 · Cited by 254
Self-citationEvolutionary biology of high-risk multiple myeloma
Pawlyn, C., & Morgan, G. J. (2017) · Nature reviews. Cancer · doi:10.1038/nrc.2017.63 · Cited by 242
Genomic and evolutionary classification of lung cancer in never smokers
Zhang, T., Joubert, P., Ansari‐Pour, N., Wei, Z., Hoang, P. H., Lokanga, R. A., Moye, A. L., Rosenbaum, J., González-Pérez, A., Martínez-Jiménez, F., et al. (2021) · Nature Genetics · doi:10.1038/s41588-021-00920-0 · Cited by 243
Self-citationMultiple Myeloma: Available Therapies and Causes of Drug Resistance
Pinto, V., Bergantim, R., Caires, H. R., Seca, H., Guimarães, J. E., & Vasconcelos, M. H. (2020) · Cancers · doi:10.3390/cancers12020407 · Cited by 241
Sequencing of prostate cancers identifies new cancer genes, routes of progression and drug targets
CAMCAP Study Group, Wedge, D. C., Gundem, G., Mitchell, T., Woodcock, D. J., Martincorena, I., Ghori, M., Zamora, J., Butler, A. P., Whitaker, H. C., et al. (2018) · Nature Genetics · doi:10.1038/s41588-018-0086-z · Cited by 227
Self-citationA bispecific CAR-T cell therapy targeting BCMA and CD38 in relapsed or refractory multiple myeloma
Mei, H., Li, C., Jiang, H., Zhao, X., Huang, Z., Jin, D., Guo, T., Kou, H., Liu, L., Tang, L., et al. (2021) · Journal of Hematology & Oncology · doi:10.1186/s13045-021-01170-7 · Cited by 222
Genomic patterns of progression in smoldering multiple myeloma
Bolli, N., Maura, F., Minvielle, S., Gloznik, D., Szalat, R., Fullam, A., Martincorena, I., Dawson, K. J., Samur, M. K., Zamora, J., et al. (2018) · Nature Communications · doi:10.1038/s41467-018-05058-y · Cited by 222
Self-citationHiley, C. T., de Bruin, E. C., McGranahan, N., & Swanton, C. (2014) · Genome biology · doi:10.1186/s13059-014-0453-8 · Cited by 233
Chimeric antigen receptor T-cell therapies for multiple myeloma
Mikkilineni, L., & Kochenderfer, J. N. (2017) · Blood · doi:10.1182/blood-2017-06-793869 · Cited by 216
Clonal selection and double-hit events involving tumor suppressor genes underlie relapse in myeloma
Weinhold, N., Ashby, C., Rasche, L., Chavan, S. S., Stein, C., Stephens, O., Tytarenko, R. G., Bauer, M., Meißner, T., Deshpande, S., et al. (2016) · Blood · doi:10.1182/blood-2016-06-723007 · Cited by 219
The origins and genetic interactions of KRAS mutations are allele- and tissue-specific
Cook, J. H., Melloni, G. E. M., Gulhan, D. C., Park, P. J., & Haigis, K. M. (2021) · Nature Communications · doi:10.1038/s41467-021-22125-z · Cited by 208
Genomic and Epigenomic Features of Primary and Recurrent Hepatocellular Carcinomas
Ding, X., He, M., Chan, A. W. H., Song, Q. X., Sze, S. C., Chen, H., Man, K., Man, K., Chan, S. L., Lai, P. B. S., et al. (2019) · Gastroenterology · doi:10.1053/j.gastro.2019.09.005 · Cited by 212
Spatial genomics maps the structure, nature and evolution of cancer clones
Lomakin, A., Svedlund, J., Strell, C., Gatarić, M., Shmatko, A., Rukhovich, G. D., Park, J. S., Ju, Y. S., Dentro, S. C., Kleshchevnikov, V., et al. (2022) · Nature · doi:10.1038/s41586-022-05425-2 · Cited by 212
Self-citationNext-generation sequencing: advances and applications in cancer diagnosis
Serratì, S., Summa, S. D., Pilato, B., Petriella, D., Lacalamita, R., Tommasi, S., & Pinto, R. (2016) · OncoTargets and Therapy · doi:10.2147/ott.s99807 · Cited by 207
Bolli, N., Biancon, G., Moarii, M., Gimondi, S., Li, Y., Philippis, C. D., Maura, F., Sathiaseelan, V., Tai, Y., Mudie, L. J., et al. (2017) · Leukemia · doi:10.1038/s41375-018-0037-9 · Cited by 211
Self-citationToward personalized treatment in multiple myeloma based on molecular characteristics
Pawlyn, C., & Davies, F. E. (2018) · Blood · doi:10.1182/blood-2018-09-825331 · Cited by 205
Aberrant Wnt signaling in multiple myeloma: molecular mechanisms and targeting options
van Andel, H., Kocemba, K. A., Spaargaren, M., & Pals, S. T. (2019) · Leukemia · doi:10.1038/s41375-019-0404-1 · Cited by 188
Clusters of Multiple Mutations: Incidence and Molecular Mechanisms
Chan, K., & Gordenin, D. A. (2015) · Annual Review of Genetics · doi:10.1146/annurev-genet-112414-054714 · Cited by 191
A practical guide for mutational signature analysis in hematological malignancies
Maura, F., Degasperi, A., Nadeu, F., Leongamornlert, D., Davies, H., Moore, L., Royo, R., Ziccheddu, B., Puente, X. S., Avet-Loiseau, H., et al. (2019) · Nature Communications · doi:10.1038/s41467-019-11037-8 · Cited by 184
Self-citationVinci, M., Burford, A., Molinari, V., Kessler, K., Popov, S., Clarke, M., Taylor, K. R., Pemberton, H. N., Lord, C. J., Gutteridge, A., et al. (2018) · Nature Medicine · doi:10.1038/s41591-018-0086-7 · Cited by 192
A mutational signature in gastric cancer suggests therapeutic strategies
Alexandrov, L. B., Nik‐Zainal, S., Siu, H. C., Leung, S. Y., & Stratton, M. R. (2015) · Nature Communications · doi:10.1038/ncomms9683 · Cited by 178
Self-citationMGUS to myeloma: a mysterious gammopathy of underexplored significance
Dhodapkar, M. V. (2016) · Blood · doi:10.1182/blood-2016-09-692954 · Cited by 179
Progress and Paradigms in Multiple Myeloma
Anderson, K. C. (2016) · Clinical Cancer Research · doi:10.1158/1078-0432.ccr-16-0625 · Cited by 173
Self-citationMouhieddine, T. H., Sperling, A. S., Redd, R. A., Park, J., Leventhal, M. J., Gibson, C. J., Manier, S., Nassar, A. H., Capelletti, M., Huynh, D., et al. (2020) · Nature Communications · doi:10.1038/s41467-020-16805-5 · Cited by 176
Self-citationTiming the Initiation of Multiple Myeloma
Rustad, E. H., Yellapantula, V., Leongamornlert, D., Bolli, N., Ledergor, G., Nadeu, F., Angelopoulos, N., Dawson, K. J., Mitchell, T. J., Osborne, R. J., et al. (2020) · Nature Communications · doi:10.1038/s41467-020-15740-9 · Cited by 165
Self-citationHigh-Definition Reconstruction of Clonal Composition in Cancer
Fischer, A., Vázquez-Garćıa, I., Illingworth, C. J. R., & Mustonen, V. (2014) · Cell Reports · doi:10.1016/j.celrep.2014.04.055 · Cited by 166
New Developments in Diagnosis, Prognosis, and Assessment of Response in Multiple Myeloma
Landgren, O., & Rajkumar, S. V. (2016) · Clinical Cancer Research · doi:10.1158/1078-0432.ccr-16-0866 · Cited by 159
Caers, J., Garderet, L., Kortüm, K. M., O'Dwyer, M. E., van de Donk, N. W. C. J., Binder, M., Dold, S. M., Gay, F., Corre, J., Beguin, Y. P., et al. (2018) · Haematologica · doi:10.3324/haematol.2018.189159 · Cited by 153
Genetic interrogation of circulating multiple myeloma cells at single-cell resolution
Lohr, J. G., Kim, S., Gould, J., Knoechel, B., Drier, Y., Cotton, M. J., Gray, D. H. D., Birrer, N., Wong, B., Ha, G., et al. (2016) · Science Translational Medicine · doi:10.1126/scitranslmed.aac7037 · Cited by 150
Inferring the Mutational History of a Tumor Using Multi-state Perfect Phylogeny Mixtures
El-Kebir, M., Satas, G., Oesper, L., & Raphael, B. J. (2016) · Cell Systems · doi:10.1016/j.cels.2016.07.004 · Cited by 150
Tirier, S. M., Mallm, J., Steiger, S., Poos, A. M., Awwad, M. H. S., Giesen, N., Casiraghi, N. A., Sušak, H., Bauer, K., Baumann, A., et al. (2021) · Nature Communications · doi:10.1038/s41467-021-26951-z · Cited by 148
Miller, A., Asmann, Y., Cattaneo, L., Braggio, E., Keats, J., Auclair, D., Lonial, S., The MMRF CoMMpass Network, Russell, S. J., & Stewart, A. K. (2017) · Blood Cancer Journal · doi:10.1038/bcj.2017.94 · Cited by 145
Genetics of multiple myeloma: another heterogeneity level?
Corre, J., Munshi, N. C., & Avet‐Loiseau, H. (2015) · Blood · doi:10.1182/blood-2014-10-567370 · Cited by 145
Self-citationCurrent and New Therapeutic Strategies for Relapsed and Refractory Multiple Myeloma: An Update
Nijhof, I. S., van de Donk, N. W. C. J., Zweegman, S., & Lokhorst, H. M. (2017) · Drugs · doi:10.1007/s40265-017-0841-y · Cited by 146
Therapy for Relapsed Multiple Myeloma
Dingli, D., Ailawadhi, S., Bergsagel, P. L., Buadi, F. K., Dispenzieri, A. A., Fonseca, R., Gertz, M. A., Gonsalves, W. I., Hayman, S. R., Kapoor, P., et al. (2017) · Mayo Clinic Proceedings · doi:10.1016/j.mayocp.2017.01.003 · Cited by 144
Circulating tumour DNA sequence analysis as an alternative to multiple myeloma bone marrow aspirates
Kis, O., Kaedbey, R., Chow, S., Danesh, A., Dowar, M., Li, T., Li, Z., Liu, J., Mansour, M., Masih‐Khan, E., et al. (2017) · Nature Communications · doi:10.1038/ncomms15086 · Cited by 137
Dutta, A. K., Fink, J. L., Grady, J. P., Morgan, G. J., Mullighan, C. G., To, L. B., Hewett, D. R., & Zannettino, A. C. W. (2018) · Leukemia · doi:10.1038/s41375-018-0206-x · Cited by 140
Multiple myeloma: the (r)evolution of current therapy and a glance into future
Gullà, A., & Anderson, K. C. (2020) · Haematologica · doi:10.3324/haematol.2020.247015 · Cited by 143
Self-citationPrinciples of Reconstructing the Subclonal Architecture of CancersPreprint
Dentro, S. C., Wedge, D. C., & Loo, P. V. (2017) · Cold Spring Harbor Perspectives in Medicine · doi:10.1101/cshperspect.a026625 · Cited by 141
Self-citationUnderstanding biology to tackle the disease: Multiple myeloma from bench to bedside, and back
Bianchi, G., & Anderson, K. C. (2014) · CA A Cancer Journal for Clinicians · doi:10.3322/caac.21252 · Cited by 135
Self-citationMechanisms and Consequences of Cancer Genome Instability: Lessons from Genome Sequencing Studies
Lee, J. J.-K., Choi, Y., Kwon, M., & Park, P. J. (2016) · Annual Review of Pathology Mechanisms of Disease · doi:10.1146/annurev-pathol-012615-044446 · Cited by 135
Co-evolution of tumor and immune cells during progression of multiple myeloma
Liu, R., Gao, Q., Foltz, S. M., Fowles, J. S., Yao, L., Wang, J. T., Cao, S., Sun, H., Wendl, M. C., Sethuraman, S., et al. (2021) · Nature Communications · doi:10.1038/s41467-021-22804-x · Cited by 137
Recurrent ETNK1 mutations in atypical chronic myeloid leukemia
Gambacorti-Passerini, C. B., Donadoni, C., Parmiani, A., Pirola, A., Redaelli, S., Signore, G., Piazza, V., Malcovati, L., Fontana, D., Spinelli, R., et al. (2014) · Blood · doi:10.1182/blood-2014-06-579466 · Cited by 129
Self-citationAlu-dependent RNA editing of GLI1 promotes malignant regeneration in multiple myeloma
Lazzari, E., Mondala, P. K., Santos, N. P. D., Miller, A. C., Pineda, G., Jiang, Q., Leu, H. S., Ali, S. A., Ganesan, A.-P., Wu, C., et al. (2017) · Nature Communications · doi:10.1038/s41467-017-01890-w · Cited by 129
Single-cell profiling of tumour evolution in multiple myeloma — opportunities for precision medicine
Dutta, A. K., Alberge, J.-B., Sklavenitis‐Pistofidis, R., Lightbody, E. D., Getz, G. A., & Ghobrial, I. M. (2022) · Nature Reviews Clinical Oncology · doi:10.1038/s41571-021-00593-y · Cited by 130
Recent advances in mRNA cancer vaccines: meeting challenges and embracing opportunities
Wang, B., Pei, J., Xu, S., Liu, J., & Yu, J. (2023) · Frontiers in Immunology · doi:10.3389/fimmu.2023.1246682 · Cited by 131
Spectrum and functional validation of PSMB5 mutations in multiple myeloma
Barrio, S., Stühmer, T., Vià, M. D., Barrio-Garcia, C., Lehners, N., Bešše, A., Cuenca, I., Garitano-Trojaola, A., Fink, S., Leich, E., et al. (2018) · Leukemia · doi:10.1038/s41375-018-0216-8 · Cited by 124
The impact of NF-κB signaling on pathogenesis and current treatment strategies in multiple myeloma
Vrábel, D., Pour, L., & Ševčíková, S. (2019) · Blood Reviews · doi:10.1016/j.blre.2018.11.003 · Cited by 123
Understanding the role of hyperdiploidy in myeloma prognosis: which trisomies really matter?
Chrétien, M., Corre, J., Lauwers‐Cancès, V., Magrangeas, F., Cleynen, A., Yon, E., Hulin, C., Leleu, X. P., Orsini‐Piocelle, F., Blade, J., et al. (2015) · Blood · doi:10.1182/blood-2015-06-650242 · Cited by 121
Self-citationMultiple myeloma clonal evolution in homogeneously treated patients
Corre, J., Cleynen, A., Robiou-du-Pont, S., Buisson, L., Bolli, N., Attal, M., Munshi, N. C., & Avet‐Loiseau, H. (2018) · Leukemia · doi:10.1038/s41375-018-0153-6 · Cited by 128
Self-citationThe Mutational Landscape of Circulating Tumor Cells in Multiple Myeloma
Mishima, Y., Paiva, B., Shi, J., Park, J., Manier, S., Takagi, S., Massoud, M. R., Perilla-Glen, A., Aljawai, Y. M., Huynh, D., et al. (2017) · Cell Reports · doi:10.1016/j.celrep.2017.03.025 · Cited by 119
Self-citationThe impact of intra-clonal heterogeneity on the treatment of multiple myeloma
Brioli, A., Melchor, L., Cavo, M., & Morgan, G. J. (2014) · British Journal of Haematology · doi:10.1111/bjh.12805 · Cited by 116
Synthetic Lethal Approaches Exploiting DNA Damage in Aggressive Myeloma
Cottini, F., Hideshima, T., Suzuki, R., Tai, Y., Bianchini, G., Richardson, P. G. G., Anderson, K. C., & Tonon, G. (2015) · Cancer Discovery · doi:10.1158/2159-8290.cd-14-0943 · Cited by 114
Self-citationThe KDM3A–KLF2–IRF4 axis maintains myeloma cell survival
Ohguchi, H., Hideshima, T., Bhasin, M., Görgün, G., Santo, L., Cea, M., Samur, M., Mimura, N., Suzuki, R., Tai, Y.-T., et al. (2016) · Nature Communications · doi:10.1038/ncomms10258 · Cited by 116
Self-citation
Metadata
- Authors
- Bolli, N., Avet-Loiseau, H., Wedge, D. C., Van Loo, P., Alexandrov, L. B., Martincorena, I., Dawson, K. J., Iorio, F., Nik-Zainal, S., Bignell, G. R., Hinton, J. W., Li, Y., Tubio, J. M. C., McLaren, S., O' Meara, S., Butler, A. P., Teague, J. W., Mudie, L., Anderson, E., Rashid, N., Tai, Y.-T., Shammas, M. A., Sperling, A. S., Fulciniti, M., Richardson, P. G., Parmigiani, G., Magrangeas, F., Minvielle, S., Moreau, P., Attal, M., Facon, T., Futreal, P. A., Anderson, K. C., Campbell, P. J., & Munshi, N. C.
- Affiliations
- Wellcome Sanger Institute (GB)
- European Bioinformatics Institute (GB)
- Dana-Farber Cancer Institute (US)
- Harvard University (US)
- Centre National de la Recherche Scientifique (FR)
- Centre Hospitalier Universitaire de Nantes (FR)
- Inserm (FR)
- Centre Hospitalier Universitaire de Lille (FR)
- University of Cambridge (GB)
- Corresponding author
- Campbell, Peter J.
- Munshi, Nikhil C.
- ORCID
- Wedge, David C.
- Alexandrov, Ludmil B.
- Iorio, Francesco
- Hinton, Jonathan W.
- Li, Yilong
- McLaren, Stuart
- Teague, Jon W.
- Anderson, Elizabeth
- Rashid, Naim
- Tai, Yu-Tzu
- Shammas, Masood A.
- Sperling, Adam S.
- Fulciniti, Mariateresa
- Richardson, Paul G.
- Parmigiani, Giovanni
- Magrangeas, Florence
- Moreau, Philippe
- Attal, Michel
- Facon, Thierry
- Futreal, P Andrew
- Anderson, Kenneth C.
- Campbell, Peter J.
- Munshi, Nikhil C.
- Venue
- Nature Communications
- Published
- 2014-01-16
- Volume
- 5
- Issue
- 1
- Pages
- 2997-2997
- ISSN
- 2041-1723 (ISSN-L)
- PMC
- PMC3905727
- OpenAlex
- W2104195581
- Cited by
- 875
- References
- 62
- Citations by year
- 2026: 26 · 2025: 37 · 2024: 56 · 2023: 50 · 2022: 91 · 2021: 87 · 2020: 92 · 2019: 75 · 2018: 90 · 2017: 90 · 2016: 71 · 2015: 65 · 2014: 43
- FWCI
- 63.57
- Type
- journal article
- Language
- en
- Open access
- hybrid
- doi.org
- Licence
- Locations
- Nature Communications (publishedVersion, cc-by-nc-nd)
- Europe PMC (PubMed Central) (publishedVersion, cc-by-nc-nd)
- PubMed Central (publishedVersion, cc-by-nc-nd)
- PubMed (publishedVersion)
- Digital Access to Scholarship at Harvard (DASH) (Harvard University) (submittedVersion, cc-by)
- HAL (submittedVersion)
- RePEc: Research Papers in Economics (submittedVersion)
- Archivio Istituzionale della Ricerca (Universita Degli Studi Di Milano) (submittedVersion, other-oa)
- Research Explorer (The University of Manchester) (submittedVersion)
- Apollo (University of Cambridge) (submittedVersion, cc-by-nc-nd)
- Apollo
- Funders
- U.S. Department of Veterans Affairs (I01 BX001584)
- Wellcome Trust (077012/Z/05/Z, 077012, 088340, 100007)
- Lady Tata Memorial Trust
- Agence Nationale de la Recherche (ANR-11-PHUC-0001)
- Vlaamse regering
- National Institutes of Health (P50-100007, PO1-155258, 5p01ca078378-15, RO1-124929, PO1-78378)
- U.S. Public Health Service (P0-1 155258, RCA125711C, P50-100007, P0178378, R01-124929)
- National Cancer Institute (R01CA125711, P01-CA078378, P50CA100707, T32CA106209, P01CA155258)
- Topics
- Health Sciences › Medicine › Hematology › Multiple Myeloma Research and Treatments
- Life Sciences › Biochemistry, Genetics and Molecular Biology › Cancer Research › Cancer Genomics and Diagnostics
- Health Sciences › Medicine › Hematology › Acute Myeloid Leukemia Research
- Keywords
- multiple myeloma, clonal evolution, subclonal heterogeneity, mutation spectrum, kataegis, somatic hypermutation, copy number alterations, plasma cell malignancy, lateral-torsional buckling, ROBO1, EGR1
- MeSH terms
- Roundabout Proteins, Adult, Aged, Humans, Membrane Proteins, Middle Aged, Multiple Myeloma, Mutation, Nerve Tissue Proteins, Proto-Oncogene Proteins, Receptors, Immunologic, Transcription Factors, Cohort Studies, Tumor Suppressor Protein p53, Proto-Oncogene Proteins p21(ras), Sequence Analysis, DNA, ras Proteins, Genetic Heterogeneity, Evolution, Molecular, Mutation, Missense, GTP Phosphohydrolases, Antigens, Nuclear, Proto-Oncogene Proteins B-raf, Early Growth Response Protein 1, Lymphotoxin-beta, DNA Copy Number Variations, Exome
About these checks
Registry, retraction, Cites and statistics results are computed, not judged, with one exception: a printed reference that no index lists is read once by a model before it counts as a citation error. Claims are extracted by a model and kept only when their quote appears verbatim in the text; each cited source is then checked, with a model’s help, for whether it says what the claim relies on. Those verdicts can be wrong — read the claim’s quote and the cited source before relying on one.
Statistics and arithmetic are recomputed, not judged.
Confidence bands are shown only for fields calibrated on our annotated test set. None is calibrated yet, so no band is shown.
What counts as a claim ›How we measure confidence ›How we check this ›
Are you an author, or do you see a problem with this page? Request a review
