

The DOI matches its Crossref record; 82 of the 82 references it cites were found in a registry or an index.
Hippocampal disruptions of synaptic and astrocyte metabolism are primary events of early amyloid pathology in the 5xFAD mouse model of Alzheimer’s disease
Open accessAbstract
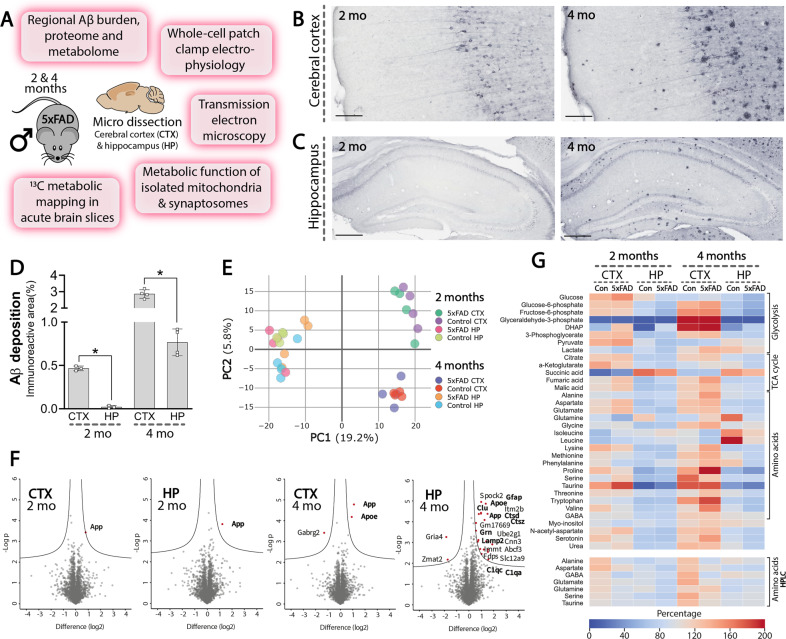
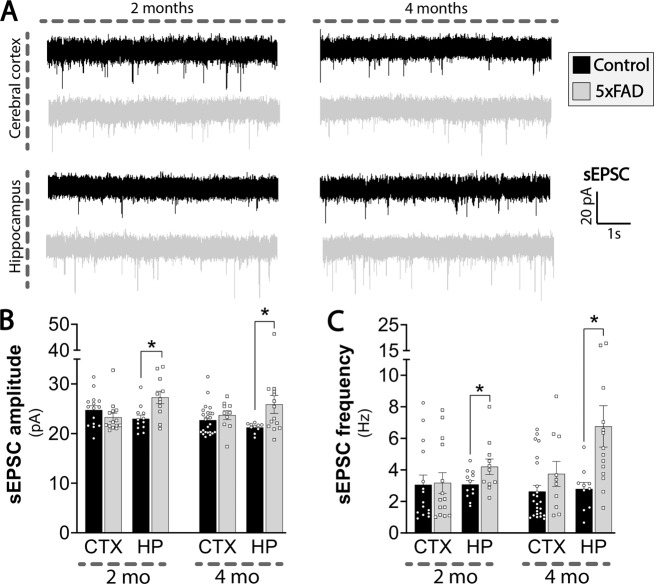
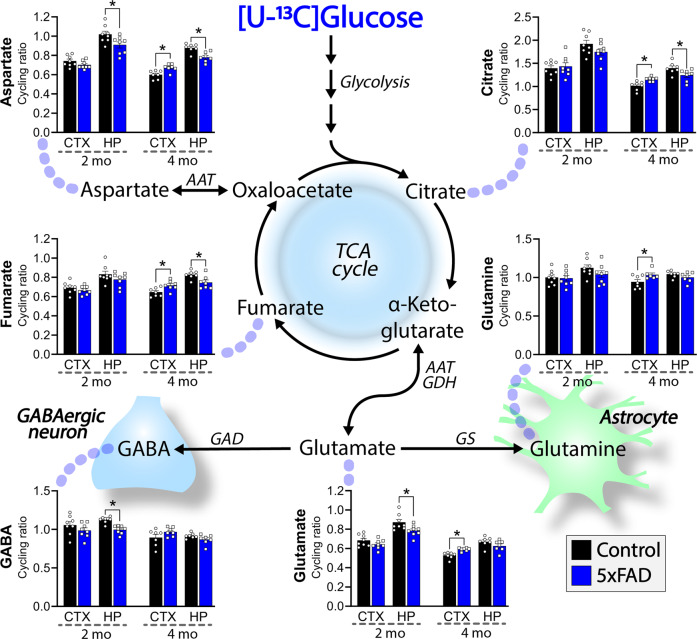
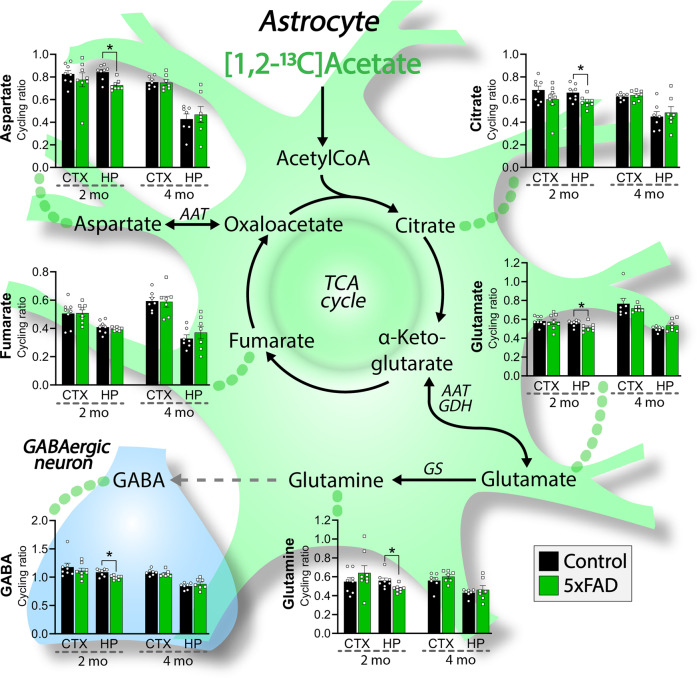
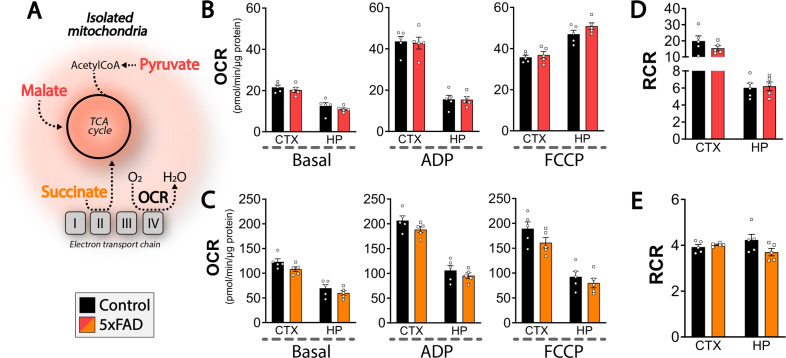
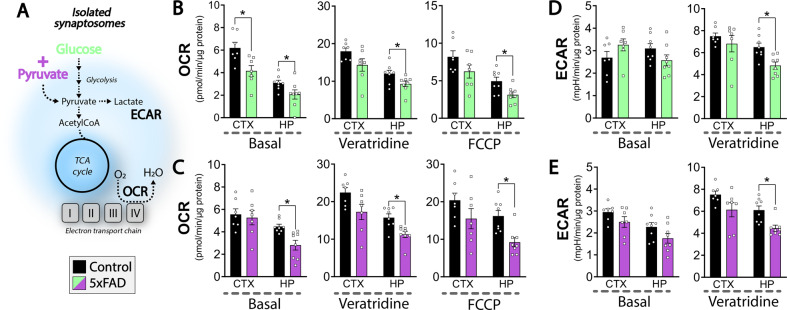
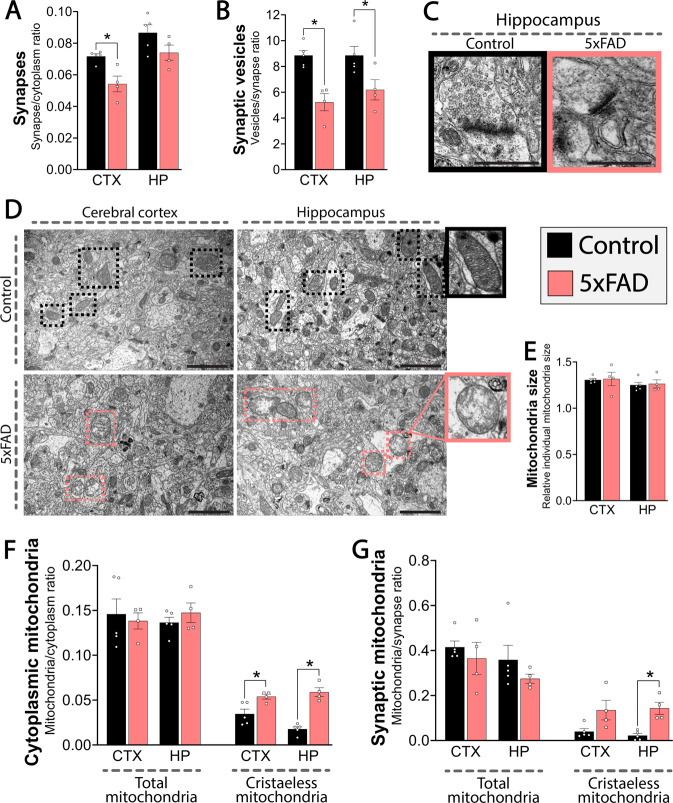
Alzheimer’s disease (AD) is an unremitting neurodegenerative disorder characterized by cerebral amyloid-β (Aβ) accumulation and gradual decline in cognitive function. Changes in brain energy metabolism arise in the preclinical phase of AD, suggesting an important metabolic component of early AD pathology. Neurons and astrocytes function in close metabolic collaboration, which is essential for the recycling of neurotransmitters in the synapse. However, this crucial metabolic interplay during the early stages of AD development has not been sufficiently investigated. Here, we provide an integrative analysis of cellular metabolism during the early stages of Aβ accumulation in the cerebral cortex and hippocampus of the 5xFAD mouse model of AD. Our electrophysiological examination revealed an increase in spontaneous excitatory signaling in the 5xFAD hippocampus. This hyperactive neuronal phenotype coincided with decreased hippocampal tricarboxylic acid (TCA) cycle metabolism mapped by stable 13 C isotope tracing. Particularly, reduced astrocyte TCA cycle activity and decreased glutamine synthesis led to hampered neuronal GABA synthesis in the 5xFAD hippocampus. In contrast, the cerebral cortex of 5xFAD mice displayed an elevated capacity for oxidative glucose metabolism, which may suggest a metabolic compensation in this brain region. We found limited changes when we explored the brain proteome and metabolome of the 5xFAD mice, supporting that the functional metabolic disturbances between neurons and astrocytes are early primary events in AD pathology. In addition, synaptic mitochondrial and glycolytic function was selectively impaired in the 5xFAD hippocampus, whereas non-synaptic mitochondrial function was maintained. These findings were supported by ultrastructural analyses demonstrating disruptions in mitochondrial morphology, particularly in the 5xFAD hippocampus. Collectively, our study reveals complex regional and cell-specific metabolic adaptations in the early stages of amyloid pathology, which may be fundamental for the progressing synaptic dysfunctions in AD.
Overview
The claims and statistics of this paper haven’t been checked yet.
Run the check — free, no account needed. It reads the open-access text and checks the sources it cites.
Integrity signals
Registry
Cites
Statistics
Figures
Verification
Claims the paper makes
The claims and statistics of this paper haven’t been checked yet.
Run the check — free, no account needed. It reads the open-access text and checks the sources it cites.
Claims other papers make about this one
Each is checked against this paper’s own text: does it say what the citing paper says it does?
The source backs part of the claim, not all of it — or backs it for a different population, condition or comparison.
In the citing paper
“Mutations in both APP and PSEN1 cause aberrant APP cleavage and clearance4,47 that lead to neuroinflammation, the activation of astrocytes and microglia, and changes in bioenergetics44,48.”
From Magnetic resonance microscopy maps widespread effects of Alzheimer’s disease on brain structures and behavior in mice (2026) · cites this paper as [44]
Experimental — accuracy not yet measuredThe check wasn’t confident either way, so it gives no verdict — never disputed.
In the citing paper
“Our positive findings contrast sharply with negative findings of the MODEL-AD consortium16 and other recent studies that have also used T1/T2 MRI and DTI methods7,44 (Supplementary Tables 2 and 3).”
From Magnetic resonance microscopy maps widespread effects of Alzheimer’s disease on brain structures and behavior in mice (2026) · cites this paper as [44]
Experimental — accuracy not yet measured
Self-check
Percentages, sums and reported differences re-computed from the paper’s own numbers.
The self-check needs the paper’s full text.
Citations
Cites
Controlling the False Discovery Rate: A Practical and Powerful Approach to Multiple Testing
Benjamini, Y., & Hochberg, Y. (1995) · Journal of the Royal Statistical Society Series B: Statistical Methodology · doi:10.1111/j.2517-6161.1995.tb02031.x · Cited by 109,482
Cox, J., & Mann, M. (2008) · Nature Biotechnology · doi:10.1038/nbt.1511 · Cited by 14,855
Self-citationA default mode of brain function
Raichle, M. E., MacLeod, A. M., Snyder, A. Z., Powers, W. J., Gusnard, D. A., & Shulman, G. L. (2001) · Proceedings of the National Academy of Sciences · doi:10.1073/pnas.98.2.676 · Cited by 12,190
The Perseus computational platform for comprehensive analysis of (prote)omics data
Tyanova, S., Temu, T., Sinitcyn, P., Carlson, A., Hein, M. Y., Geiger, T., Mann, M., & Cox, J. (2016) · Nature Methods · doi:10.1038/nmeth.3901 · Cited by 8,803
Self-citationSperling, R. A., Aisen, P. S., Beckett, L. A., Bennett, D. A., Craft, S., Fagan, A. M., Iwatsubo, T., Jack, C. R., Kaye, J., Montine, T. J., et al. (2011) · Alzheimer's & Dementia · doi:10.1016/j.jalz.2011.03.003 · Cited by 7,155
Cox, J., Hein, M. Y., Luber, C. A., Paron, I., Nagaraj, N., & Mann, M. (2014) · Molecular & Cellular Proteomics · doi:10.1074/mcp.m113.031591 · Cited by 5,180
Self-citationQuerfurth, H. W., & LaFerla, F. M. (2010) · New England Journal of Medicine · doi:10.1056/nejmra0909142 · Cited by 4,569
Danbolt, N. C. (2001) · Progress in Neurobiology · doi:10.1016/s0301-0082(00)00067-8 · Cited by 4,227
Interplay between Cortical Spreading Depolarization and Seizures
Kramer, D. R., Fujii, T., Ohiorhenuan, I. E., & Liu, C. Y. (2017) · Stereotactic and Functional Neurosurgery · doi:10.1159/000452841 · Cited by 3,721
An Energy Budget for Signaling in the Grey Matter of the Brain
Attwell, D., & Laughlin, S. B. (2001) · Journal of Cerebral Blood Flow & Metabolism · doi:10.1097/00004647-200110000-00001 · Cited by 3,543
Cited by
Sorted by citations
Andersen, J. V., Schousboe, A., & Verkhratsky, A. (2022) · Progress in Neurobiology · doi:10.1016/j.pneurobio.2022.102331 · Cited by 263
Self-citationBrain energy metabolism: Astrocytes in neurodegenerative diseases.
Chen, Z., Yuan, Z., Yang, S., Zhu, Y., Xue, M., Zhang, J., & Leng, L. (2023) · CNS Neuroscience & Therapeutics · doi:10.1111/cns.13982 · Cited by 153
Andersen, J. V., & Schousboe, A. (2023) · Journal of Neurochemistry · doi:10.1111/jnc.15811 · Cited by 161
Self-citationThe Glutamate/ GABA ‐Glutamine Cycle: Insights, Updates, and Advances
Andersen, J. V. (2025) · Journal of Neurochemistry · doi:10.1111/jnc.70029 · Cited by 170
Self-citationInflammatory aspects of Alzheimer’s disease
Lucena, P. B., & Heneka, M. T. (2024) · Acta Neuropathologica · doi:10.1007/s00401-024-02790-2 · Cited by 152
Axonal energy metabolism, and the effects in aging and neurodegenerative diseases
Yang, S., Park, J. H., & Lu, H.-C. (2023) · Molecular Neurodegeneration · doi:10.1186/s13024-023-00634-3 · Cited by 94
Glucose metabolism, neural cell senescence and Alzheimer's disease
Wang, Q., Duan, L., Li, X., Wang, Y., Guo, W., Guan, F., & Ma, S. (2022) · International Journal of Molecular Sciences · doi:10.3390/ijms23084351 · Cited by 90
Glial Glutamine Homeostasis in Health and Disease
Andersen, J. V., & Schousboe, A. (2022) · Neurochemical Research · doi:10.1007/s11064-022-03771-1 · Cited by 92
Self-citationNaia, L., Shimozawa, M., Bereczki, E., Li, X., Liu, J., Jiang, R., Giraud, R., Leal, N. S., Pinho, C. M., Berger, E., et al. (2023) · Molecular Psychiatry · doi:10.1038/s41380-023-02289-4 · Cited by 79
Akyuz, E., Arulsamy, A., Aslan, F. S., Sarisözen, B., Guney, B., Hekimoglu, A., Yilmaz, B. N., Retinasamy, T., & Shaikh, M. F. (2025) · Molecular Neurobiology · doi:10.1007/s12035-024-04333-y · Cited by 69
Lei, W., Cheng, Y., Liu, X., Gao, J., Zhu, Z., Ding, W., Xu, X., Li, Y., Ling, Z., Jiang, R., et al. (2025) · Frontiers in Immunology · doi:10.3389/fimmu.2025.1582119 · Cited by 68
Astrocytes regulate inhibitory neurotransmission through GABA uptake, metabolism, and recycling
Andersen, J. V., Schousboe, A., & Wellendorph, P. (2023) · Essays in Biochemistry · doi:10.1042/ebc20220208 · Cited by 58
Self-citationAstrocytic modulation of neuronal signalling
Purushotham, S. S., & Buskila, Y. (2023) · Frontiers in Network Physiology · doi:10.3389/fnetp.2023.1205544 · Cited by 56
Wang, W., Zhao, F., Lu, Y., Siedlak, S. L., Fujioka, H., Feng, H., Perry, G. L., & Zhu, X. (2023) · Acta Neuropathologica Communications · doi:10.1186/s40478-023-01552-7 · Cited by 52
Golgi fragmentation – One of the earliest organelle phenotypes in Alzheimer’s disease neurons
Haukedal, H., Corsi, G. I., Gadekar, V. P., Doncheva, N. T., Kedia, S., de Haan, N., Chandrasekaran, A., Jensen, P., Schiønning, P., Vallin, S., et al. (2023) · Frontiers in Neuroscience · doi:10.3389/fnins.2023.1120086 · Cited by 37
Self-citationAstrocytes: The Stars in Neurodegeneration?
Dittlau, K. S., & Freude, K. (2024) · Biomolecules · doi:10.3390/biom14030289 · Cited by 39
Self-citationNeural Metabolic Networks: Key Elements of Healthy Brain Function
Madrer, N., Perera, N. D., Uccelli, N. A., Abbondanza, A., Andersen, J. V., Carsana, E. V., Demmings, M. D., Fernandez, R. F., de Fragas, M. G., Gbadamosi, I., et al. (2025) · Journal of Neurochemistry · doi:10.1111/jnc.70084 · Cited by 37
Self-citationThe neural basis of neuropsychiatric symptoms in Alzheimer’s disease
Zhang, N. K., Zhang, S. K., Zhang, L. I., Tao, H. W., & Zhang, G. (2024) · Frontiers in Aging Neuroscience · doi:10.3389/fnagi.2024.1487875 · Cited by 39
Quintanilla‐Sánchez, C., Schmitt, F. W., Curdt, N., Westhoff, A. C., Bänfer, I. W. H., Bayer, T. A., & Bouter, Y. (2023) · Biomedicines · doi:10.3390/biomedicines11020599 · Cited by 33
Zhukov, O., He, C., Soylu-Kucharz, R., Cai, C., Lauritzen, A. D., Aldana, B. I., Björkqvist, M., Lauritzen, M., & Kucharz, K. (2023) · Frontiers in Aging Neuroscience · doi:10.3389/fnagi.2023.1089005 · Cited by 30
Self-citationComerota, M. M., Gedam, M., Xiong, W., Jin, F., Deng, L., Wang, M. C., Wang, J., & Zheng, H. (2023) · Molecular Neurodegeneration · doi:10.1186/s13024-023-00648-x · Cited by 31
Zhu, Z., Lu, J., Wang, S., Peng, W., Yang, Y., Chen, C., Zhou, X. J., Yang, X., Xin, W., Chen, X., et al. (2022) · Aging Cell · doi:10.1111/acel.13587 · Cited by 28
Zhou, H., Li, H., Gowravaram, N., Quan, M., Kausar, N., & Gomperts, S. N. (2022) · Scientific Reports · doi:10.1038/s41598-022-25364-2 · Cited by 29
Potential Retinal Biomarkers in Alzheimer’s Disease
García-Bermúdez, M. Y., Vohra, R., Freude, K., van Wijngaarden, P., Martin, K. R. G., Thomsen, M. S., Aldana, B. I., & Kolko, M. (2023) · International Journal of Molecular Sciences · doi:10.3390/ijms242115834 · Cited by 30
Self-citationKetone body metabolism and cardiometabolic implications for cognitive health
Fulghum, K., Salathe, S. F., Davis, X. C., Thyfault, J. P., Puchalska, P., & Crawford, P. A. (2024) · npj Metabolic Health and Disease · doi:10.1038/s44324-024-00029-y · Cited by 30
St‐Pierre, M., Carrier, M., Ibáñez, F. G., Khakpour, M., Wallman, M., Parent, M., & Tremblay, M. (2023) · Journal of Neuroinflammation · doi:10.1186/s12974-023-02752-7 · Cited by 28
Latest assessment methods for mitochondrial homeostasis in cognitive diseases
You, W., Li, Y., Liu, K., Mi, X., Li, Y., Guo, X., & Li, Z. (2023) · Neural Regeneration Research · doi:10.4103/1673-5374.382222 · Cited by 28
Westi, E. W., Jakobsen, E., Voss, C. M., Bak, L. K., Pinborg, L. H., Aldana, B. I., & Andersen, J. V. (2022) · Molecular Neurobiology · doi:10.1007/s12035-022-03053-5 · Cited by 27
Self-citationProgress of Astrocyte-Neuron Crosstalk in Central Nervous System Diseases
Zhang, Y., Wang, Z., Xu, F., Liu, Z., Zhao, Y., Yang, L. Z., & Fang, W. (2024) · Neurochemical Research · doi:10.1007/s11064-024-04241-6 · Cited by 28
AI-driven framework to map the brain metabolome in three dimensions
Ma, X., Shedlock, C. J., Medina, T., Ribas, R. A., Clarke, H. A., Hawkinson, T. R., Dande, P. K., Golamari, H. K. R., Wu, L., Ziani, B., et al. (2025) · Nature Metabolism · doi:10.1038/s42255-025-01242-9 · Cited by 28
Self-citationWesti, E. W., Andersen, J. V., & Aldana, B. I. (2023) · Neurobiology of Disease · doi:10.1016/j.nbd.2023.106145 · Cited by 23
Self-citationGlutamate dehydrogenase: Potential therapeutic targets for neurodegenerative disease
Pan, C., Mao, S., Xiong, Z., Chen, Z., & Xu, N. (2023) · European Journal of Pharmacology · doi:10.1016/j.ejphar.2023.175733 · Cited by 23
Han, Y., Zeng, X., Hua, L., Quan, X., Chen, Y., Zhou, M., Chuang, Y. C., Li, Y., Wang, S., Shen, X., et al. (2024) · Microbiome · doi:10.1186/s40168-023-01717-5 · Cited by 23
Yusoff, A. A. M., & Khair, S. Z. N. M. (2024) · Reviews in the Neurosciences · doi:10.1515/revneuro-2024-0080 · Cited by 23
Current Advances in Mitochondrial Targeted Interventions in Alzheimer’s Disease
de Sousa, T. S., Moreira, P. I., & Cardoso, S. (2023) · Biomedicines · doi:10.3390/biomedicines11092331 · Cited by 22
Baringer, S. L., Lukacher, A. S., Palsa, K., Kim, H., Lippmann, E. S., Spiegelman, V. S., Simpson, I. A., & Connor, J. R. (2023) · Journal of Neurochemistry · doi:10.1111/jnc.15954 · Cited by 21
Westi, E. W., Molhemi, S., Hansen, C. T., Skoven, C. S., Knopper, R. W., Ahmad, D., Rindshøj, M. B., Ameen, A. O., Hansen, B., Kohlmeier, K. A., et al. (2024) · Biomolecules · doi:10.3390/biom14101294 · Cited by 21
Self-citationKong, Y., Maschio, C., Shi, X., Yao, B., Xie, F., Zuo, C., Konietzko, U., Shi, K., Rominger, A., Xiao, J., et al. (2024) · Molecular Neurobiology · doi:10.1007/s12035-024-04106-7 · Cited by 17
Noncanonical regulation of imprinted gene Igf2 by amyloid-beta 1–42 in Alzheimer’s disease
Fertan, E., Gendron, W. A. C., Wong, A. A., Hanson, G. M., Brown, R. E., & Weaver, I. C. G. (2023) · Scientific Reports · doi:10.1038/s41598-023-29248-x · Cited by 15
Kotah, J. M., Kater, M. S. J., Brosens, N., Lesuis, S. L., Tandari, R., Blok, T. M., Marchetto, L., Yusaf, E., Koopmans, F., Smit, A. B., et al. (2023) · Alzheimer s & Dementia · doi:10.1002/alz.13569 · Cited by 15
Wang, J., Zhou, C., Huang, Z., Ji, X., Cui, R., Kang, Y., Zhang, G., Wang, Y., & Zhang, T. (2024) · Molecular Neurobiology · doi:10.1007/s12035-024-04354-7 · Cited by 13
Iannucci, J., Dominy, R., Bandopadhyay, S., Arthur, E. M., Noarbe, B. P., Jullienne, A., Krkasharyan, M., Tobin, R. P., Pereverzev, A., Beevers, S., et al. (2024) · Journal of Neuroinflammation · doi:10.1186/s12974-024-03146-z · Cited by 13
Potassium homeostasis during disease progression of Alzheimer's disease
Samokhina, E., Mangat, A., Malladi, C. S., Gyengési, E., Morley, J. W., & Buskila, Y. (2025) · The Journal of Physiology · doi:10.1113/jp287903 · Cited by 12
Osborne, O., Kowalczyk, J., Louis, K. D. P., Daftari, M., Colbert, B., Naranjo, O., Torices, S., Andras, I. E., Dykxhoorn, D. M., & Toborek, M. J. (2022) · Extracellular Vesicles and Circulating Nucleic Acids · doi:10.20517/evcna.2022.22 · Cited by 11
McNair, L. F., Andersen, J. V., & Waagepetersen, H. S. (2023) · Neurochemistry International · doi:10.1016/j.neuint.2023.105626 · Cited by 11
Self-citationHIF-1α Pathway Orchestration by LCN2: A Key Player in Hypoxia-Mediated Colitis Exacerbation
Yang, Y.-H., Yan, F., Shi, P.-S., Yang, L.-C., & Cui, D. (2024) · Inflammation · doi:10.1007/s10753-024-01990-y · Cited by 11
Walker, V. (2025) · International Journal of Molecular Sciences · doi:10.3390/ijms26157328 · Cited by 11
Abghari, M., Vu, J. T. C. M., Eckberg, N., Aldana, B. I., & Kohlmeier, K. A. (2023) · Biomolecules · doi:10.3390/biom13101461 · Cited by 12
Self-citationAmeen, A. O., Nielsen, S. W., Kjær, M. W., Andersen, J. V., Westi, E. W., Freude, K., & Aldana, B. I. (2024) · Journal of Cerebral Blood Flow & Metabolism · doi:10.1177/0271678x241270457 · Cited by 13
Self-citationLopes, C. R., Silva, J. S., Santos, J., Rodrigues, M. S., Madeira, D., Oliveira, A., Moreira-de-Sá, A., Lourenço, V. S., Gonçalves, F. Q., Silva, H. B. L., et al. (2023) · International Journal of Molecular Sciences · doi:10.3390/ijms24086968 · Cited by 10
Rahimpour, S., Clary, B. L., Nasoohi, S., Berhanu, Y. S., & Brown, C. M. (2024) · Aging and Disease · doi:10.14336/ad.2024.1293 · Cited by 13
Correlations of blood and brain NMR metabolomics with Alzheimer’s disease mouse models
Knörnschild, F., Zhang, E. J., Biswas, R. G., Kobus, M., Chen, J., Zhou, J., Rao, A., Sun, J., Wang, X., Li, W., et al. (2025) · Translational Psychiatry · doi:10.1038/s41398-025-03293-8 · Cited by 8
Söder, L., Baeza‐Lehnert, F., Khodaie, B., Elgez, A., Noack, L., Lewen, A., Hallermann, S., Poschet, G., Borges, K., & Kann, O. (2025) · Journal of Neurochemistry · doi:10.1111/jnc.70251 · Cited by 8
CNS Mitochondria‐Derived Vesicle in Blood: Potential Biomarkers for Brain Mitochondria Dysfunction
Liu, Q., Chen, W., Wu, Y., Guo, Z., Chen, J., Tian, C., Wang, P., Zeng, S., Xu, B., Duan, J., et al. (2025) · Annals of Clinical and Translational Neurology · doi:10.1002/acn3.70060 · Cited by 7
Kang, Y., Liu, J., Wang, Y., Wang, J., Wang, J., Zhou, C., Cui, R., & Zhang, T. (2025) · Cell Proliferation · doi:10.1111/cpr.70061 · Cited by 7
Disrupted astrocyte-neuron signaling reshapes brain activity in epilepsy and Alzheimer’s disease
Wu, M., Zhang, R., Fu, P., & Mei, Y. (2025) · Neuroscience · doi:10.1016/j.neuroscience.2025.02.029 · Cited by 6
Andersen, J. V., Westi, E. W., Griem‐Krey, N., Skotte, N. H., Schousboe, A., Aldana, B. I., & Wellendorph, P. (2023) · Journal of Neurochemistry · doi:10.1111/jnc.15814 · Cited by 6
Self-citationFrisinger, F. S., Jana, B., Ortiz-Marquez, J. C. F., van Opijnen, T., Donadio, S., & Guardabassi, L. (2023) · FEMS Microbes · doi:10.1093/femsmc/xtad013 · Cited by 6
Roy, D., Puvvada, M., Kapanaiah, S. K. T., & Patel, A. B. (2022) · Neurochemical Research · doi:10.1007/s11064-022-03568-2 · Cited by 6
Spatial and cellular composition of lung fibrosis induced by multi-walled carbon nanotubes
Han, B., Li, X., Li, J., Liu, Y., Li, S., Tian, J., Lv, Z., Liu, D., Li, M., Ji, S., et al. (2026) · Journal of Nanobiotechnology · doi:10.1186/s12951-026-04135-5 · Cited by 5
Kim, S. S., Jeon, J. K., Ganbat, D., Kim, T.-W., Shin, K., Hong, S., & Hong, J. (2023) · International Journal of Molecular Sciences · doi:10.3390/ijms241814064 · Cited by 6
Lee, H., Bostick, Z., Doherty, J., Swanson, T. L., Kelly, M. J., Quinn, J. F., Gray, N. E., & Copenhaver, P. F. (2025) · Frontiers in Molecular Neuroscience · doi:10.3389/fnmol.2025.1670646 · Cited by 8
Emerging roles of astrocytes in hippocampal circuitry and behavior
Squires, A., & Park, J. (2025) · Frontiers in Cellular Neuroscience · doi:10.3389/fncel.2025.1694643 · Cited by 5
Shen, L., Tang, X., Zhang, H., Zhuang, H., Jing, L., Zhao, Y., & Liu, X. (2023) · Molecular Neurobiology · doi:10.1007/s12035-023-03533-2 · Cited by 4
de Farias, A. R. M., Pelletier, A., Iohan, L. D. C. C., Saha, O., Bonnefond, A., Amouyel, P., Delahaye, F., Lambert, J., & Costa, M. R. (2023) · Biomedicines · doi:10.3390/biomedicines11092564 · Cited by 4
Kong, Y., Xie, F., Wang, X., Zuo, C., Huang, Q., Shi, K., Rominger, A., Xiao, J., Li, M., Wu, P., et al. (2023) · Research Square · doi:10.21203/rs.3.rs-3415769/v1 · Cited by 4
Fueling Alzheimer’s Disease: Where Does Immunometabolism Stand?
Correia, S. C., Perry, G. L., & Moreira, P. I. (2024) · Journal of Alzheimer s Disease · doi:10.3233/jad-240787 · Cited by 3
Liu, H., Zheng, N., Zhang, Z., Wu, S., Yu, S., Wang, Y., Dong, Z., Zong, S., Wang, X., & Lu, Z. (2025) · International Immunopharmacology · doi:10.1016/j.intimp.2025.115498 · Cited by 3
McKenna, M. C., Sonnewald, U., Waageptersen, H. S., & White, H. S. (2024) · Journal of Neurochemistry · doi:10.1111/jnc.16207 · Cited by 2
5xFAD mutations induce hearing impairment in the Ahl-corrected 5xFAD mice
Su, H., Wu, F., Haque, K. D., Zou, S., Zhang, S., Sambamurti, K., & Sha, S. (2025) · Experimental Neurology · doi:10.1016/j.expneurol.2025.115463 · Cited by 2
Central cytometabolic functional vascular coupling in health and disease
Sims, S. L., Lu, T., Weiss, B. E., Lin, R., Galopin, L. B., Wright, N. A., Norris, C. M., & Thibault, O. (2025) · npj Metabolic Health and Disease · doi:10.1038/s44324-025-00090-1 · Cited by 2
Castroflorio, E., Cabot, J., Miralles, M., Suau, M., Péter, M., Balogh, G. E., Török, Z., Rodríguez, E., Sánchez‐Juan, P., Fernández‐García, P., et al. (2026) · Molecular Neurobiology · doi:10.1007/s12035-026-05849-1 · Cited by 3
Fueling Brain Inhibition: Integrating GABAergic Neurotransmission and Energy Metabolism
Walls, A. B., Andersen, J. V., Waagepetersen, H. S., & Bak, L. K. (2025) · Neurochemical Research · doi:10.1007/s11064-025-04384-0 · Cited by 3
Self-citationKeramidis, I., Samiotaki, M. K., Sansonetti, R., Alonso, J., Desrosiers, P., Papanikolopoulou, K., & Koninck, Y. D. (2025) · iScience · doi:10.1016/j.isci.2025.113454 · Cited by 2
Gu, X., Yu, S. P., Jiang, M. Q., Zhong, W., Sastry, A., & Wei, L. (2025) · Neuroscience Bulletin · doi:10.1007/s12264-025-01525-x · Cited by 2
Tian, Y., Hornburg, K., Austin, W., Cook, J. J., Qi, Y., White, L. E., Killmar, J. T., Kaczorowski, C. C., Ashbrook, D. G., Johnson, G. A., et al. (2026) · Nature Neuroscience · doi:10.1038/s41593-025-02199-4 · Cited by 1
Borghys, H., Schwab, A. J., & Keppler, B. R. (2024) · Heliyon · doi:10.1016/j.heliyon.2024.e39104 · Cited by 1
Guo, S., Wei, F., Chang, Y.-C., Wu, S.-Q., Lou, Z., Ma, Y.-F., Huang, Q., He, K., Fu, C.-L., Cao, X., et al. (2025) · European Journal of Nuclear Medicine and Molecular Imaging · doi:10.1007/s00259-025-07559-7 · Cited by 1
NMR metabolomics in genetically engineered mouse models
Aysin, K. N., Rudenko, A. Y., Mariasina, S. S., & Polshakov, V. I. (2025) · Biophysical Reviews · doi:10.1007/s12551-025-01378-8 · Cited by 1
Impaired docking and recycling of synaptic vesicles in inherited lysosomal sphingolipidoses
Zelada, D., Saldivia, N., Konjeti, A., Samano, S., Marshall, M. S., Rebiai, R., Sutter, P. A., Zurawski, Z., Simchuk, D., Muchiri, R. N., et al. (2025) · Cell Communication and Signaling · doi:10.1186/s12964-025-02560-x · Cited by 1
Cao, H., Liang, J., Dong, X., Xia, Z., Luo, X., & Liu, B. (2026) · Frontiers in Aging Neuroscience · doi:10.3389/fnagi.2026.1767811 · Cited by 1
Villanueva, E. B., Zebec, Z., Cisquella-Serra, M., Lundstrøm, J., Andersen, J., Qvist, F. L., Westi, E. W., Marín, A., Jimenez‐Duran, G., Riera‐Ponsati, L., et al. (2026) · Journal of Biomedical Science · doi:10.1186/s12929-026-01257-8 · Cited by 1
Self-citationAltered Metabolic Signaling and Potential Therapies in Polyglutamine Diseases
Vohra, A., Keefe, P., & Puthanveetil, P. (2024) · Metabolites · doi:10.3390/metabo14060320 · Cited by 1
Kim, S. S., Jeon, J. K., Ganbat, D., Kim, T.-W., Shin, K., Hong, S., & Hong, J. W. (2023) · bioRxiv (Cold Spring Harbor Laboratory) · doi:10.1101/2023.01.24.525465 · Cited by 1
Aleksanyan, N. J., Kotsinyan, N., Melik-Andreasyan, G., Aleksanyan, Y. T., Ավետիսյան, Լ. Մ., & Vanyan, A. V. (2022) · Medical Science of Armenia · doi:10.54503/0514-7484-2022-62.3-66
Han, Y., Zeng, X., Hua, L., Quan, X., Chen, Y., Zhou, M., Chuang, Y. C., Li, Y., Wang, S., Shen, X., et al. (2024) · Figshare · doi:10.6084/m9.figshare.25034386
Johnson, G. A., Tian, Y., Hornburg, K. J., Cook, J. J., Qi, Y. P., WHITE, L. E., KILLMAR, J. T., Kaczorowski, C. C., Ashbrook, D. G., & Williams, R. W. (2025) · bioRxiv (Cold Spring Harbor Laboratory) · doi:10.1101/2025.01.08.632011
Metabolic Regulation as a Potential Therapeutic Approach for Alzheimer's Disease
Zhong, J., Sun, J., & Zhou, B. (2025) · Current Alzheimer Research · doi:10.2174/0115672050379410250421065857
Wegener, A. J., Stadtler, H., Fulenwider, H. D., Glasper, E. R., & Neigh, G. N. (2025) · Brain Behavior & Immunity - Health · doi:10.1016/j.bbih.2025.101087
Villanueva, E. B., Zebec, Z., Lundstrøm, J., Andersen, J. V., Qvist, F. L., Westi, E. W., Marín, A., Jimenez‐Duran, G., Riera-Ponsati, L., Tresse, E., et al. (2025) · bioRxiv (Cold Spring Harbor Laboratory) · doi:10.1101/2025.08.14.670043
Self-citationLiu, C., Shi, Y., Hu, Q., Chu, Y., Guo, Y., Song, C., Jia, J., & He, C. (2025) · Journal of Trace Elements in Medicine and Biology · doi:10.1016/j.jtemb.2025.127779
Komleva, Y. K., Сергеевич, А. А., Chistyakov, D. V., Васильев, В. Г., Ивлев, В. А., Zhdankina, V. I., Kukla, M. V., Luk’yanchuk, A. N., Potapenko, I., & Salmina, A. B. (2025) · Biomedical Chemistry Research and Methods · doi:10.18097/bmcrm00291
Han, Y., Zeng, X., Hua, L., Quan, X., Chen, Y., Zhou, M., Chuang, Y., Li, Y., Wang, S., Shen, X., et al. (2024) · Figshare · doi:10.6084/m9.figshare.25034497
Han, Y., Zeng, X., Hua, L., Quan, X., Chen, Y., Zhou, M., Chuang, Y., Li, Y., Wang, S., Shen, X., et al. (2024) · Figshare · doi:10.6084/m9.figshare.26669622
Han, Y., Zeng, X., Hua, L., Quan, X., Chen, Y., Zhou, M., Chuang, Y., Li, Y., Wang, S., Shen, X., et al. (2024) · Figshare · doi:10.6084/m9.figshare.26669610
Han, Y., Zeng, X., Hua, L., Quan, X., Chen, Y., Zhou, M., Chuang, Y., Li, Y., Wang, S., Shen, X., et al. (2024) · Figshare · doi:10.6084/m9.figshare.26669628
Han, Y., Zeng, X., Hua, L., Quan, X., Chen, Y., Zhou, M., Chuang, Y., Li, Y., Wang, S., Shen, X., et al. (2024) · Figshare · doi:10.6084/m9.figshare.26669625
Wang, W., Zhao, F., Lu, Y., Siedlak, S. L., Fujioka, H., Feng, H., Perry, G., & Zhu, X. (2024) · Figshare · doi:10.6084/m9.figshare.26579702
Han, Y., Zeng, X., Hua, L., Quan, X., Chen, Y., Zhou, M., Chuang, Y., Li, Y., Wang, S., Shen, X., et al. (2024) · Figshare · doi:10.6084/m9.figshare.26669616
Han, Y., Zeng, X., Hua, L., Quan, X., Chen, Y., Zhou, M., Chuang, Y., Li, Y., Wang, S., Shen, X., et al. (2024) · Figshare · doi:10.6084/m9.figshare.26669631
Metadata
- Authors
- Andersen, J. V., Skotte, N. H., Christensen, S. K., Polli, F. S., Shabani, M., Markussen, K. H., Haukedal, H., Westi, E. W., Diaz-delCastillo, M., Sun, R. C., Kohlmeier, K. A., Schousboe, A., Gentry, M. S., Tanila, H., Freude, K. K., Aldana, B. I., Mann, M., & Waagepetersen, H. S.
- Affiliations
- University of Copenhagen (DK)
- Scripps Research Institute (US)
- Kerman University of Medical Sciences (IR)
- University of Kentucky (US)
- University of Eastern Finland (FI)
- Corresponding author
- Andersen, Jens V.
- Waagepetersen, Helle S.
- ORCID
- Venue
- Cell Death & Disease
- Published
- 2021-10-16
- Volume
- 12
- Issue
- 11
- Pages
- 954-954
- ISSN
- 2041-4889 (ISSN-L)
- PMC
- PMC8520528
- OpenAlex
- W3206998885
- Cited by
- 104
- References
- 82
- Citations by year
- 2026: 15 · 2025: 28 · 2024: 21 · 2023: 30 · 2022: 10
- FWCI
- 11.15
- Type
- journal article
- Language
- en
- Open access
- gold
- doi.org
- Locations
- Cell Death and Disease (publishedVersion, cc-by)
- SSRN Electronic Journal (acceptedVersion)
- Europe PMC (PubMed Central) (publishedVersion, other-oa)
- PubMed Central (publishedVersion, cc-by)
- PubMed (publishedVersion)
- Research at the University of Copenhagen (University of Copenhagen) (publishedVersion, cc-by)
- University of Southern Denmark Research Portal (University of Southern Denmark) (acceptedVersion, cc-by)
- DOAJ (DOAJ: Directory of Open Access Journals) (submittedVersion, cc-by-sa)
- Funders
- Hørslev-Fonden (203866)
- Lundbeckfonden (R333‐2019‐1244, NNF14CC0001, R211-2015-3062, R338-2019-2997, R208‐2015‐2859)
- Novo Nordisk (NNF14CC0001, NNF15CC0001)
- Augustinus Fonden (18-1624)
- Novo Nordisk Fonden (NNF 14CC0001, NNF18OC0052369, NNF15CC0001)
- Grosserer L. F. Foghts Fond
- H. Lundbeck A/S
- National Institutes of Health
- National Institute on Aging (R01AG066653)
- National Institute of Neurological Disorders and Stroke (R35NS116824)
- Topics
- Life Sciences › Neuroscience › Cellular and Molecular Neuroscience › Alzheimer's disease research and treatments
- Life Sciences › Neuroscience › Cellular and Molecular Neuroscience › Neuroscience and Neuropharmacology Research
- Life Sciences › Neuroscience › Neurology › Neuroinflammation and Neurodegeneration Mechanisms
- Keywords
- Alzheimer's disease, 5xFAD mice, amyloid-beta deposition, hippocampus, astrocytes, neuronal metabolism, TCA cycle, glutamine synthesis, GABA synthesis, glucose oxidation, mitochondrial dysfunction, glycolysis, synaptic dysfunction, neuronal hyperexcitability, cerebral cortex, brain energy metabolism, 13C isotope tracing
- MeSH terms
- Alzheimer Disease, Amyloid, Animals, Astrocytes, Cerebral Cortex, Citric Acid Cycle, Disease Models, Animal, Energy Metabolism, Glucose, Glutamine, Glycolysis, Hippocampus, Male, Mice, Transgenic, Mitochondria, Synapses, Signal Transduction, Neurotransmitter Agents, Proteome, Metabolome
About these checks
Registry, retraction, Cites and statistics results are computed, not judged, with one exception: a printed reference that no index lists is read once by a model before it counts as a citation error. Claims are extracted by a model and kept only when their quote appears verbatim in the text; each cited source is then checked, with a model’s help, for whether it says what the claim relies on. Those verdicts can be wrong — read the claim’s quote and the cited source before relying on one.
Statistics and arithmetic are recomputed, not judged.
Confidence bands are shown only for fields calibrated on our annotated test set. None is calibrated yet, so no band is shown.
What counts as a claim ›How we measure confidence ›How we check this ›
Are you an author, or do you see a problem with this page? Request a review
