

The DOI matches its Crossref record; 52 of the 52 references it cites were found in a registry or an index; 1 of the 32 sources its claims cite were checked for support.
Burned forests impact water supplies
Open accessAbstract
Wildland fire impacts on surface freshwater resources have not previously been measured, nor factored into regional water management strategies. But, large wildland fires are increasing and raise concerns about fire impacts on potable water. Here we synthesize long-term records of wildland fire, climate, and river flow for 168 locations across the United States. We show that annual river flow changed in 32 locations, where more than 19% of the basin area was burned. Wildland fires enhanced annual river flow in the western regions with a warm temperate or humid continental climate. Wildland fires increased annual river flow most in the semi-arid Lower Colorado region, in spite of frequent droughts in this region. In contrast, prescribed burns in the subtropical Southeast did not significantly alter river flow. These extremely variable outcomes offer new insights into the potential role of wildfire and prescribed fire in regional water resource management, under a changing climate.
Overview
AI snapshot
Written from the paper’s full text.
TL;DR
This study synthesizes 30 years of wildland fire, climate, and river-flow records for 168 US locations and finds that large fires can increase annual river flow, especially in the western US, when burned area exceeds a critical threshold. Prescribed burns in the subtropical Southeast did not significantly alter river flow.
Key findings
- Annual river flow changed in 32 locations where more than 19% of the basin area was burned; the critical relative burned-area threshold identified was BARt = 19%.
- Wildland fires enhanced annual river flow in western warm temperate or humid continental climates, most strongly in the semi-arid Lower Colorado region despite frequent droughts; four Arizona rivers with BAR >39% increased flow by more than +128%, while Pacific Northwest rivers increased by +24% (median of 6 rivers) and one Texas-Gulf river by +98%.
- For the CONUS as a whole, fire-affected locations showed a median river-flow decline of −5.9 mm (−5.7%), alongside a median precipitation decline of −23.1 mm (−2.3%); at the CONUS scale for BAR ≥1%, fire influence on river flow was typically <1% and was overshadowed by climate, topography, and land cover.
- Prescribed burns in the subtropical Southeast did not significantly alter river flow; 90% were smaller than the critical BARt = 19%, and severe tropical weather in 2006 and 2008 complicated attribution in that region.
Methods
- The authors combined MTBS fire and burn-severity data (1984–2014), GAGES-II river-flow and watershed data, Daymet v3 and PRISM climate data, GMTED2010 topography, and NLCD 2001 land cover. The plenary set included 168 burned watersheds with BAR ≥1% burned in any single year between 1984 and 2008, with drainage areas between 10 and 100,000 km².
- River-flow disturbance was detected with a change-point model using the non-parametric Lepage statistic on monthly Q, and water-yield-ratio disturbance was detected with double-mass analysis and Chow’s F-test.
- Gradient boosting with 49 variables was used to identify the critical burned-area threshold BARt, and climate elasticity models were fitted to attribute observed river-flow change to climate versus wildland fire; attribution was performed for 32 burned watersheds with BAR ≥19% and a detected breakpoint.
Limitations
- The paper states that MTBS is the best available dataset for this analysis but contains only fires larger than 405 ha in the West and 202 ha in the East, and that burn-severity classification thresholds are uncertain, especially for moderate and high severity.
- The paper states that climate elasticity models were not significant for four burned watersheds because only pre-fire annual data were used, that severe tropical weather events in the South Atlantic-Gulf region complicated attribution and may mean outcomes there do not reflect actual fire impact, and that some western watersheds may have been affected by additional disturbances such as beetle outbreaks.
- Evident from the reported sample sizes: the attribution subset was small and overwhelmingly western (32 of 43 burned watersheds with BAR ≥19%; east n = 4), limiting regional inference for the eastern US.
Model-written summary. Check it against the paper before relying on it.
Integrity signals
Registry
Cites
Statistics
Figures
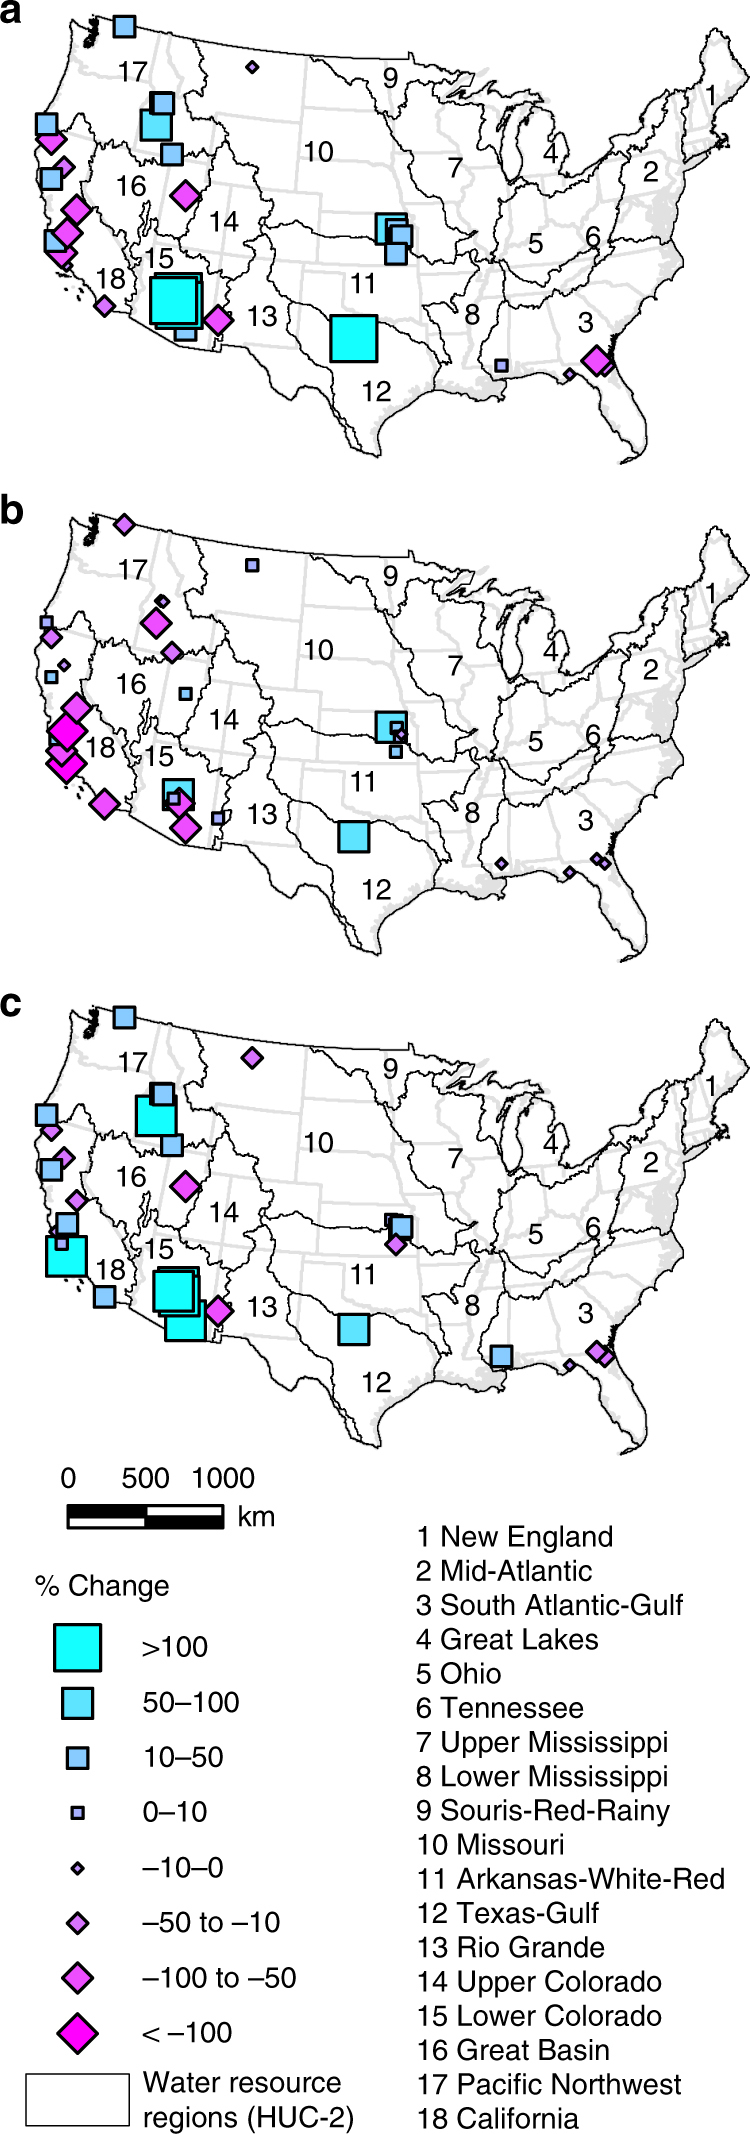
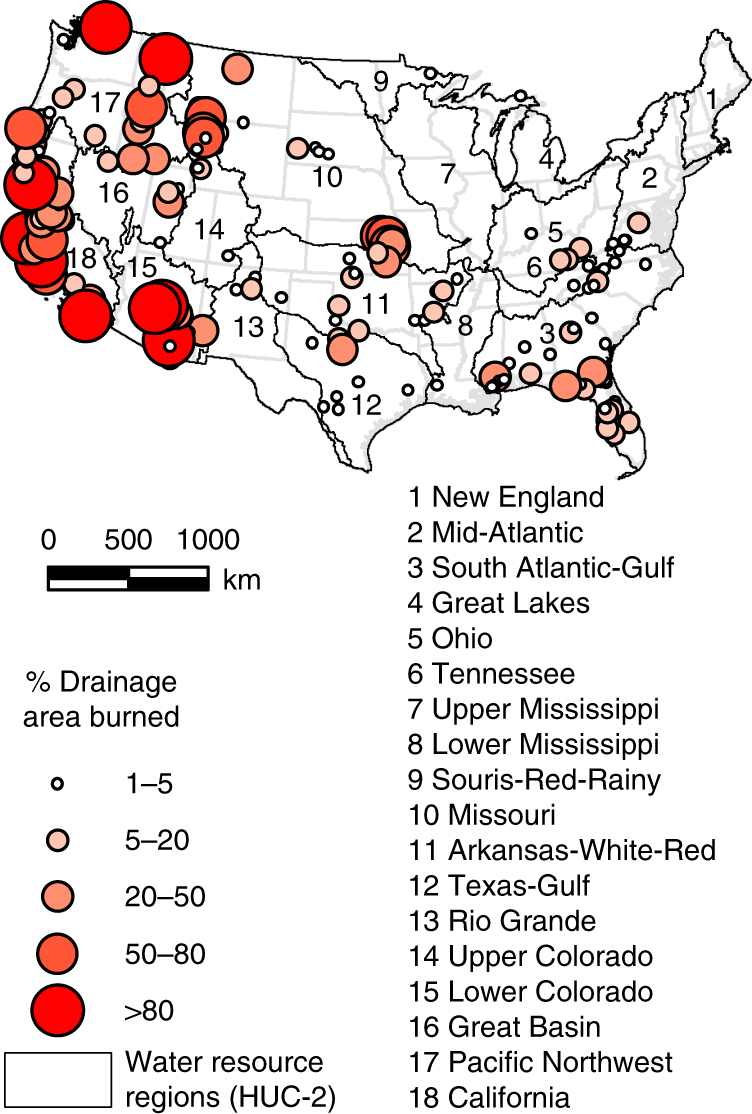
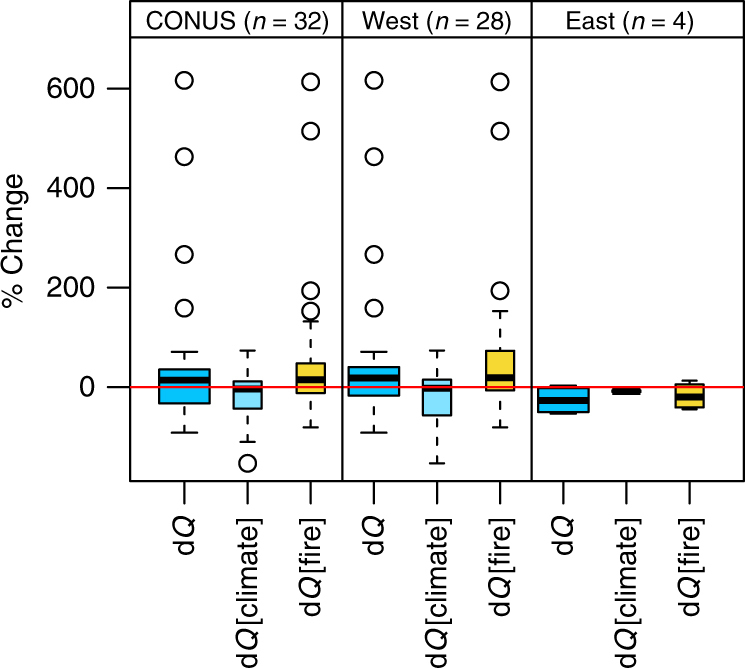
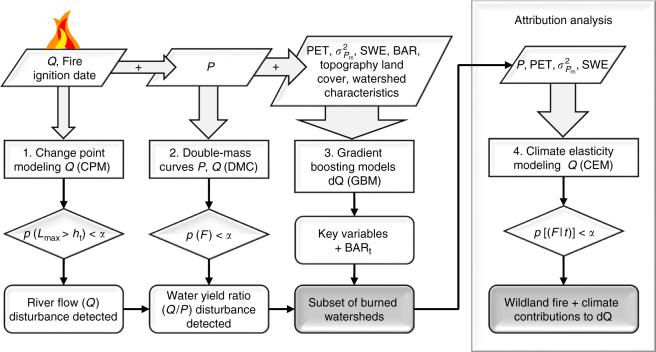
Verification
Claims the paper makes
49 Own result · 17 Not checked yet · 10 No basis given · 8 Own interpretation · 2 Own method · 1 Partly supported · accuracy not yet measured
A result the paper reports from its own data — it cites no other source for it, so there is none to check. The quote shows it is in the paper.
In the paper
“Wildland fires enhanced annual river flow in the western regions with a warm temperate or humid continental climate.”
§ Burned forests impact water supplies > Abstract
plaindirect- Asserted: passes — The authors put it forward as true.
- Checkable: passes — It can be checked against evidence.
- Load-bearing: passes — The paper’s conclusions depend on it.
- Based: passes — The paper gives a reason why it holds.
A result the paper reports from its own data — it cites no other source for it, so there is none to check. The quote shows it is in the paper.
In the paper
“In contrast, prescribed burns in the subtropical Southeast did not significantly alter river flow.”
- Also stated in: § Introduction · plain
“In contrast, prescribed burns in the subtropical Southeast did not significantly alter river flow.”
§ Burned forests impact water supplies > Abstract
plain- Asserted: passes — The authors put it forward as true.
- Checkable: passes — It can be checked against evidence.
- Load-bearing: passes — The paper’s conclusions depend on it.
- Based: passes — The paper gives a reason why it holds.
- Also stated in: § Introduction · plain
A result the paper reports from its own data — it cites no other source for it, so there is none to check. The quote shows it is in the paper.
In the paper
“We show that annual river flow changed in 32 locations, where more than 19% of the basin area was burned.”
- Also stated in: § Introduction · plain
“We show that of the 168 locations studied, wildland fires affected annual river flow in 32 locations, where more than 19% of the basin area was burned.”
§ Burned forests impact water supplies > Abstract
plaincorrelational- Asserted: passes — The authors put it forward as true.
- Checkable: passes — It can be checked against evidence.
- Load-bearing: passes — The paper’s conclusions depend on it.
- Based: passes — The paper gives a reason why it holds.
- Also stated in: § Introduction · plain
A result the paper reports from its own data — it cites no other source for it, so there is none to check. The quote shows it is in the paper.
In the paper
“Wildland fires increased annual river flow most in the semi-arid Lower Colorado region, in spite of frequent droughts in this region.”
§ Burned forests impact water supplies > Abstract
plaindirect- Asserted: passes — The authors put it forward as true.
- Checkable: passes — It can be checked against evidence.
- Load-bearing: passes — The paper’s conclusions depend on it.
- Based: passes — The paper gives a reason why it holds.
A result the paper reports from its own data — it cites no other source for it, so there is none to check. The quote shows it is in the paper.
In the paper
“The relative influence of the change in monthly precipitation variance was greater for the West (9.5%) compared to the East (4.9%) (Supplementary Fig. 1b cf. Supplementary Fig. 1c).”
§ Burned forests impact water supplies > Results > Climate and other factors influencing river flow response
plaincorrelational- Asserted: passes — The authors put it forward as true.
- Checkable: passes — It can be checked against evidence.
- Load-bearing: unclear — It is unclear whether the paper’s conclusions depend on it.
- Based: passes — The paper gives a reason why it holds.
A result the paper reports from its own data — it cites no other source for it, so there is none to check. The quote shows it is in the paper.
In the paper
“By contrast, in the Eastern CONUS, the proportion of the watershed with unvegetated land cover (barren land and urban area) had some influence on river flow (4.1% and 2.3%, respectively), secondary to climate factors (51% and 4.9% for annual precipitation and monthly precipitation variance, respectively) (Supplementary Fig. 1b cf. Supplementary Fig. 1c).”
§ Burned forests impact water supplies > Results > Climate and other factors influencing river flow response
plaincorrelational- Asserted: passes — The authors put it forward as true.
- Checkable: passes — It can be checked against evidence.
- Load-bearing: unclear — It is unclear whether the paper’s conclusions depend on it.
- Based: passes — The paper gives a reason why it holds.
A result the paper reports from its own data — it cites no other source for it, so there is none to check. The quote shows it is in the paper.
In the paper
“Wildland fire that burned 19% or more of the watershed area generally increased river flow.”
§ Burned forests impact water supplies > Results > Climate and other factors influencing river flow response
plaindirect- Asserted: passes — The authors put it forward as true.
- Checkable: passes — It can be checked against evidence.
- Load-bearing: passes — The paper’s conclusions depend on it.
- Based: passes — The paper gives a reason why it holds.
A result the paper reports from its own data — it cites no other source for it, so there is none to check. The quote shows it is in the paper.
In the paper
“however a change (breakpoint) in (dQ/dP) was detected in the same watersheds plus 23 additional watersheds (all in the Western CONUS)”
§ Burned forests impact water supplies > Methods > Hypothesis testing
plain- Asserted: passes — The authors put it forward as true.
- Checkable: passes — It can be checked against evidence.
- Load-bearing: passes — The paper’s conclusions depend on it.
- Based: passes — The paper gives a reason why it holds.
The paper states this without a source or data behind it here, so there is nothing to check it against. The quote shows it is in the paper.
In the paper
“For example, prescribed (controlled) burning, conducted to reduce accumulated fuels such as dead vegetation and fallen branches, had only a limited effect in the subtropical Southeast.”
§ Burned forests impact water supplies > Results > Wildland fire impacts on annual river flow
plain- Asserted: passes — The authors put it forward as true.
- Checkable: passes — It can be checked against evidence.
- Load-bearing: unclear — It is unclear whether the paper’s conclusions depend on it.
- Based: passes — The paper gives a reason why it holds.
A result the paper reports from its own data — it cites no other source for it, so there is none to check. The quote shows it is in the paper.
In the paper
“For the CONUS as a whole, river flow declined (median −5.9 mm or −5.7%) in fire-affected locations”
§ Burned forests impact water supplies > Results > Observed changes in annual river flow
plaincorrelational- Asserted: passes — The authors put it forward as true.
- Checkable: passes — It can be checked against evidence.
- Load-bearing: passes — The paper’s conclusions depend on it.
- Based: passes — The paper gives a reason why it holds.
- It may state two separate claims as one. 20
- Probably not a substantial claim. 4
The cited sources support only part of this claim — read each source’s verdict below.
In the paper
“these forests are now susceptible to wildland fire risk or will become so in the near future6,7.”
§ Burned forests impact water supplies > Introduction
What the sources say
- Not checked yetcites [6] Williams, C. J., Pierson, F. B., Robichaud, P. R. & Boll, J. Hydrologic and erosion responses to wildfire along the rangeland-xeric forest continuum in the western US: a review and model of hydrologic vulnerability. Int. J. Wildland Fire 23, 155–172 (2014). source
- Partly supportedcites [7] Balch, J. K. et al. Human-started wildfires expand the fire niche across the United States. Proc. Natl. Acad. Sci. USA 114, 2946–2951 (2017). sourceExperimental — accuracy not yet measured
The Discussion says human ignitions are extending fire into wetter conditions and that projected warming will likely increase fire risk where human ignitions are prevalent. It does not identify headwater forests as susceptible or specify that they will become so in the near future. (LLM, conf=0.84)
plain- Asserted: passes — The authors put it forward as true.
- Checkable: passes — It can be checked against evidence.
- Load-bearing: passes — The paper’s conclusions depend on it.
- Based: passes — The paper gives a reason why it holds.
It may state two separate claims as one.
A result the paper reports from its own data — it cites no other source for it, so there is none to check. The quote shows it is in the paper.
In the paper
“General patterns of post-fire river flow were not only caused by wildland fire, but also followed the interannual variability in climate conditions (Fig. 3).”
§ Burned forests impact water supplies > Results > Climate and other factors influencing river flow response
plaindirectn = 32- Asserted: passes — The authors put it forward as true.
- Checkable: passes — It can be checked against evidence.
- Load-bearing: passes — The paper’s conclusions depend on it.
- Based: passes — The paper gives a reason why it holds.
It may state two separate claims as one.
A result the paper reports from its own data — it cites no other source for it, so there is none to check. The quote shows it is in the paper.
In the paper
“burning large portions of watersheds in California (median BAR 20.6%), the Lower Colorado region (15.4%), and the Pacific Northwest (13.5%) (Fig. 2 and Supplementary Table 1).”
§ Burned forests impact water supplies > Results > Wildland fire impacts on annual river flow
plain- Asserted: passes — The authors put it forward as true.
- Checkable: passes — It can be checked against evidence.
- Load-bearing: unclear — It is unclear whether the paper’s conclusions depend on it.
- Based: passes — The paper gives a reason why it holds.
It may state two separate claims as one.
A result the paper reports from its own data — it cites no other source for it, so there is none to check. The quote shows it is in the paper.
In the paper
“and to a smaller extent in the Pacific Northwest region.”
§ Burned forests impact water supplies > Results > Observed changes in annual river flow
plaincorrelational- Asserted: passes — The authors put it forward as true.
- Checkable: passes — It can be checked against evidence.
- Load-bearing: unclear — It is unclear whether the paper’s conclusions depend on it.
- Based: passes — The paper gives a reason why it holds.
It may state two separate claims as one.
The paper states this without a source or data behind it here, so there is nothing to check it against. The quote shows it is in the paper.
In the paper
“The severity of the prescribed burns was limited, and their size below a critical minimum (BARt = 19%) needed to affect river flow.”
§ Burned forests impact water supplies > Results > Wildland fire impacts on annual river flow
plain- Asserted: passes — The authors put it forward as true.
- Checkable: passes — It can be checked against evidence.
- Load-bearing: passes — The paper’s conclusions depend on it.
- Based: passes — The paper gives a reason why it holds.
It may state two separate claims as one.
A result the paper reports from its own data — it cites no other source for it, so there is none to check. The quote shows it is in the paper.
In the paper
“The total number of burned watersheds with significant climate elasticity of river flow was 38, and we performed the attribution analysis for 32 of these for which a breakpoint was detected.”
§ Burned forests impact water supplies > Methods > Hypothesis testing
plain- Asserted: passes — The authors put it forward as true.
- Checkable: passes — It can be checked against evidence.
- Load-bearing: passes — The paper’s conclusions depend on it.
- Based: passes — The paper gives a reason why it holds.
It may state two separate claims as one.
- The authors state this as an assumption: Wildland fire was the principal cause of river flow disturbance in watersheds where BAR ≥ BARt.
A result the paper reports from its own data — it cites no other source for it, so there is none to check. The quote shows it is in the paper.
In the paper
“In the Pacific Northwest and Texas-Gulf regions, flow increased by +24% (median of 6 rivers) and +98% (1 river), respectively.”
§ Burned forests impact water supplies > Results > Wildland fire impacts on annual river flow
plaindirect- Asserted: passes — The authors put it forward as true.
- Checkable: passes — It can be checked against evidence.
- Load-bearing: unclear — It is unclear whether the paper’s conclusions depend on it.
- Based: passes — The paper gives a reason why it holds.
It may state two separate claims as one.
A result the paper reports from its own data — it cites no other source for it, so there is none to check. The quote shows it is in the paper.
In the paper
“Changes in annual precipitation and monthly precipitation variance had influences of >47% and >4.9%, respectively, of the total impact on river flow.”
§ Burned forests impact water supplies > Results > Climate and other factors influencing river flow response
plaindirect- Asserted: passes — The authors put it forward as true.
- Checkable: passes — It can be checked against evidence.
- Load-bearing: passes — The paper’s conclusions depend on it.
- Based: passes — The paper gives a reason why it holds.
It may state two separate claims as one.
A result the paper reports from its own data — it cites no other source for it, so there is none to check. The quote shows it is in the paper.
In the paper
“Flow increased most in the Lower Mississippi (median of +160.1 mm or +27.4%), Lower Colorado (+9.9 mm or +25.6%) and Upper Colorado (+77.5 mm or +19.8%) regions.”
§ Burned forests impact water supplies > Results > Observed changes in annual river flow
plain- Asserted: passes — The authors put it forward as true.
- Checkable: passes — It can be checked against evidence.
- Load-bearing: unclear — It is unclear whether the paper’s conclusions depend on it.
- Based: passes — The paper gives a reason why it holds.
It may state two separate claims as one.
A result the paper reports from its own data — it cites no other source for it, so there is none to check. The quote shows it is in the paper.
In the paper
“Likewise, the greatest increase in precipitation occurred in the Lower Mississippi (+311.2 mm or +23.3%) and Upper Colorado (+41.9 mm or +6.9%) regions.”
§ Burned forests impact water supplies > Results > Observed changes in annual river flow
plain- Asserted: passes — The authors put it forward as true.
- Checkable: passes — It can be checked against evidence.
- Load-bearing: unclear — It is unclear whether the paper’s conclusions depend on it.
- Based: passes — The paper gives a reason why it holds.
It may state two separate claims as one.
A result the paper reports from its own data — it cites no other source for it, so there is none to check. The quote shows it is in the paper.
In the paper
“The South Atlantic-Gulf, Missouri, Lower Colorado, Pacific Northwest and California regions combined had seven burned watersheds where a climate elasticity model of Q (CEM4) with parameters for dP and dSWE (change in snow water equivalent) yielded the best fit (Supplementary Fig. 4a), especially for watersheds located at higher elevations (typically >450 m) and with steep topography (Supplementary”
§ Burned forests impact water supplies > Methods > Assessment of wildland fire impacts on river flow
plaincorrelational- Asserted: passes — The authors put it forward as true.
- Checkable: passes — It can be checked against evidence.
- Load-bearing: unclear — It is unclear whether the paper’s conclusions depend on it.
- Based: passes — The paper gives a reason why it holds.
It may state two separate claims as one.
A result the paper reports from its own data — it cites no other source for it, so there is none to check. The quote shows it is in the paper.
In the paper
“Conversely, wildland fire impacts were greater in southern and central California (>50%; Csa, Csb; Fig. 1c), but declining precipitation trends masked the enhancing impact of wildfire on river flow. These opposite trends resulted in a net decline in river flow.”
§ Burned forests impact water supplies > Results > Climate and other factors influencing river flow response
plaindirect- Asserted: passes — The authors put it forward as true.
- Checkable: passes — It can be checked against evidence.
- Load-bearing: passes — The paper’s conclusions depend on it.
- Based: passes — The paper gives a reason why it holds.
It may state two separate claims as one.
The paper states this without a source or data behind it here, so there is nothing to check it against. The quote shows it is in the paper.
In the paper
“The CEM was not significant for four burned watersheds (Supplementary Fig. 6d), because only pre-fire annual data was used, reducing the significance of the test statistic.”
§ Burned forests impact water supplies > Methods > Hypothesis testing
plaindirect- Asserted: passes — The authors put it forward as true.
- Checkable: passes — It can be checked against evidence.
- Load-bearing: unclear — It is unclear whether the paper’s conclusions depend on it.
- Based: passes — The paper gives a reason why it holds.
It may state two separate claims as one.
None of the sources cited for this claim have been checked yet.
In the paper
“However, it is unclear how this fire pattern affects water availability at the regional or continental scale1–4.”
§ Burned forests impact water supplies > Introduction
What the sources say
- Not checked yetcites [1] Dennison, P. E., Brewer, S. C., Arnold, J. D. & Moritz, M. A. Large wildfire trends in the western United States, 1984–2011. Geophys. Res. Lett. 41, 2928–2933 (2014). source
- Not checked yetcites [2] Littell, J. S. et al. A review of the relationships between drought and forest fire in the United States. Glob. Change Biol. 22, 2353–2369 (2016). source
- Not checked yetcites [3] Wine, M. L. & Cadol, D. Hydrologic effects of large southwestern USA wildfires significantly increase regional water supply: fact or fiction? Environ. Res. Lett. 11, 085006 (2016). source
- Not checked yetcites [4] Martin, D. A. At the nexus of fire, water and society. Philos. Trans. R. Soc. B 371, 20150172 (2016). source
plain- Asserted: passes — The authors put it forward as true.
- Checkable: passes — It can be checked against evidence.
- Load-bearing: passes — The paper’s conclusions depend on it.
- Based: passes — The paper gives a reason why it holds.
Probably not a substantial claim.
A conclusion the paper draws from its own results — it cites no other source for it, so there is none to check. The quote shows it is in the paper.
In the paper
“Our study suggests that both climatic variability and fire characteristics affect river flow.”
§ Burned forests impact water supplies > Results > Implications for post-fire forest and water management
hedgeddirect- Asserted: passes — The authors put it forward as true.
- Checkable: passes — It can be checked against evidence.
- Load-bearing: passes — The paper’s conclusions depend on it.
- Based: passes — The paper gives a reason why it holds.
It may state two separate claims as one.
In the paper
“MTBS is currently the best dataset available for the purpose of this analysis, because it contains the largest historical record of CONUS wildland fires larger than 405 ha (1000 acres) in the West, and larger than 202 ha (500 acres) in the East, respectively, between 1984 and 2016.”
§ Burned forests impact water supplies > Methods > Datasets
What the sources say
- Not checked yetcites [27] Eidenshink, J. et al. A project for monitoring trends in burn severity. Fire Ecol. 3, 3–21 (2007). source
plain- Asserted: passes — The authors put it forward as true.
- Checkable: passes — It can be checked against evidence.
- Load-bearing: passes — The paper’s conclusions depend on it.
- Based: passes — The paper gives a reason why it holds.
It may state two separate claims as one.
None of the sources cited for this claim have been checked yet.
In the paper
“Climate elasticity models (CEMs) are especially suited for this purpose and commonly applied in the attribution of river flow disturbance12,55.”
§ Burned forests impact water supplies > Methods > Assessment of wildland fire impacts on river flow
What the sources say
- Not checked yetcites [12] Hallema, D. W. et al. Assessment of wildland fire impacts on watershed annual water yield: analytical framework and case studies in the United States. Ecohydrology 10, e1794 (2017). source
- Not checked yetcites [55] Sankarasubramanian, A., Vogel, R. M. & Limbrunner, J. F. Climate elasticity of streamflow in the United States. Water Resour. Res. 37, 1771–1781 (2001). source
plaincorrelational- Asserted: passes — The authors put it forward as true.
- Checkable: passes — It can be checked against evidence.
- Load-bearing: fails — The paper’s conclusions may not depend on it.
- Based: passes — The paper gives a reason why it holds.
Probably not a substantial claim. The paper’s conclusions may not depend on it. It may state two separate claims as one.
None of the sources cited for this claim have been checked yet.
In the paper
“This GBM increases robustness by selecting samples randomly, and has previously been employed in studies on Q trend analysis and prediction53,54.”
§ Burned forests impact water supplies > Methods > Assessment of wildland fire impacts on river flow
What the sources say
- Not checked yetcites [53] Rice, J. S., Emanuel, R. E., Vose, J. M. & Nelson, S. A. C. Continental US streamflow trends from 1940 to 2009 and their relationships with watershed spatial characteristics. Water Resour. Res. 51, 6262–6275 (2015). source
- Not checked yetcites [54] Erdal, H. I. & Karakurt, O. Advancing monthly streamflow prediction accuracy of CART models using ensemble learning paradigms. J. Hydrol. 477, 119–128 (2013). source
plaindirect- Asserted: passes — The authors put it forward as true.
- Checkable: passes — It can be checked against evidence.
- Load-bearing: fails — The paper’s conclusions may not depend on it.
- Based: passes — The paper gives a reason why it holds.
Probably not a substantial claim. The paper’s conclusions may not depend on it. It may state two separate claims as one.
A conclusion the paper draws from its own results — it cites no other source for it, so there is none to check. The quote shows it is in the paper.
In the paper
“However, the likely reason that prescribed burning effects on annual river flow in the South Atlantic-Gulf region were not significant is that these burns were small compared to the size of the watersheds in which they were conducted—90% were burned across an area smaller than the critical relative burned area threshold BARt = 19%.”
§ Burned forests impact water supplies > Results > Implications for post-fire forest and water management
hedgedconditional- Asserted: passes — The authors put it forward as true.
- Checkable: passes — It can be checked against evidence.
- Load-bearing: passes — The paper’s conclusions depend on it.
- Based: passes — The paper gives a reason why it holds.
It may state two separate claims as one.
None of the sources cited for this claim have been checked yet.
In the paper
“Climate elasticity modeling was also complicated by severe tropical weather events (2006 and 2008 hurricane seasons23,24) in this region (Florida, Georgia, and Mississippi), and we believe that the outcomes of the attribution analysis for these areas do not reflect the actual fire impact.”
§ Burned forests impact water supplies > Results > Implications for post-fire forest and water management
What the sources say
- Not checked yetcites [23] Franklin, J. L. & Brown, D. P. Atlantic hurricane season of 2006. Mon. Weather Rev. 136, 1174–1200 (2008). source
- Not checked yetcites [24] Brown, D. P., Beven, J. L., Franklin, J. L. & Blake, E. S. Atlantic hurricane season of 2008. Mon. Weather Rev. 138, 1975–2001 (2010). source
hedgeddirect- Asserted: passes — The authors put it forward as true.
- Checkable: passes — It can be checked against evidence.
- Load-bearing: unclear — It is unclear whether the paper’s conclusions depend on it.
- Based: passes — The paper gives a reason why it holds.
It may state two separate claims as one.
None of the sources cited for this claim have been checked yet.
In the paper
“MTBS has been the dataset of choice in studies on CONUS-wide trends in burn severity and area28,29, forest disturbance30, and vegetation type conversion after wildland fire31.”
§ Burned forests impact water supplies > Methods > Datasets
What the sources say
- Not checked yetcites [28] Dillon, G. K., et al. Both topography and climate affected forest and woodland burn severity in two regions of the western US, 1984 to 2006. Ecosphere 2, 130 (2011). source
- Not checked yetcites [29] Picotte, J. J., Peterson, B., Meier, G. & Howard, S. M. 1984–2010 trends in fire burn severity and area for the conterminous US. Int. J. Wildland Fire 25, 413–420 (2016). source
- Not checked yetcites [30] Hart, S. J., Schoennagel, T., Veblen, T. T. & Chapman, T. B. Area burned in the western United States is unaffected by recent mountain pine beetle outbreaks. Proc. Natl. Acad. Sci. USA 112, 4375–4380 (2015). source
- Not checked yetcites [31] Meng, R., Dennison, P. E., D’Antonio, C. M. & Moritz, M. A. Remote sensing analysis of vegetation recovery following short-interval fires in Southern California shrublands. PLoS ONE 9, e110637 (2014). source
plain- Asserted: passes — The authors put it forward as true.
- Checkable: passes — It can be checked against evidence.
- Load-bearing: fails — The paper’s conclusions may not depend on it.
- Based: passes — The paper gives a reason why it holds.
Probably not a substantial claim. The paper’s conclusions may not depend on it.
In the paper
“The Lepage test can detect general types of distribution change and is considered more powerful than comparable non-parametric tests for detecting changes in hydrological time series data46.”
§ Burned forests impact water supplies > Methods > Assessment of wildland fire impacts on river flow
What the sources say
- Not checked yetcites [46] Yang, T., Chen, X., Xu, C.-Y. & Zhang, Z.-C. Spatio-temporal changes of hydrological processes and underlying driving forces in Guizhou region, Southwest China. Stoch. Environ. Res. Risk Assess. 23, 1071–1108 (2009). source
plain- Asserted: passes — The authors put it forward as true.
- Checkable: passes — It can be checked against evidence.
- Load-bearing: passes — The paper’s conclusions depend on it.
- Based: passes — The paper gives a reason why it holds.
It may state two separate claims as one.
The paper relies on this without support.
Wildland fire impacts on surface freshwater resources have not previously been measured, nor factored into regional water management strategies.
“Wildland fire impacts on surface freshwater resources have not previously been measured, nor factored into regional water management strategies.”
The paper relies on this without support.
Large wildland fires are increasing and raise concerns about fire impacts on potable water.
“But, large wildland fires are increasing and raise concerns about fire impacts on potable water.”
The paper relies on this without support.
Wildfire seasons in the US are becoming longer due to recurring drought, coupled with more ignition sources and available fuel.
“Wildfire seasons in the US are becoming longer due to recurring drought, coupled with more ignition sources and available fuel.”
The paper relies on this without support.
Prescribed burns are generally conducted during favorable weather and vegetation conditions.
“Prescribed burns are generally conducted during favorable weather and vegetation conditions.”
The paper relies on this without support.
High wind speeds and low humidity levels in the lower atmosphere and in vegetation allow fires to spread rapidly.
“High wind speeds and low humidity levels in the lower atmosphere and in vegetation, allow fires to spread rapidly”
The paper relies on this without support.
Vegetation mortality increases runoff.
“mainly because vegetation mortality increases runoff”
The authors state this as an assumption.
Wildland fire was the principal cause of river flow disturbance in watersheds where BAR ≥ BARt.
“Wildland fire was presumed the principal cause of in watersheds where BAR ≥ BARt, although some western watersheds may have been affected by additional disturbances not accounted for, e.g., beetle outbreaks.”
The authors state this as an assumption.
River flow disturbance was associated with the fire, so that a detected change point within one year following the fire indicates fire-associated disturbance.
“The null hypothesis was rejected if this timing occurred within one year following the fire assuming that river flow disturbance was associated with the fire.”
Claims other papers make about this one
Each is checked against this paper’s own text: does it say what the citing paper says it does?
In the citing paper
“These studies demonstrate the variability and complexity of influencing factors in relation to the impacts of ash contamination on aquatic biota, highlighting the limited breadth of available research in this area (Hallema et al. 2018).”
From Chemical composition of wildfire ash produced in contrasting ecosystems and its toxicity to Daphnia magna (2019) · cites this paper as Hallema et al. 2018
Citations
Cites
Estimating the Dimension of a Model
Schwarz, G. (1978) · The Annals of Statistics · doi:10.1214/aos/1176344136 · Cited by 47,033
Greedy function approximation: A gradient boosting machine
Friedman, J. H. (2001) · The Annals of Statistics · doi:10.1214/aos/1013203451 · Cited by 30,731
A decision-theoretic generalization of on-line learning and an application to boosting
Freund, Y., & Schapire, R. E. (1997) · Journal of Computer and System Sciences · doi:10.1006/jcss.1997.1504 · Cited by 20,466
On a Test of Whether one of Two Random Variables is Stochastically Larger than the Other
Mann, H. B., & Whitney, D. R. (1947) · The Annals of Mathematical Statistics · doi:10.1214/aoms/1177730491 · Cited by 14,320
Updated world map of the Köppen-Geiger climate classification
(2007) · doi:10.5194/hess-11-1633-2007 · Cited by 13,640
Tests of Equality Between Sets of Coefficients in Two Linear Regressions
Chow, G. C. (1960) · Econometrica · doi:10.2307/1910133 · Cited by 6,486
Warming and earlier spring increase western U.S. forest wildfire activity.
Westerling, A. L., Hidalgo, H. G., Cayan, D. R., & Swetnam, T. W. (2006) · Science · doi:10.1126/science.1128834 · Cited by 5,176
Daly, C., Halbleib, M. D., Smith, J. I., Gibson, W. P., Doggett, M. K., Taylor, G. H., Curtis, J. B., & Pasteris, P. P. (2008) · International Journal of Climatology · doi:10.1002/joc.1688 · Cited by 3,113
(2015) · Photogrammetric Engineering & Remote Sensing · doi:10.1016/s0099-1112(15)30100-2 · Cited by 2,584
USGS Water Data for the Nation
Survey, U. S. G. (1994) · U.S. Geological Survey · doi:10.5066/f7p55kjn · Cited by 1,478
Global multi-resolution terrain elevation data 2010 (GMTED2010)
Danielson, J. J., & Gesch, D. B. (2011) · Antarctica A Keystone in a Changing World · doi:10.3133/ofr20111073 · Cited by 1,470
A Project for Monitoring Trends in Burn Severity
Eidenshink, J., Schwind, B., Brewer, K., Zhu, Z.-L., Quayle, B., & Howard, S. (2007) · Fire Ecology · doi:10.4996/fireecology.0301003 · Cited by 1,423
Large wildfire trends in the western United States, 1984–2011
Dennison, P. E., Brewer, S. C., Arnold, J. D., & Moritz, M. A. (2014) · Geophysical Research Letters · doi:10.1002/2014gl059576 · Cited by 1,322
Human-started wildfires expand the fire niche across the United States
Balch, J. K., Bradley, B. A., Abatzoglou, J. T., Nagy, R. C., Fusco, E. J., & Mahood, A. L. (2017) · Proceedings of the National Academy of Sciences · doi:10.1073/pnas.1617394114 · Cited by 1,043
Estimating Potential Evapotranspiration
Hamon, W. R. (1961) · Journal of the Hydraulics Division · doi:10.1061/jyceaj.0000599 · Cited by 742
Current research issues related to post-wildfire runoff and erosion processes
Moody, J. A., Shakesby, R. A., Robichaud, P. R., Cannon, S. H., & Martin, D. A. (2013) · Earth-Science Reviews · doi:10.1016/j.earscirev.2013.03.004 · Cited by 693
Climate elasticity of streamflow in the United States
Sankarasubramanian, A., Vogel, R. M., & Limbrunner, J. F. (2001) · Water Resources Research · doi:10.1029/2000wr900330 · Cited by 635
Monitoring the effects of timber harvest on annual water yield
Stednick, J. D. (1996) · Journal of Hydrology · doi:10.1016/0022-1694(95)02780-7 · Cited by 579
A review of the relationships between drought and forest fire in the United States
Littell, J. S., Peterson, D. L., Riley, K. L., Liu, Y., & Luce, C. H. (2016) · Global Change Biology · doi:10.1111/gcb.13275 · Cited by 571
Self-citationDaymet: Daily Surface Weather Data on a 1-km Grid for North America, Version 3
Thornton, P., Thornton, M., Mayer, B., Wei, Y.-X., Devarakonda, R., Vose, R., & Cook, R. (2016) · Oak Ridge National Laboratory Distributed Active Archive Center for Biogeochemical Dynamics · doi:10.3334/ornldaac/1328 · Cited by 540
On the Asymptotic Efficiency of Certain Nonparametric Two-Sample Tests
Mood, A. M. (1954) · The Annals of Mathematical Statistics · doi:10.1214/aoms/1177728719 · Cited by 407
Dillon, G. K., Holden, Z. A., Morgan, P., Crimmins, M. A., Heyerdahl, E. K., & Luce, C. H. (2011) · Ecosphere · doi:10.1890/es11-00271.1 · Cited by 390
Wildfire and the Future of Water Supply
Bladon, K. D., Emelko, M. B., Silins, U., & Stone, M. (2014) · Environmental Science & Technology · doi:10.1021/es500130g · Cited by 354
Self-citationA Combination of Wilcoxon's and Ansari-Bradley's Statistics
LEPAGE, Y. (1971) · Biometrika · doi:10.1093/biomet/58.1.213 · Cited by 335
Sun, G., Caldwell, P. V., Asko Noormets, A., McNulty, S. G., Cohen, E. C., Myers, J. M., Domec, J., Treasure, E. A., Mu, Q., Xiao, J., et al. (2011) · Journal of Geophysical Research Atmospheres · doi:10.1029/2010jg001573 · Cited by 248
Self-citationParametric and Nonparametric Sequential Change Detection in R: The cpm Package
Ross, G. J. (2015) · Journal of Statistical Software · doi:10.18637/jss.v066.i03 · Cited by 222
Wei, X., & Zhang, M. (2010) · Water Resources Research · doi:10.1029/2010wr009250 · Cited by 202
Nonparametric Monitoring of Data Streams for Changes in Location and Scale
Ross, G. J., Tasoulis, D. K., & Adams, N. M. (2011) · Technometrics · doi:10.1198/tech.2011.10069 · Cited by 196
Advancing monthly streamflow prediction accuracy of CART models using ensemble learning paradigms
Erdal, H. I., & Karakurt, O. (2013) · Journal of Hydrology · doi:10.1016/j.jhydrol.2012.11.015 · Cited by 191
Kolden, C. A., Smith, A. M. S., & Abatzoglou, J. T. (2015) · International Journal of Wildland Fire · doi:10.1071/wf15082 · Cited by 165
Comment on “Data Assimilation Using an Ensemble Kalman Filter Technique”
van Leeuwen, P. J. (1999) · Monthly Weather Review · doi:10.1175/1520-0493(1999)127 · Cited by 140
Area burned in the western United States is unaffected by recent mountain pine beetle outbreaks
Hart, S. J., Schoennagel, T., Veblen, T. T., & Chapman, T. B. (2015) · Proceedings of the National Academy of Sciences · doi:10.1073/pnas.1424037112 · Cited by 128
Relations between soil hydraulic properties and burn severity
Moody, J. A., Ebel, B. A., Nyman, P., Martin, D. A., Stoof, C., & McKinley, R. (2016) · International Journal of Wildland Fire · doi:10.1071/wf14062 · Cited by 122
A spatial evaluation of global wildfire-water risks to human and natural systems
Robinne, F.-N., Bladon, K. D., Miller, C., Parisien, M.-A., Mathieu, J., & Flannigan, M. D. (2018) · Science of The Total Environment · doi:10.1016/j.scitotenv.2017.08.112 · Cited by 122
Self-citationSpatial Distribution of Water Supply in the Coterminous United States1
Brown, T. C., Hobbins, M. T., & Ramirez, J. A. (2008) · JAWRA Journal of the American Water Resources Association · doi:10.1111/j.1752-1688.2008.00252.x · Cited by 121
At the nexus of fire, water and society
Martin, D. A. (2016) · Philosophical Transactions of the Royal Society B: Biological Sciences · doi:10.1098/rstb.2015.0172 · Cited by 106
Managing Forests for Increased Regional Water Yield in the Southeastern U.S. Coastal Plain
McLaughlin, D. L., Kaplan, D. A., & Cohen, M. J. (2013) · JAWRA Journal of the American Water Resources Association · doi:10.1111/jawr.12073 · Cited by 100
Wine, M. L., & Cadol, D. (2016) · Environmental Research Letters · doi:10.1088/1748-9326/11/8/085006 · Cited by 96
Increased dry season water yield in burned watersheds in Southern California
Kinoshita, A. M., & Hogue, T. S. (2015) · Environmental Research Letters · doi:10.1088/1748-9326/10/1/014003 · Cited by 96
Rice, J. S., Emanuel, R. E., Vose, J. M., & Nelson, S. A. C. (2015) · Water Resources Research · doi:10.1002/2014wr016367 · Cited by 95
Hallema, D. W., Sun, G., Bladon, K. D., Norman, S. P., Caldwell, P. V., Liu, Y., & McNulty, S. G. (2017) · Hydrological Processes · doi:10.1002/hyp.11208 · Cited by 92
Self-citation1984–2010 trends in fire burn severity and area for the conterminous US
Picotte, J. J., Peterson, B., Meier, G., & Howard, S. M. (2016) · International Journal of Wildland Fire · doi:10.1071/wf15039 · Cited by 72
A regional estimate of postfire streamflow change in California
Bart, R. R. (2016) · Water Resources Research · doi:10.1002/2014wr016553 · Cited by 67
Williams, C. J., Pierson, F. B., Robichaud, P. R., & Boll, J. (2014) · International Journal of Wildland Fire · doi:10.1071/wf12161 · Cited by 66
Meng, R., Dennison, P. E., D’Antonio, C. M., & Moritz, M. A. (2014) · PLoS ONE · doi:10.1371/journal.pone.0110637 · Cited by 65
Ebel, B. A., Rengers, F. K., & Tucker, G. E. (2016) · Water Resources Research · doi:10.1002/2016wr019110 · Cited by 64
Hallema, D. W., Sun, G., Caldwell, P. V., Norman, S. P., Cohen, E. C., Liu, Y., Ward, E. J., & McNulty, S. G. (2017) · Ecohydrology · doi:10.1002/eco.1794 · Cited by 58
Self-citationAtlantic Hurricane Season of 2008*
Brown, D. P., Beven, J. L., Franklin, J. L., & Blake, E. S. (2010) · Monthly Weather Review · doi:10.1175/2009mwr3174.1 · Cited by 54
Atlantic Hurricane Season of 2006
Franklin, J. L., & Brown, D. P. (2008) · Monthly Weather Review · doi:10.1175/2007mwr2377.1 · Cited by 51
GIS approach to scale issues of perimeter-based shape indices for drainage basins
Bàrdossy, A., & Schmidt, F. (2002) · Hydrological Sciences Journal · doi:10.1080/02626660209493001 · Cited by 51
Yang, T., Chen, X., Xu, C.-Y., & Zhang, Z.-C. (2009) · Stochastic Environmental Research and Risk Assessment · doi:10.1007/s00477-008-0278-7 · Cited by 49
Buma, B., & Livneh, B. (2017) · Environmental Research Letters · doi:10.1088/1748-9326/aa7091 · Cited by 37
Research works printed but not linked: 1
- Sankarasubramanian, A., Vogel, R. M. & Limbrunner, J. F. Climate elasticity of streamflow in the United States. Water Resour. Res. 37, 1771–1781 (2001). · DOI · Paper page
Cited by
Sorted by citations
Adapting western North American forests to climate change and wildfires: 10 common questions
Prichard, S. J., Hessburg, P. F., Hagmann, R. K., Povak, N. A., Dobrowski, S. Z., Hurteau, M. D., Kane, V. R., Keane, R. E., Kobziar, L. N., Kolden, C. A., et al. (2021) · Ecological Applications · doi:10.1002/eap.2433 · Cited by 356
Paul, M. J., LeDuc, S. D., Lassiter, M. G., Moorhead, L. C., Noyes, P. D., & Leibowitz, S. G. (2022) · Water Resources Research · doi:10.1029/2021wr030699 · Cited by 241
Mishra, A. K., Alnahit, A. O., & Campbell, B. J. (2020) · Journal of Hydrology · doi:10.1016/j.jhydrol.2020.125707 · Cited by 203
Tamm Review: Reforestation for resilience in dry western U.S. forests
North, M. P., Stevens, J. T., Greene, D. F., Coppoletta, M., Knapp, E. E., Latimer, A. M., Restaino, C. M., Tompkins, R. E., Welch, K. R., York, R. A., et al. (2018) · Forest Ecology and Management · doi:10.1016/j.foreco.2018.09.007 · Cited by 190
Deforestation, forestation, and water supply
Zhang, M., & Wei, X. (2021) · Science · doi:10.1126/science.abe7821 · Cited by 181
Metadata
- Authors
- Hallema, D. W., Sun, G., Caldwell, P. V., Norman, S. P., Cohen, E. C., Liu, Y., Bladon, K. D., & McNulty, S. G.
- Affiliations
- US Forest Service (US)
- Oregon State University (US)
- Corresponding author
- Hallema, Dennis W.
- Sun, Ge
- ORCID
- Venue
- Nature Communications
- Published
- 2018-04-10
- Volume
- 9
- Issue
- 1
- Pages
- 1307-1307
- ISSN
- 2041-1723 (ISSN-L)
- PMC
- PMC5893570
- OpenAlex
- W2797232962
- Semantic Scholar
- e6a7d997dbf3851364e2e4cfc752463137c24840
- Cited by
- 193
- References
- 52
- Citations by year
- 2026: 17 · 2025: 24 · 2024: 21 · 2023: 27 · 2022: 32 · 2021: 23 · 2020: 27 · 2019: 15 · 2018: 7
- FWCI
- 10.68
- Type
- journal article
- Language
- en
- Open access
- gold
- doi.org
- Locations
- Nature Communications (publishedVersion, cc-by)
- Europe PMC (PubMed Central) (publishedVersion, other-oa)
- PubMed Central (publishedVersion, cc-by)
- PubMed (publishedVersion)
- OSTI OAI (U.S. Department of Energy Office of Scientific and Technical Information) (submittedVersion)
- RePEc: Research Papers in Economics (submittedVersion)
- DOAJ (DOAJ: Directory of Open Access Journals) (submittedVersion, cc-by-sa)
- DOAJ (DOAJ: Directory of Open Access Journals) (submittedVersion)
- Funders
- U.S. Department of Energy (DE-AC05?, -AC05- 06OR23100, DE-AC05- 06OR23100)
- U.S. Department of Agriculture (DE‐AC05‐06OR23100)
- Oak Ridge Associated Universities (DE-AC05-06OR23100)
- Joint Fire Science Program (14-1-06-18)
- Oak Ridge Institute for Science and Education (#DE-AC05-06OR23100)
- U.S. Forest Service
- Southern Research Station
- Topics
- Physical Sciences › Environmental Science › Global and Planetary Change › Fire effects on ecosystems
- Physical Sciences › Environmental Science › Water Science and Technology › Hydrology and Watershed Management Studies
- Physical Sciences › Environmental Science › Water Science and Technology › Water resources management and optimization
- Keywords
- forest fires, burned forest, river discharge, water supply, drinking water, prescribed burning, climate, water resources management, drought, Lower Colorado River Basin, American West
About these checks
Registry, retraction, Cites and statistics results are computed, not judged, with one exception: a printed reference that no index lists is read once by a model before it counts as a citation error. Claims are extracted by a model and kept only when their quote appears verbatim in the text; each cited source is then checked, with a model’s help, for whether it says what the claim relies on. Those verdicts can be wrong — read the claim’s quote and the cited source before relying on one.
A language model drew the claims from the paper on 2026-10-06, under version 3 of the claim definition (model deepseek-v4.1-flash, prompt extract-v3).
A second model labelled each claim on 2026-10-06 (model jev-1.13-20260917, definition revision gold-guideline-v0.2).
Cited sources are checked with a language model’s help (gpt-6-sol).
Statistics and arithmetic are recomputed, not judged.
Confidence bands are shown only for fields calibrated on our annotated test set. None is calibrated yet, so no band is shown.
What counts as a claim ›How we measure confidence ›How we check this ›
Are you an author, or do you see a problem with this page? Request a review
