Cited by 77

The DOI matches its Crossref record; 2 of the 2 references it cites were found in a registry or an index.

ATP-dependent membrane remodeling links EHD1 functions to endocytic recycling

Deo, Raunaq, Kushwah, Manish S., Kamerkar, Sukrut C., Kadam, Nagesh Y., Dar, Srishti, Babu, Kavita, Srivastava, Anand, Pucadyil, Thomas J.·2018·Nature Communications

Abstract

Endocytic and recycling pathways generate cargo-laden transport carriers by membrane fission. Classical dynamins, which generate transport carriers during endocytosis, constrict and cause fission of membrane tubes in response to GTP hydrolysis. Relatively, less is known about the ATP-binding Eps15-homology domain-containing protein1 (EHD1), a dynamin family member that functions at the endocytic-recycling compartment. Here, we show using cross complementation assays in C. elegans that EHD1’s membrane binding and ATP hydrolysis activities are necessary for endocytic recycling. Further, we show that ATP-bound EHD1 forms membrane-active scaffolds that bulge tubular model membranes. ATP hydrolysis promotes scaffold self-assembly, causing the bulge to extend and thin down intermediate regions on the tube. On tubes below 25 nm in radius, such thinning leads to scission. Molecular dynamics simulations corroborate this scission pathway. Deletion of N-terminal residues causes defects in stable scaffolding, scission and endocytic recycling. Thus, ATP hydrolysis-dependent membrane remodeling links EHD1 functions to endocytic recycling.

Overview

The claims and statistics of this paper haven’t been checked yet.

Run the check — free, no account needed. It reads the open-access text and checks the sources it cites.

A few free checks a day · papers already verified open instantly · results are public

Integrity signals

Registry

Crossref · 10.1038/s41467-018-07586-z

Cites

2 of 2 references verified0 citation errors · 0 not checkable

Statistics

Figures

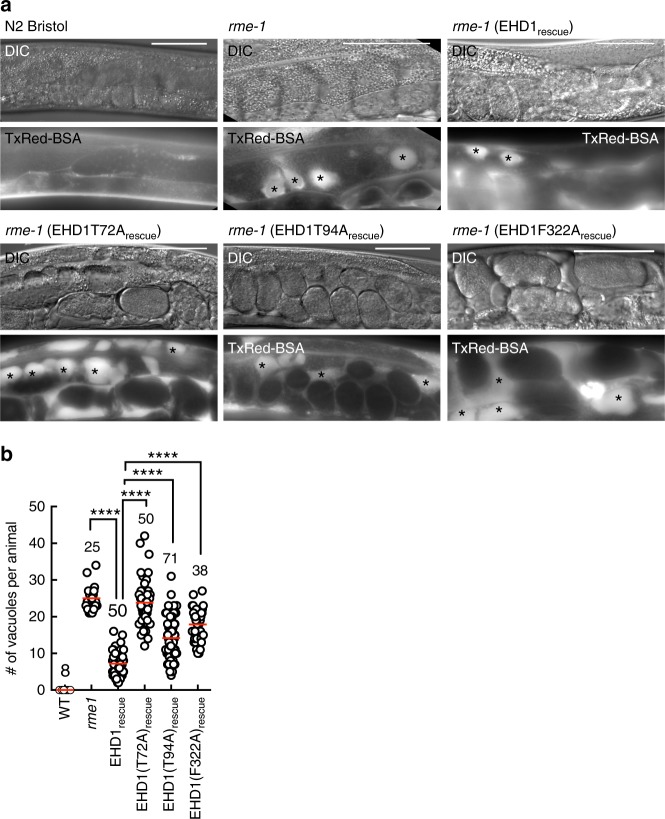
Fig. 1 Functional determinants in EHD1 required for endocytic recycling. a Representative DIC and fluorescence images of worms injected with fluorescent BSA. Asterisks mark vacuoles. Scale bars = 50 μm. b Plot showing vacuole numbers per worm for the indicated numbers of worms. Red line denotes the mean. Statistical significance was assessed using an unpaired two-tailed t-test and ****P < 0.0001
Fig. 1 Functional determinants in EHD1 required for endocytic recycling. a Representative DIC and fluorescence images of worms injected with fluorescent BSA. Asterisks mark vacuoles. Scale bars = 50 μm. b Plot showing vacuole numbers per worm for the indicated numbers of worms. Red line denotes the mean. Statistical significance was assessed using an unpaired two-tailed t-test and ****P < 0.0001CC BY · PubMed Central
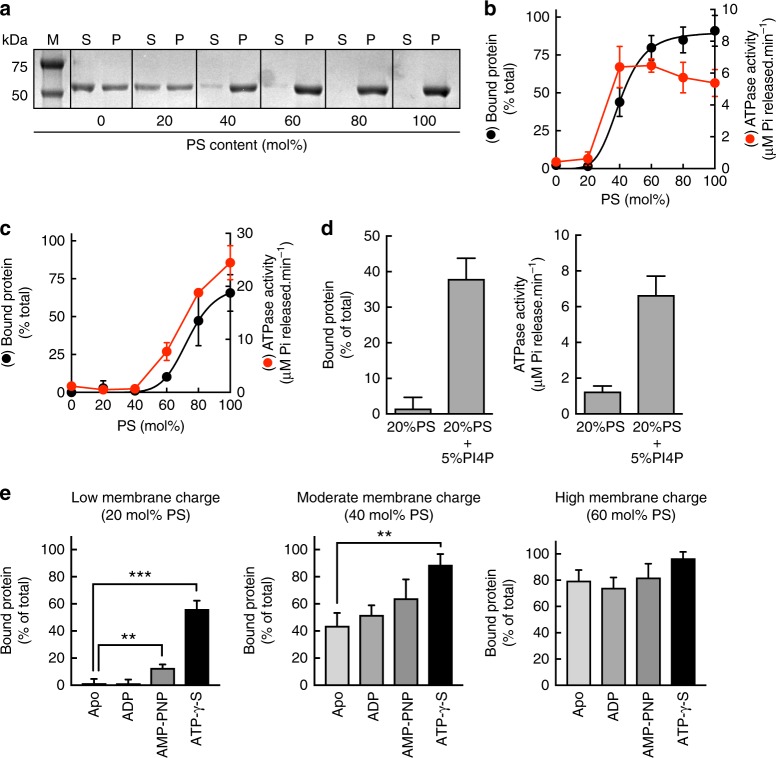
Fig. 2 Membrane binding and ATPase activity of EHD1. a Representative gel showing results from a sedimentation assay with EHD1 added to liposomes of increasing PS content and spun down to separate the supernatant (S) and pellet (P) fractions. M denotes the marker lane. b Bound fraction and ATPase activity of EHD1 with liposomes of increasing PS content. Data represent mean ± SD for N = 3. c Bound fraction and ATPase activity of EHD1(F322A) with liposomes of increasing PS content. Data represent mean ± SD for N = 3. d Bound fraction and ATPase activity of EHD1 on liposomes of the indicated compositions. Data represent mean ± SD for N = 3. e Liposome-bound fraction of EHD1 with increasing PS with different nucleotides (mean ± SD, N = 3 for Apo, N = 3 for ADP, N = 3 for AMP-PNP, N = 5 for ATP-γ-S). Statistical significance was assessed using an unpaired two-tailed t-test and **P = 0.003, ***P = 0.0001
Fig. 2 Membrane binding and ATPase activity of EHD1. a Representative gel showing results from a sedimentation assay with EHD1 added to liposomes of increasing PS content and spun down to separate the supernatant (S) and pellet (P) fractions. M denotes the marker lane. b Bound fraction and ATPase activity of EHD1 with liposomes of increasing PS content. Data represent mean ± SD for N = 3. c Bound fraction and ATPase activity of EHD1(F322A) with liposomes of increasing PS content. Data represent mean ± SD for N = 3. d Bound fraction and ATPase activity of EHD1 on liposomes of the indicated compositions. Data represent mean ± SD for N = 3. e Liposome-bound fraction of EHD1 with increasing PS with different nucleotides (mean ± SD, N = 3 for Apo, N = 3 for ADP, N = 3 for AMP-PNP, N = 5 for ATP-γ-S). Statistical significance was assessed using an unpaired two-tailed t-test and **P = 0.003, ***P = 0.0001CC BY · PubMed Central
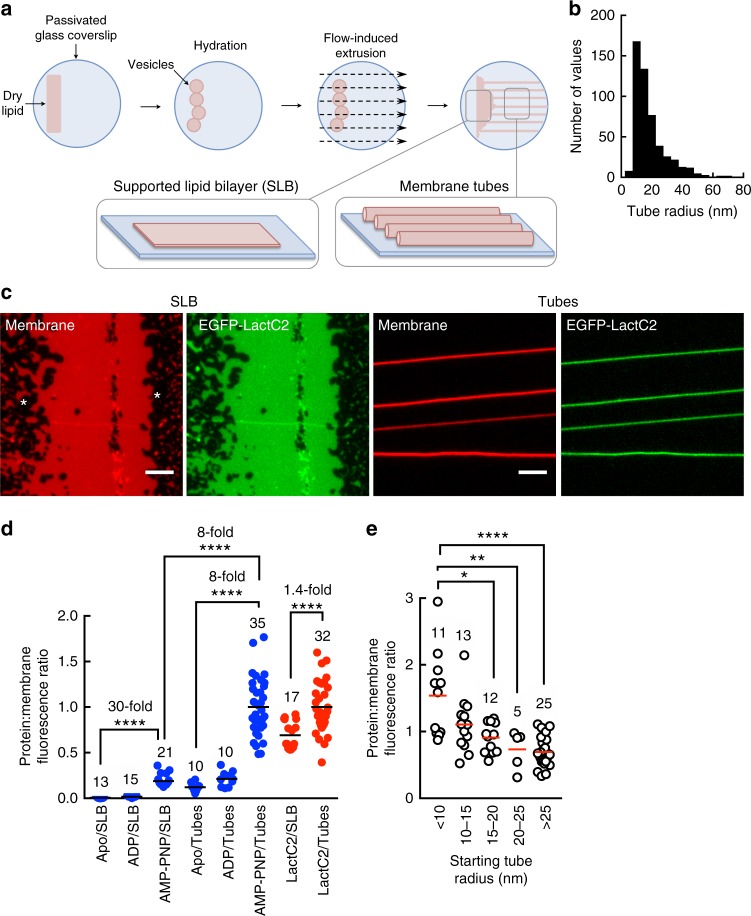
Fig. 3 ATP- and curvature-sensitive membrane binding of EHD1. a Schematic of generation of membrane templates used in the study. b Distribution of tube radii from five independent preparations of templates. c Representative fluorescence micrographs showing distribution of EGFP-LactC2 on SLBs and tubes. Asteriks mark the bare glass surface. Scale bars = 5 μm. d Protein:membrane fluorescence ratios of EHD1-EGFP with various nucleotides (blue) and GFP-LactC2 (red) for the indicated numbers of tubes and SLBs sampled. Black lines denote means. Statistical significance was assessed using Mann–Whitney test and ****P < 0.0001. e Protein:membrane fluorescence ratios of AMP-PNP-bound EHD1-EGFP on tubes of varying starting sizes for the indicated numbers of tubes. Red lines denote means. Statistical significance was assessed using Mann–Whitney’s two-tailed test and *P = 0.010, **P = 0.005, ****P < 0.0001
Fig. 3 ATP- and curvature-sensitive membrane binding of EHD1. a Schematic of generation of membrane templates used in the study. b Distribution of tube radii from five independent preparations of templates. c Representative fluorescence micrographs showing distribution of EGFP-LactC2 on SLBs and tubes. Asteriks mark the bare glass surface. Scale bars = 5 μm. d Protein:membrane fluorescence ratios of EHD1-EGFP with various nucleotides (blue) and GFP-LactC2 (red) for the indicated numbers of tubes and SLBs sampled. Black lines denote means. Statistical significance was assessed using Mann–Whitney test and ****P < 0.0001. e Protein:membrane fluorescence ratios of AMP-PNP-bound EHD1-EGFP on tubes of varying starting sizes for the indicated numbers of tubes. Red lines denote means. Statistical significance was assessed using Mann–Whitney’s two-tailed test and *P = 0.010, **P = 0.005, ****P < 0.0001CC BY · PubMed Central
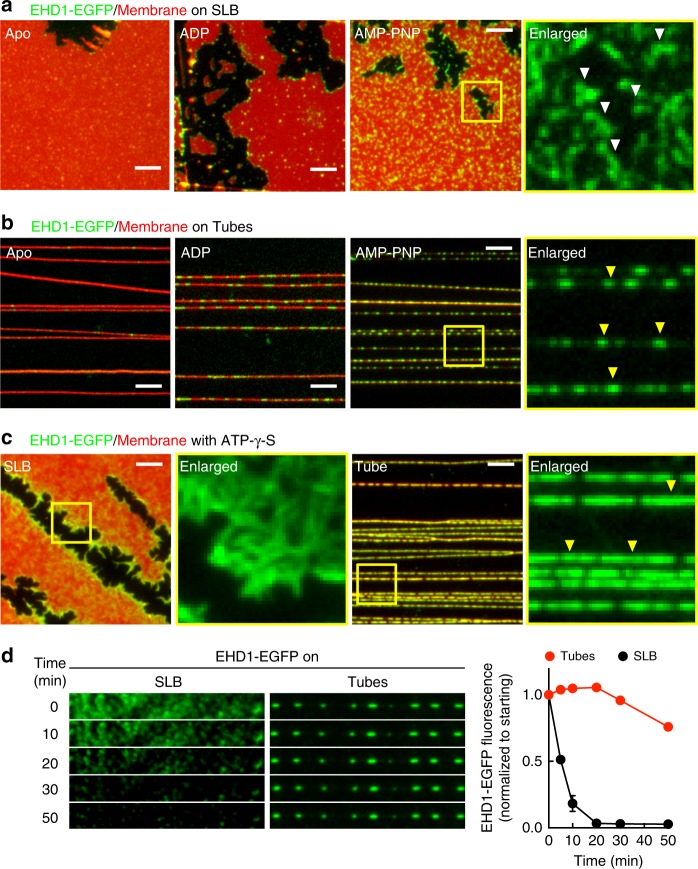
Fig. 4 EHD1 distribution and dynamics on membranes. Representative fluorescence micrographs showing the distribution of EHD1-EGFP in the Apo, ADP-bound, and AMP-PNP-bound states on SLBs (a) and tubes (b). White and yellow arrowheads mark oligomers of EHD1-EGFP on the SLB and tubes, respectively. Scale bars = 5 μm. c Representative fluorescence micrographs showing the distribution of EHD1-EGFP with ATP-γ-S on the SLB and tubes. Yellow arrowheads mark oligomers of EHD1-EGFP on the tubes. Scale bars = 5 μm. d Representative fluorescence micrographs showing the effect of ATP addition to EHD1-EGFP assembled with ATP-γ-S on the SLB and tubes. Plot shows quantitation of fluorescence intensities of EHD1-EGFP on the SLB and tubes. Data represent mean ± SD of n = 3 ROIs on the SLB and tubes
Fig. 4 EHD1 distribution and dynamics on membranes. Representative fluorescence micrographs showing the distribution of EHD1-EGFP in the Apo, ADP-bound, and AMP-PNP-bound states on SLBs (a) and tubes (b). White and yellow arrowheads mark oligomers of EHD1-EGFP on the SLB and tubes, respectively. Scale bars = 5 μm. c Representative fluorescence micrographs showing the distribution of EHD1-EGFP with ATP-γ-S on the SLB and tubes. Yellow arrowheads mark oligomers of EHD1-EGFP on the tubes. Scale bars = 5 μm. d Representative fluorescence micrographs showing the effect of ATP addition to EHD1-EGFP assembled with ATP-γ-S on the SLB and tubes. Plot shows quantitation of fluorescence intensities of EHD1-EGFP on the SLB and tubes. Data represent mean ± SD of n = 3 ROIs on the SLB and tubesCC BY · PubMed Central
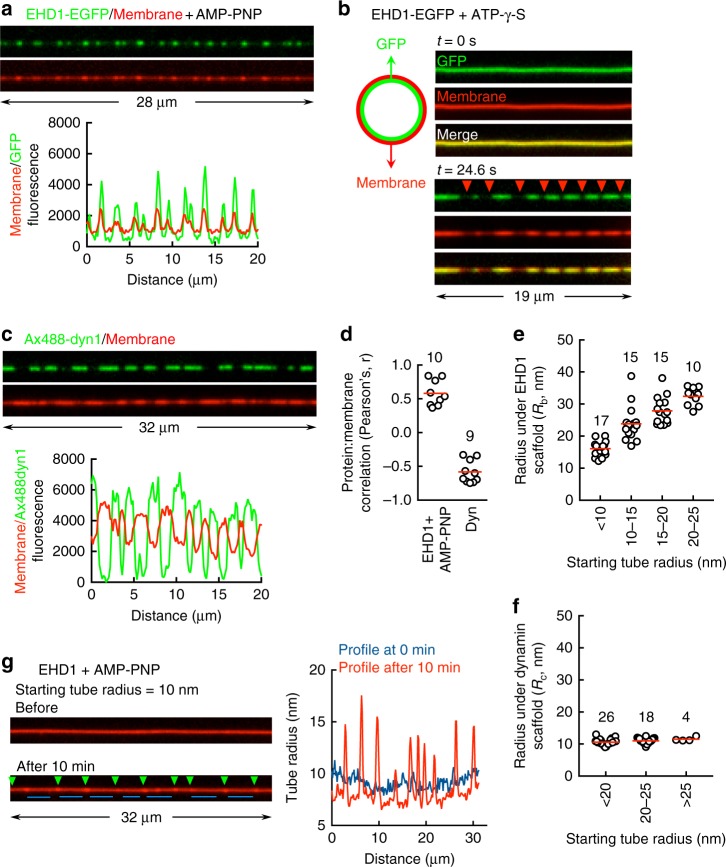
Fig. 5 Membrane remodeling by EHD1. a Representative images and fluorescence line profiles of tubes showing scaffolds of AMP-PNP-bound EHD1-EGFP. b Representative images showing coincidence between GFP and membrane fluorescence in response to formation of extended EHD1 scaffolds with ATP-γ-S. Red arrowheads mark sites of tube thinning. c Representative images and fluorescence line profiles of tubes showing Alexa488-labeled dynamin1 scaffolds. d Pearson’s correlation between protein and membrane fluorescence for the indicated numbers of tubes. Red lines denote means. e Bulged tube radius (Rb) under AMP-PNP-bound EHD1 scaffolds as a function of the starting tube radius for the indicated numbers of tubes. Red lines denote means. f Constricted tube radius (Rc) under dynamin scaffolds as a function of the starting tube radius for the indicated numbers of tubes. Red line denotes means. g Representative images and associated line profiles acquired in the membrane channel showing remodeling of a tube by AMP-PNP-bound EHD1 scaffolds. Green arrowheads mark bulged regions and blue lines mark thinned-down regions on the tube
Fig. 5 Membrane remodeling by EHD1. a Representative images and fluorescence line profiles of tubes showing scaffolds of AMP-PNP-bound EHD1-EGFP. b Representative images showing coincidence between GFP and membrane fluorescence in response to formation of extended EHD1 scaffolds with ATP-γ-S. Red arrowheads mark sites of tube thinning. c Representative images and fluorescence line profiles of tubes showing Alexa488-labeled dynamin1 scaffolds. d Pearson’s correlation between protein and membrane fluorescence for the indicated numbers of tubes. Red lines denote means. e Bulged tube radius (Rb) under AMP-PNP-bound EHD1 scaffolds as a function of the starting tube radius for the indicated numbers of tubes. Red lines denote means. f Constricted tube radius (Rc) under dynamin scaffolds as a function of the starting tube radius for the indicated numbers of tubes. Red line denotes means. g Representative images and associated line profiles acquired in the membrane channel showing remodeling of a tube by AMP-PNP-bound EHD1 scaffolds. Green arrowheads mark bulged regions and blue lines mark thinned-down regions on the tubeCC BY · PubMed Central
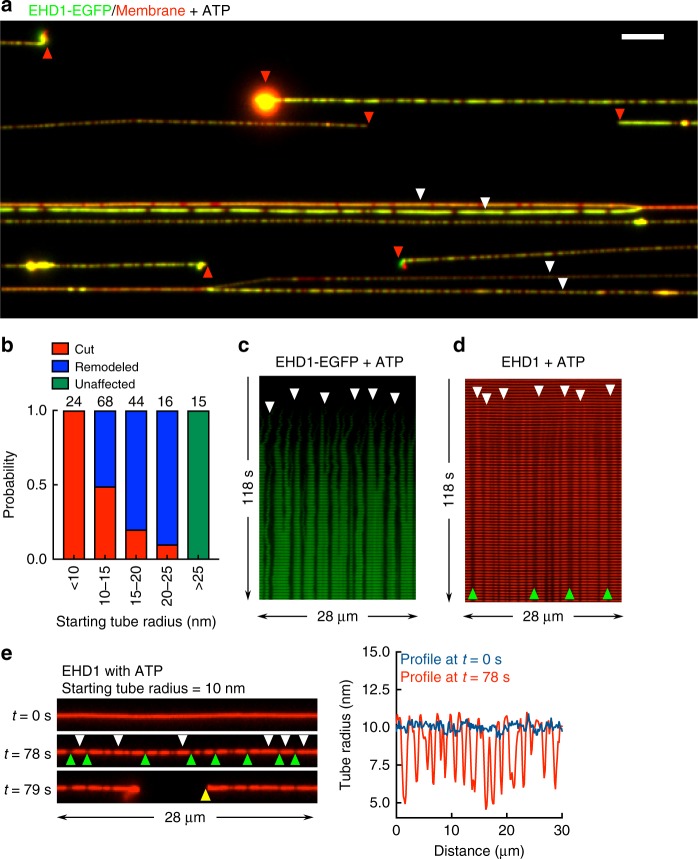
Fig. 6 Membrane fission induced by ATP hydrolysis. a Representative fluorescence micrograph after 5 min of adding EHD1-EGFP with ATP to templates (see Supplementary Movie 1). Red arrowheads mark cut ends of tubes and white arrowheads mark tubes that remain uncut. Scale bar = 10 μm. b Tube remodeling and fission probability as a function of starting tube radius for the indicated numbers of tubes. c Representative montage of tube images acquired in the GFP channel showing the nucleation (white arrowheads) and growth of EHD1-EGFP scaffolds in presence of ATP (see Supplementary Movie 3). d Representative montage of tube images acquired in the membrane channel showing the expansion of bulges (white arrowheads). White arrowheads mark the site of onset of bulging and green arrowheads mark sites of tube thinning. e Frames and associated line profiles from a representative movie acquired in the membrane channel showing the bulged (white arrowheads) and thinned-down (green arrowheads) sites on a tube, before fission (yellow arrowheads)
Fig. 6 Membrane fission induced by ATP hydrolysis. a Representative fluorescence micrograph after 5 min of adding EHD1-EGFP with ATP to templates (see Supplementary Movie 1). Red arrowheads mark cut ends of tubes and white arrowheads mark tubes that remain uncut. Scale bar = 10 μm. b Tube remodeling and fission probability as a function of starting tube radius for the indicated numbers of tubes. c Representative montage of tube images acquired in the GFP channel showing the nucleation (white arrowheads) and growth of EHD1-EGFP scaffolds in presence of ATP (see Supplementary Movie 3). d Representative montage of tube images acquired in the membrane channel showing the expansion of bulges (white arrowheads). White arrowheads mark the site of onset of bulging and green arrowheads mark sites of tube thinning. e Frames and associated line profiles from a representative movie acquired in the membrane channel showing the bulged (white arrowheads) and thinned-down (green arrowheads) sites on a tube, before fission (yellow arrowheads)CC BY · PubMed Central
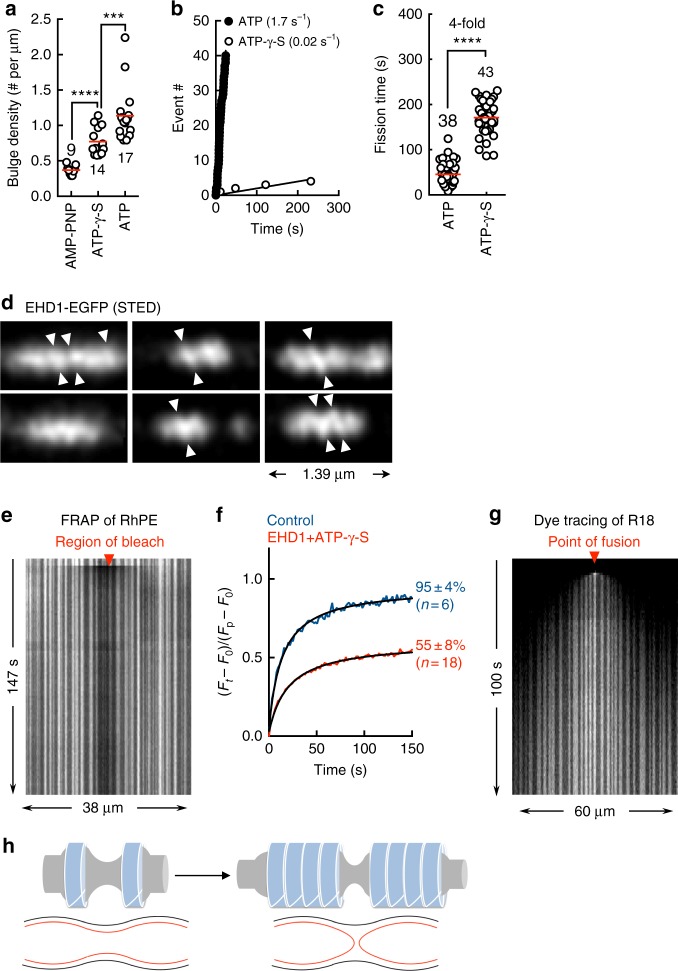
Fig. 7 Intermediates in the membrane-remodeling pathway. a Bulge density per unit length of the tube upon addition of EHD1 with AMP-PNP, ATP-γ-S and ATP for the indicated numbers of tubes. Red line denotes the mean. Statistical significance was assessed using Mann–Whitney’s two-tailed test and ***P < 0.005, ****P < 0.0001. b Plot showing cumulative cuts seen as a function of time (fission rate) upon adding EHD1 with ATP or ATP-γ-S to a collection of tubes. c Plot showing the time interval between membrane bulging and scission (fission time) upon adding EHD1 with ATP or ATP-γ-S to tubes for the indicated numbers of events. Red line denotes the mean. Statistical significance was assessed using Mann–Whitney’s two-tailed test and ****P < 0.0001. d STED microscopic images of EHD1-EGFP scaffolds with ATP-γ-S. White arrowheads mark the possible orientation of helical rungs. e Representative kymograph showing FRAP of an RhPE-containing tube displaying EHD1 scaffolds with ATP-γ-S. f Fluorescence recovery kinetics of RhPE for the indicated conditions. Numbers represent mobile fraction (mean ± SD for n(tubes) as indicated). g Representative kymograph showing fusion and spreading of R18 on a tube displaying EHD1 scaffolds with ATP-γ-S. h Schematic showing growth-induced tube thinning leading to the formation of a hemifused intermediate. Black and red lines depict the outer and inner monolayers, respectively of the tube
Fig. 7 Intermediates in the membrane-remodeling pathway. a Bulge density per unit length of the tube upon addition of EHD1 with AMP-PNP, ATP-γ-S and ATP for the indicated numbers of tubes. Red line denotes the mean. Statistical significance was assessed using Mann–Whitney’s two-tailed test and ***P < 0.005, ****P < 0.0001. b Plot showing cumulative cuts seen as a function of time (fission rate) upon adding EHD1 with ATP or ATP-γ-S to a collection of tubes. c Plot showing the time interval between membrane bulging and scission (fission time) upon adding EHD1 with ATP or ATP-γ-S to tubes for the indicated numbers of events. Red line denotes the mean. Statistical significance was assessed using Mann–Whitney’s two-tailed test and ****P < 0.0001. d STED microscopic images of EHD1-EGFP scaffolds with ATP-γ-S. White arrowheads mark the possible orientation of helical rungs. e Representative kymograph showing FRAP of an RhPE-containing tube displaying EHD1 scaffolds with ATP-γ-S. f Fluorescence recovery kinetics of RhPE for the indicated conditions. Numbers represent mobile fraction (mean ± SD for n(tubes) as indicated). g Representative kymograph showing fusion and spreading of R18 on a tube displaying EHD1 scaffolds with ATP-γ-S. h Schematic showing growth-induced tube thinning leading to the formation of a hemifused intermediate. Black and red lines depict the outer and inner monolayers, respectively of the tubeCC BY · PubMed Central
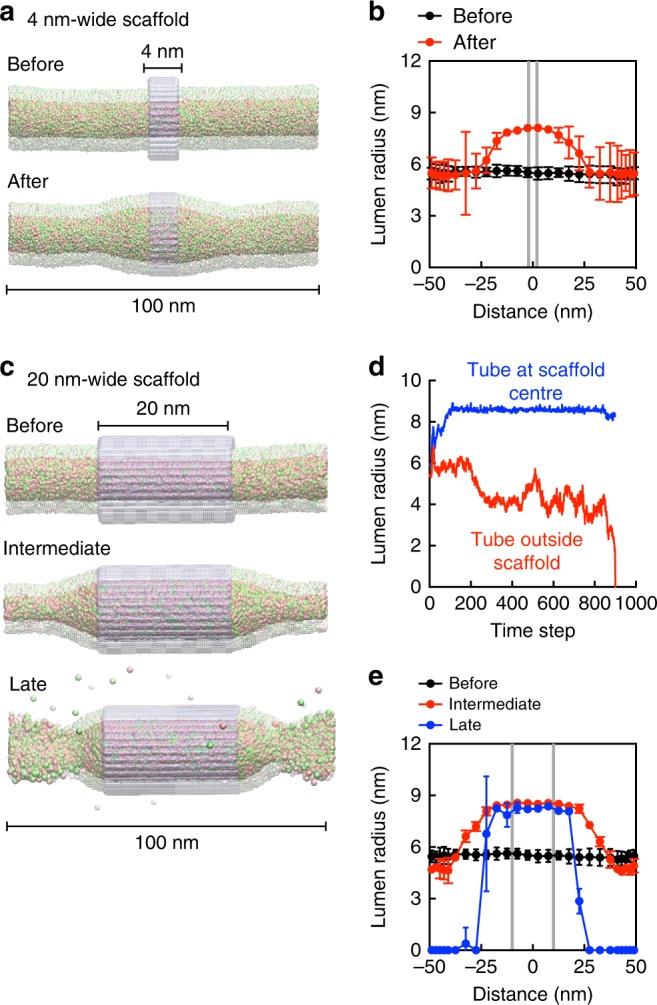
Fig. 8 Molecular dynamics simulations of scaffold-induced tube bulging and fission. a Frames from simulations of a 4 nm-long scaffold (magenta) on a 100 nm-long membrane tube. Cream and green spheres represent headgroups of DOPS and DOPC lipids, respectively. Light and dark spheres represent headgroups of lipids on the outer and inner leaflet, respectively. Only lipid head groups are shown for clarity (see Supplementary Movie 4). b Lumen radius along the tube length upon placement of a 4 nm-long scaffold. Data represent the mean with variance. Gray lines represent scaffold boundaries. c Frames from simulations of a 20 nm-long scaffold on a 100 nm-long membrane tube. Cream and green spheres represent headgroups of DOPS and DOPC lipids, respectively. Light and dark spheres represent headgroups of lipids on the outer and inner leaflet, respectively. Only lipid head groups are shown for clarity (see Supplementary Movie 5). d Evolution of lumen radius at the middle (blue) and at the site of maximum thinning (red) after placement of a 20 nm-long scaffold. X-axis is in units of 10,000 τ, where τ is a CG time step. e Lumen radius along the tube length upon placement of a 20 nm-long scaffold. Data represent the mean with variance. Gray lines represent scaffold boundaries
Fig. 8 Molecular dynamics simulations of scaffold-induced tube bulging and fission. a Frames from simulations of a 4 nm-long scaffold (magenta) on a 100 nm-long membrane tube. Cream and green spheres represent headgroups of DOPS and DOPC lipids, respectively. Light and dark spheres represent headgroups of lipids on the outer and inner leaflet, respectively. Only lipid head groups are shown for clarity (see Supplementary Movie 4). b Lumen radius along the tube length upon placement of a 4 nm-long scaffold. Data represent the mean with variance. Gray lines represent scaffold boundaries. c Frames from simulations of a 20 nm-long scaffold on a 100 nm-long membrane tube. Cream and green spheres represent headgroups of DOPS and DOPC lipids, respectively. Light and dark spheres represent headgroups of lipids on the outer and inner leaflet, respectively. Only lipid head groups are shown for clarity (see Supplementary Movie 5). d Evolution of lumen radius at the middle (blue) and at the site of maximum thinning (red) after placement of a 20 nm-long scaffold. X-axis is in units of 10,000 τ, where τ is a CG time step. e Lumen radius along the tube length upon placement of a 20 nm-long scaffold. Data represent the mean with variance. Gray lines represent scaffold boundariesCC BY · PubMed Central
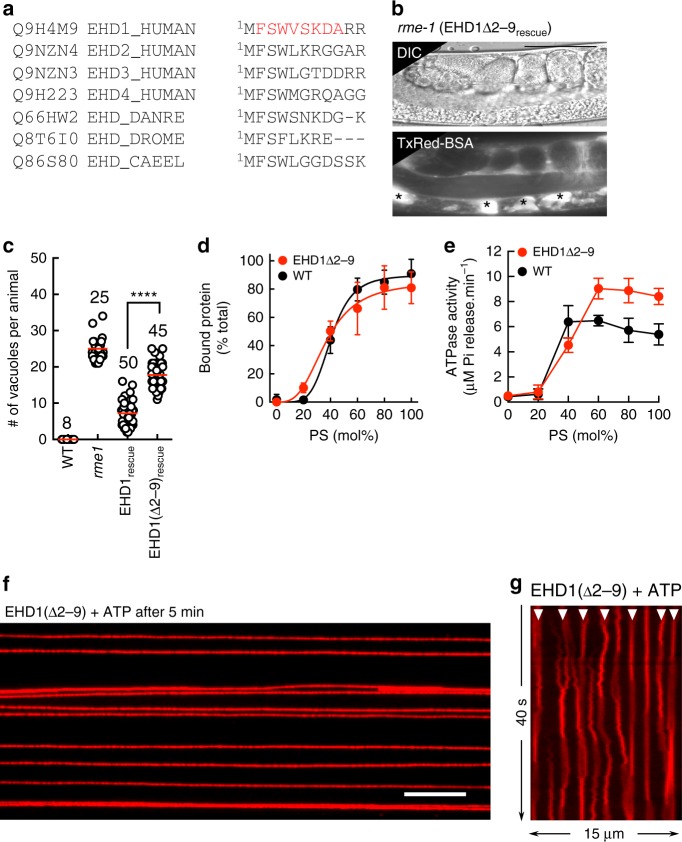
Fig. 9 N-terminal residues are critical for EHD1 function. a Alignment of the N-terminal region in EHD proteins. b Representative DIC and fluorescence images of worms injected with fluorescent BSA. Asterisks mark vacuoles. Scale bar = 50 μm. c Plot showing vacuole numbers per worm for the indicated numbers of worms. Red line denotes mean. Data for WT, rme-1 and EHD1rescue are shown for comparison. Statistical significance was assessed using an unpaired two-tailed t-test and ****P < 0.0001. d Bound fraction of EHD1(Δ2–9) with liposomes of increasing PS content (mean ± SD, n = 3). Data for WT is shown for comparison. e ATPase activity of EHD1(Δ2–9) with liposomes of increasing PS content (mean ± SD, n = 3). Data for WT is shown for comparison. f Representative micrograph showing EHD1(Δ2–9) added to templates with ATP after 5 min (see Supplementary Movie 6). Scale bar = 10 μm. g Representative kymograph of tube images acquired in the membrane fluorescence channel showing the formation and dissolution of membrane bulges (white arrowheads)
Fig. 9 N-terminal residues are critical for EHD1 function. a Alignment of the N-terminal region in EHD proteins. b Representative DIC and fluorescence images of worms injected with fluorescent BSA. Asterisks mark vacuoles. Scale bar = 50 μm. c Plot showing vacuole numbers per worm for the indicated numbers of worms. Red line denotes mean. Data for WT, rme-1 and EHD1rescue are shown for comparison. Statistical significance was assessed using an unpaired two-tailed t-test and ****P < 0.0001. d Bound fraction of EHD1(Δ2–9) with liposomes of increasing PS content (mean ± SD, n = 3). Data for WT is shown for comparison. e ATPase activity of EHD1(Δ2–9) with liposomes of increasing PS content (mean ± SD, n = 3). Data for WT is shown for comparison. f Representative micrograph showing EHD1(Δ2–9) added to templates with ATP after 5 min (see Supplementary Movie 6). Scale bar = 10 μm. g Representative kymograph of tube images acquired in the membrane fluorescence channel showing the formation and dissolution of membrane bulges (white arrowheads)CC BY · PubMed Central
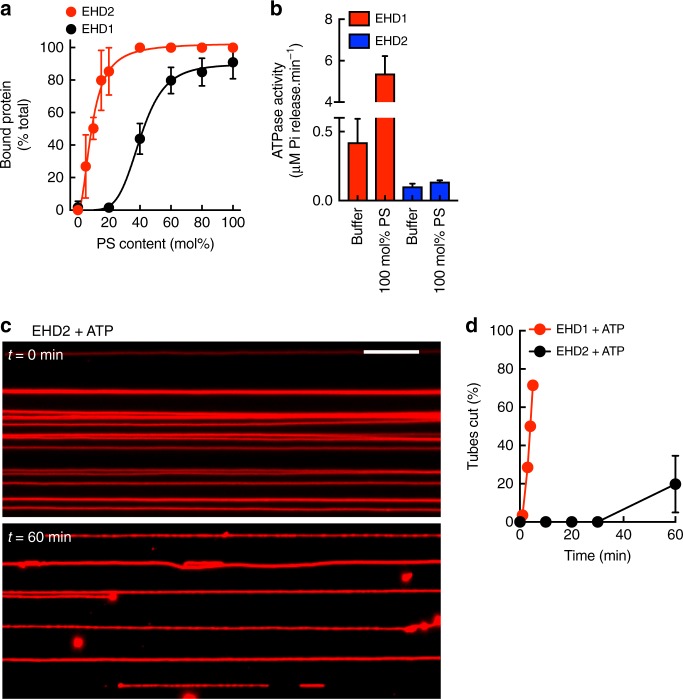
Fig. 10 Functional differences between EHD2 and EHD1. a Bound fraction of EHD2 with liposomes of increasing PS content (mean ± SD, N = 3). Data for EHD1 are shown for comparison. b ATPase activity of EHD2 with and without PS liposomes (mean ± SD, N = 3). Data for EHD1 are shown for comparison. c Frames from representative movie showing EHD2 added to templates with ATP acquired at the indicated time periods. Scale bar = 10 μm. d Plot showing the number of tubes cut (as percentage of the total tubes analyzed) with the indicated proteins. Data represent the mean ± SD
Fig. 10 Functional differences between EHD2 and EHD1. a Bound fraction of EHD2 with liposomes of increasing PS content (mean ± SD, N = 3). Data for EHD1 are shown for comparison. b ATPase activity of EHD2 with and without PS liposomes (mean ± SD, N = 3). Data for EHD1 are shown for comparison. c Frames from representative movie showing EHD2 added to templates with ATP acquired at the indicated time periods. Scale bar = 10 μm. d Plot showing the number of tubes cut (as percentage of the total tubes analyzed) with the indicated proteins. Data represent the mean ± SDCC BY · PubMed Central

Verification

Claims the paper makes

The claims and statistics of this paper haven’t been checked yet.

Run the check — free, no account needed. It reads the open-access text and checks the sources it cites.

A few free checks a day · papers already verified open instantly · results are public

Claims other papers make about this one

Each is checked against this paper’s own text: does it say what the citing paper says it does?

Self-check

Percentages, sums and reported differences re-computed from the paper’s own numbers.

The self-check needs the paper’s full text.

Citations

Cites

Show all 2 references

Research works printed but not linked: 68

  1. Bonifacino, J. S. & Rojas, R. Retrograde transport from endosomes to the trans-Golgi network. Nat. Rev. Mol. Cell Biol. 7, 568–579 (2006). · DOI
  2. Grant, B. D. & Donaldson, J. G. Pathways and mechanisms of endocytic recycling. Nat. Rev. Mol. Cell Biol. 10, 597–608 (2009). · DOI · Paper page
  3. Maxfield, F. R. & McGraw, T. E. Endocytic recycling. Nat. Rev. Mol. Cell Biol. 5, 121–132 (2004). · DOI · Paper page
  4. Caplan, S. et al. A tubular EHD1-containing compartment involved in the recycling of major histocompatibility complex class I molecules to the plasma membrane. EMBO J. 21, 2557–2567 (2002). · DOI · Paper page
  5. Grant, B. D. & Caplan, S. Mechanisms of EHD/RME-1 protein function in endocytic transport. Traffic 9, 2043–2052 (2008). · DOI · Paper page
  6. Lin, S. X., Grant, B., Hirsh, D. & Maxfield, F. R. Rme-1 regulates the distribution and function of the endocytic recycling compartment in mammalian cells. Nat. Cell Biol. 3, 567–572 (2001). · DOI · Paper page
  7. Blume, J. J., Halbach, A., Behrendt, D., Paulsson, M. & Plomann, M. EHD proteins are associated with tubular and vesicular compartments and interact with specific phospholipids. Exp. Cell Res. 313, 219–231 (2007). · DOI
  8. Daumke, O. et al. Architectural and mechanistic insights into an EHD ATPase involved in membrane remodelling. Nature 449, 923–927 (2007). · DOI · Paper page
  9. Sharma, M., Naslavsky, N. & Caplan, S. A role for EHD4 in the regulation of early endosomal transport. Traffic 9, 995–1018 (2008). · DOI · Paper page
  10. Grant, B. et al. Evidence that RME-1, a conserved C. elegans EH-domain protein, functions in endocytic recycling. Nat. Cell Biol. 3, 573–579 (2001). · DOI
  11. Olswang-Kutz, Y. et al. Drosophila Past1 is involved in endocytosis and is required for germline development and survival of the adult fly. J. Cell Sci. 122, 471–480 (2009). · DOI
  12. Rainey, M. A. et al. The endocytic recycling regulator EHD1 is essential for spermatogenesis and male fertility in mice. BMC Dev. Biol. 10, 1 (2010). · DOI · Paper page
  13. Lu, Q. et al. Early steps in primary cilium assembly require EHD1/EHD3-dependent ciliary vesicle formation. Nat. Cell Biol. 17, 531–531 (2015). · DOI
  14. Cai, B. et al. Differential roles of C-terminal Eps15 homology domain proteins as vesiculators and tubulators of recycling endosomes. J. Biol. Chem. 288, 30172–30180 (2013). · DOI
  15. Lee, S. et al. Transport through recycling endosomes requires EHD1 recruitment by a phosphatidylserine translocase. EMBO J. 34, 669–688 (2015). · DOI
  16. Cai, B., Caplan, S. & Naslavsky, N. cPLA2α and EHD1 interact and regulate the vesiculation of cholesterol-rich, GPI-anchored, protein-containing endosomes. Mol. Biol. Cell 23, 1874–1888 (2012). · DOI · Paper page
  17. Pant, S. et al. AMPH-1/Amphiphysin/Bin1 functions with RME-1/Ehd1 in endocytic recycling. Nat. Cell Biol. 11, 1399–1410 (2009). · DOI · Paper page
  18. Rapaport, D. et al. Recycling to the plasma membrane is delayed in EHD1 knockout mice. Traffic 7, 52–60 (2006). · DOI · Paper page
  19. George, M. et al. Shared as well as distinct roles of EHD proteins revealed by biochemical and functional comparisons in mammalian cells and C. elegans. BMC Cell Biol. 8, 3 (2007). · DOI · Paper page
  20. Giridharan, S. S. P., Cai, B., Vitale, N., Naslavsky, N. & Caplan, S. Cooperation of MICAL-L1, syndapin2, and phosphatidic acid in tubular recycling endosome biogenesis. Mol. Biol. Cell 24, 1776–1790 (2013). · DOI
  21. Jović, M., Kieken, F., Naslavsky, N., Sorgen, P. L. & Caplan, S. Eps15 homology domain 1-associated tubules contain phosphatidylinositol-4-phosphate and phosphatidylinositol-(4,5)-bisphosphate and are required for efficient recycling. Mol. Biol. Cell 20, 2731–2743 (2009). · DOI · Paper page
  22. Simone, L. C., Caplan, S. & Naslavsky, N. Role of Phosphatidylinositol 4,5-Bisphosphate in regulating EHD2 plasma membrane localization. PLoS ONE 8, e74519 (2013). · DOI
  23. Ramachandran, R. & Schmid, S. L. Real-time detection reveals that effectors couple dynamin’s GTP-dependent conformational changes to the membrane. EMBO J. 27, 27–37 (2007). · DOI
  24. Stowell, M., Marks, B., Wigge, P. & McMahon, H. T. Nucleotide-dependent conformational changes in dynamin: evidence for a mechanochemical molecular spring. Nat. Cell Biol. 1, 27–32 (1999). · DOI
  25. Hoernke, M. et al. EHD2 restrains dynamics of caveolae by an ATP-dependent, membrane-bound, open conformation. Proc. Natl Acad. Sci. USA https://doi.org/10.1073/pnas.1614066114 (2017). · DOI
  26. Dar, S., Kamerkar, S. C. & Pucadyil, T. J. A high-throughput platform for real-time analysis of membrane fission reactions reveals dynamin function. Nat. Cell Biol. 17, 1588–1596 (2015). · DOI
  27. Dar, S., Kamerkar, S. C. & Pucadyil, T. J. Use of the supported membrane tube assay system for real-time analysis of membrane fission reactions. Nat. Protoc. 12, 390–400 (2017). · DOI
  28. Xie, S. et al. The endocytic recycling compartment maintains cargo segregation acquired upon exit from the sorting endosome. Mol. Biol. Cell 27, 108–126 (2016). · DOI
  29. Yeung, T. et al. Membrane phosphatidylserine regulates surface charge and protein localization. Science 319, 210–213 (2008). · DOI
  30. Lee, D.-W. et al. ATP binding regulates oligomerization and endosome association of RME-1 family proteins. J. Biol. Chem. 280, 17213–17220 (2005). · DOI
  31. Kunding, A. H., Mortensen, M. W., Christensen, S. M. & Stamou, D. A fluorescence-based technique to construct size distributions from single-object measurements: application to the extrusion of lipid vesicles. Biophys. J. 95, 1176–1188 (2008). · DOI
  32. Roux, A. et al. Membrane curvature controls dynamin polymerization. Proc. Natl Acad. Sci. USA 107, 4141–4146 (2010). · DOI
  33. Shnyrova, A. V. et al. Geometric catalysis of membrane fission driven by flexible dynamin rings. Science 339, 1433–1436 (2013). · DOI
  34. Chappie, J. S. et al. A pseudoatomic model of the dynamin polymer identifies a hydrolysis-dependent powerstroke. Cell 147, 209–222 (2011). · DOI
  35. Shah, C. et al. Structural insights into membrane interaction and caveolar targeting of dynamin-like EHD2. Structure 22, 409–420 (2014). · DOI
  36. Zhao, H. et al. Membrane-sculpting BAR domains generate stable lipid microdomains. Cell Rep. 4, 1213–1223 (2013). · DOI
  37. Simunovic, M. et al. Friction mediates scission of tubular membranes scaffolded by BAR proteins. Cell 170, 172–184 (2017). e11. · DOI
  38. Kozlovsky, Y. & Kozlov, M. M. Membrane fission: model for intermediate structures. Biophys. J. 85, 85–96 (2003). · DOI
  39. Frolov, V. A., Escalada, A., Akimov, S. A. & Shnyrova, A. V. Geometry of membrane fission. Chem. Phys. Lipids 185, 129–140 (2015). · DOI
  40. Melikyan, G. B., Deriy, B. N., Ok, D. C. & Cohen, F. S. Voltage-dependent translocation of R18 and DiI across lipid bilayers leads to fluorescence changes. Biophys. J. 71, 2680–2691 (1996). · DOI
  41. Mattila, J.-P. et al. A hemi-fission intermediate links two mechanistically distinct stages of membrane fission. Nature 524, 109–113 (2015). · DOI
  42. Melo, A. A. et al. Structural insights into the activation mechanism of dynamin-like EHD ATPases. Proc. Natl Acad. Sci. USA 114, 5629–5634 (2017). · DOI
  43. Daumke, O., Roux, A. & Haucke, V. BAR domain scaffolds in dynamin-mediated membrane fission. Cell 156, 882–892 (2014). · DOI
  44. McMahon, H. T. & Gallop, J. L. Membrane curvature and mechanisms of dynamic cell membrane remodelling. Nat. Cell Biol. 438, 590–596 (2005).
  45. Jarsch, I. K., Daste, F. & Gallop, J. L. Membrane curvature in cell biology: an integration of molecular mechanisms. J. Cell Biol. 214, 375–387 (2016). · DOI
  46. Chappie, J. S., Acharya, S., Leonard, M., Schmid, S. L. & Dyda, F. G domain dimerization controls dynamin’s assembly-stimulated GTPase activity. Nature 465, 435–440 (2010). · DOI
  47. Carr, J. F. & Hinshaw, J. E. Dynamin assembles into spirals under physiological salt conditions upon the addition of GDP and gamma-phosphate analogues. J. Biol. Chem. 272, 28030–28035 (1997). · DOI
  48. Stoeber, M. et al. Oligomers of the ATPase EHD2 confine caveolae to the plasma membrane through association with actin. EMBO J. 31, 2350–2364 (2012). · DOI
  49. Yeow, I. et al. EHD proteins cooperate to generate caveolar clusters and to maintain caveolae during repeated mechanical stress. Curr. Biol. 27, 2951–2962 (2017). · DOI
  50. Braun, A. et al. EHD proteins associate with syndapin I and II and such interactions play a crucial role in endosomal recycling. Mol. Biol. Cell 16, 3642–3658 (2005). · DOI · Paper page
  51. Delevoye, C. et al. Recycling endosome tubule morphogenesis from sorting endosomes requires the kinesin motor KIF13A. Cell Rep. 6, 445–454 (2014). · DOI
  52. Hopkins, C. R. Intracellular routing of transferrin and transferrin receptors in epidermoid carcinoma A431 cells. Cell 35, 321–330 (1983). · DOI
  53. Yamashiro, D. J., Tycko, B., Fluss, S. R. & Maxfield, F. R. Segregation of transferrin to a mildly acidic (pH 6.5) para-Golgi compartment in the recycling pathway. Cell 37, 789–800 (1984). · DOI
  54. Antonny, B. et al. Membrane fission by dynamin: what we know and what we need to know. EMBO J. 35, 2270–2284 (2016). · DOI
  55. Brenner, S. The genetics of Caenorhabditis elegans. Genetics 77, 71–94 (1974). · DOI
  56. Mello, C. & Fire, A. DNA transformation. Methods Cell Biol. 48, 451–482 (1995). · DOI
  57. Baykov, A. A., Evtushenko, O. A. & Avaeva, S. M. A malachite green procedure for orthophosphate determination and its use in alkaline phosphatase-based enzyme immunoassay. Anal. Biochem. 171, 266–270 (1988). · DOI
  58. Dar, S. & Pucadyil, T. J. The pleckstrin-homology domain of dynamin is dispensable for membrane constriction and fission. Mol. Biol. Cell 28, 152–160 (2017). · DOI
  59. Yguerabide, J., Schmidt, J. A. & Yguerabide, E. E. Lateral mobility in membranes as detected by fluorescence recovery after photobleaching. Biophys. J. 40, 69–75 (1982). · DOI
  60. Schindelin, J. et al. Fiji: an open-source platform for biological-image analysis. Nat. Methods 9, 676–682 (2012). · DOI · Paper page
  61. Srivastava, A. & Voth, G. A. Hybrid approach for highly coarse-grained lipid bilayer models. J. Chem. Theory Comput. 9, 750–765 (2012). · DOI
  62. Simunovic, M., Srivastava, A. & Voth, G. A. Linear aggregation of proteins on the membrane as a prelude to membrane remodeling. Proc. Natl Acad. Sci. USA 110, 20396–20401 (2013). · DOI
  63. Simunovic, M. & Voth, G. A. Membrane tension controls the assembly of curvature-generating proteins. Nat. Commun. 6, 7219 (2015). · DOI
  64. Izvekov, S. & Voth, G. A. A multiscale coarse-graining method for biomolecular systems. J. Phys. Chem. B 109, 2469–2473 (2005). · DOI
  65. Noid, W. G. et al. The multiscale coarse-graining method. I. A rigorous bridge between atomistic and coarse-grained models. J. Chem. Phys. 128, 244114 (2008). · DOI
  66. Fuhrmans, M. & Müller, M. Coarse-grained simulation of dynamin-mediated fission. Soft Matter 11, 1464–1480 (2015). · DOI
  67. Reynwar, B. J. et al. Aggregation and vesiculation of membrane proteins by curvature-mediated interactions. Nature 447, 461–464 (2007). · DOI
  68. Plimpton, S. Fast Parallel Algorithms for short-range molecular dynamics. J. Comput. Phys. 117, 1–19 (1995). · DOI · Paper page

Cited by

Sorted by citations

Metadata

Authors
Deo, R., Kushwah, M. S., Kamerkar, S. C., Kadam, N. Y., Dar, S., Babu, K., Srivastava, A., & Pucadyil, T. J.
Venue
Nature Communications
Published
2018-12-05
Volume
9
Issue
1
ISSN
2041-1723
Cited by
77
References
2
Language
en

About these checks

Registry, retraction, Cites and statistics results are computed, not judged, with one exception: a printed reference that no index lists is read once by a model before it counts as a citation error. Claims are extracted by a model and kept only when their quote appears verbatim in the text; each cited source is then checked, with a model’s help, for whether it says what the claim relies on. Those verdicts can be wrong — read the claim’s quote and the cited source before relying on one.

Statistics and arithmetic are recomputed, not judged.

Confidence bands are shown only for fields calibrated on our annotated test set. None is calibrated yet, so no band is shown.

What counts as a claim ›How we measure confidence ›How we check this ›

Are you an author, or do you see a problem with this page? Request a review