

The DOI matches its Crossref record; 62 of the 62 references it cites were found in a registry or an index; 4 of the 27 sources its claims cite were checked for support.
DRP1-mediated mitochondrial shape controls calcium homeostasis and muscle mass
Open accessAbstract
Mitochondrial quality control is essential in highly structured cells such as neurons and muscles. In skeletal muscle the mitochondrial fission proteins are reduced in different physiopathological conditions including ageing sarcopenia, cancer cachexia and chemotherapy-induced muscle wasting. However, whether mitochondrial fission is essential for muscle homeostasis is still unclear. Here we show that muscle-specific loss of the pro-fission dynamin related protein (DRP) 1 induces muscle wasting and weakness. Constitutive Drp1 ablation in muscles reduces growth and causes animal death while inducible deletion results in atrophy and degeneration. Drp1 deficient mitochondria are morphologically bigger and functionally abnormal. The dysfunctional mitochondria signals to the nucleus to induce the ubiquitin-proteasome system and an Unfolded Protein Response while the change of mitochondrial volume results in an increase of mitochondrial Ca 2+ uptake and myofiber death. Our findings reveal that morphology of mitochondrial network is critical for several biological processes that control nuclear programs and Ca 2+ handling.
Overview
AI snapshot
Written from the paper’s full text.
TL;DR
Muscle-specific loss of DRP1 in mice causes a lethal mitochondrial myopathy with atrophy, weakness, and altered calcium homeostasis. DRP1-deficient mitochondria are larger and dysfunctional, triggering UPR/UPS activation, blocked autophagy/mitophagy, and increased MCU-mediated Ca²⁺ uptake that contributes to myofiber death.
Key findings
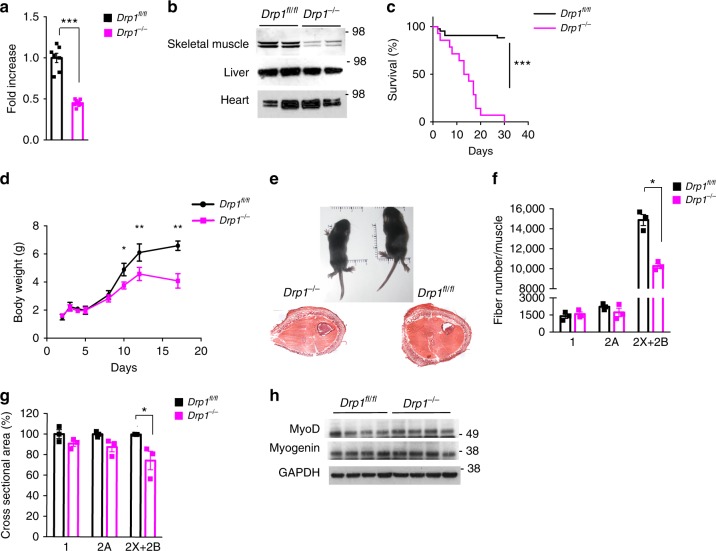
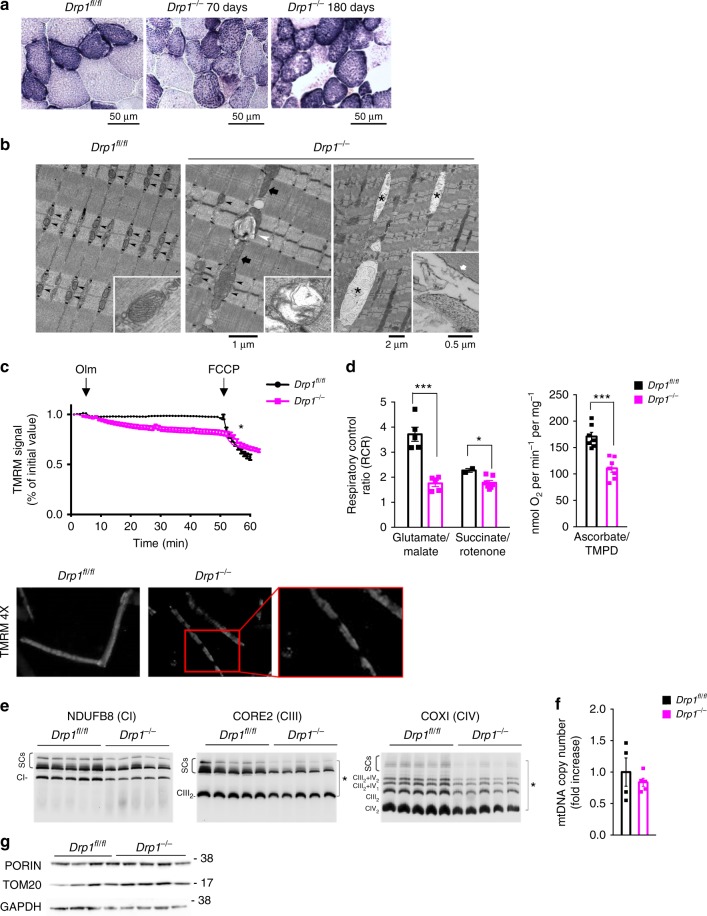
- Constitutive muscle-specific Drp1 deletion caused postnatal lethality within 30 days (WT n = 43; KO n = 14), reduced body growth, fewer glycolytic 2B/2X fibers, smaller cross-sectional area, and a 30% reduction in protein synthesis.
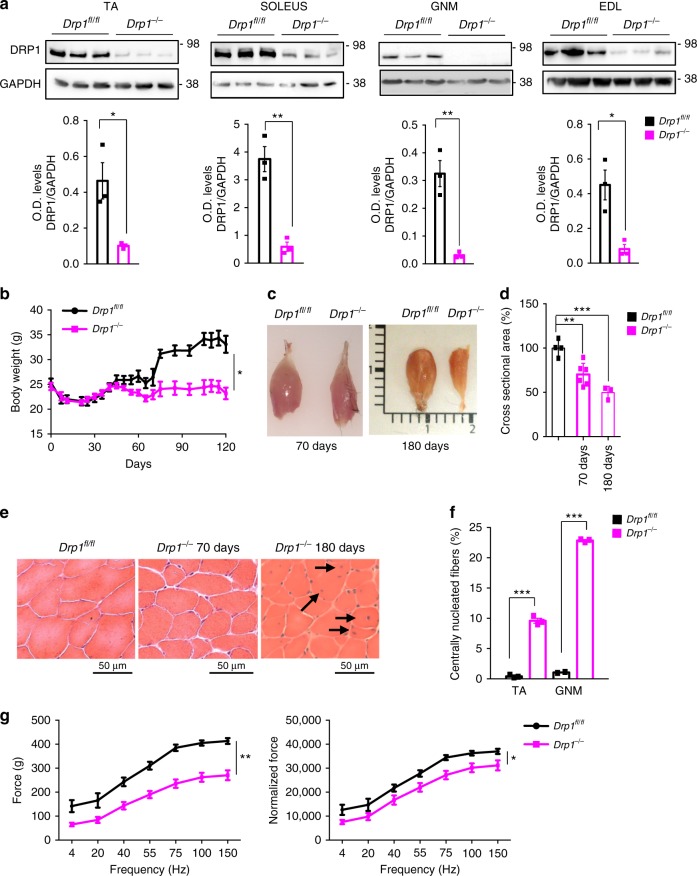
- Inducible adult Drp1 deletion reduced fiber size by 25% at 70 days and 50% at 180 days, decreased absolute and specific force, and produced center-nucleated fibers in 10% of tibialis anterior and 25% of gastrocnemius myofibers at 180 days.
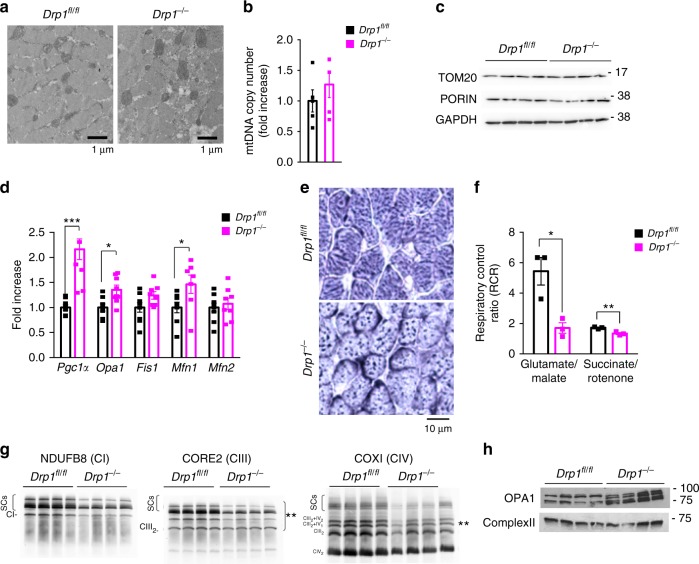
- Drp1-deficient mitochondria were larger and fewer with unchanged mtDNA content and mitochondrial mass, but showed reduced respiration (complex-I-driven respiration most affected), decreased respiratory chain supercomplexes, increased OPA1 cleavage, and in acute deletion about 10% damaged mitochondria versus 2% in WT.
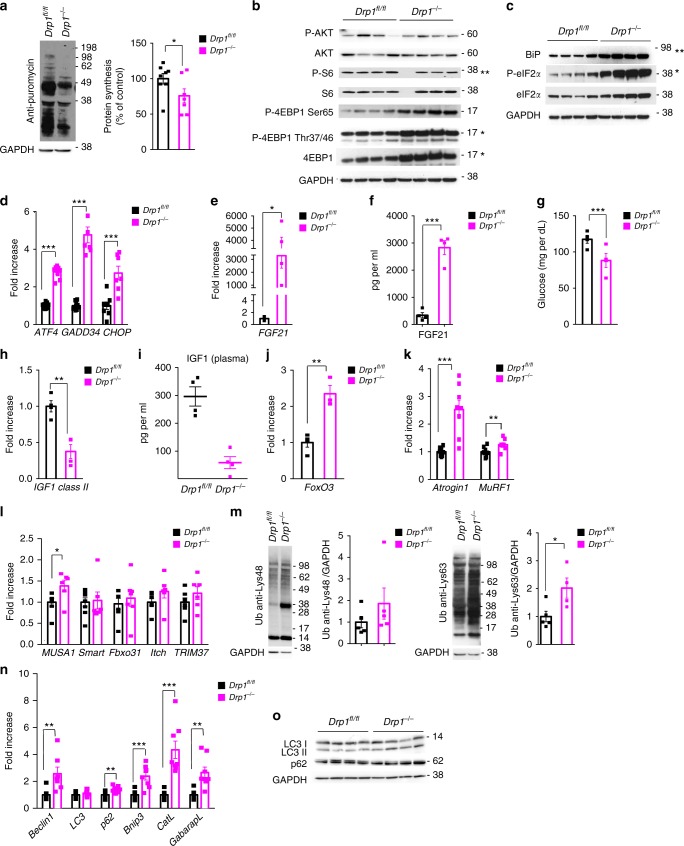
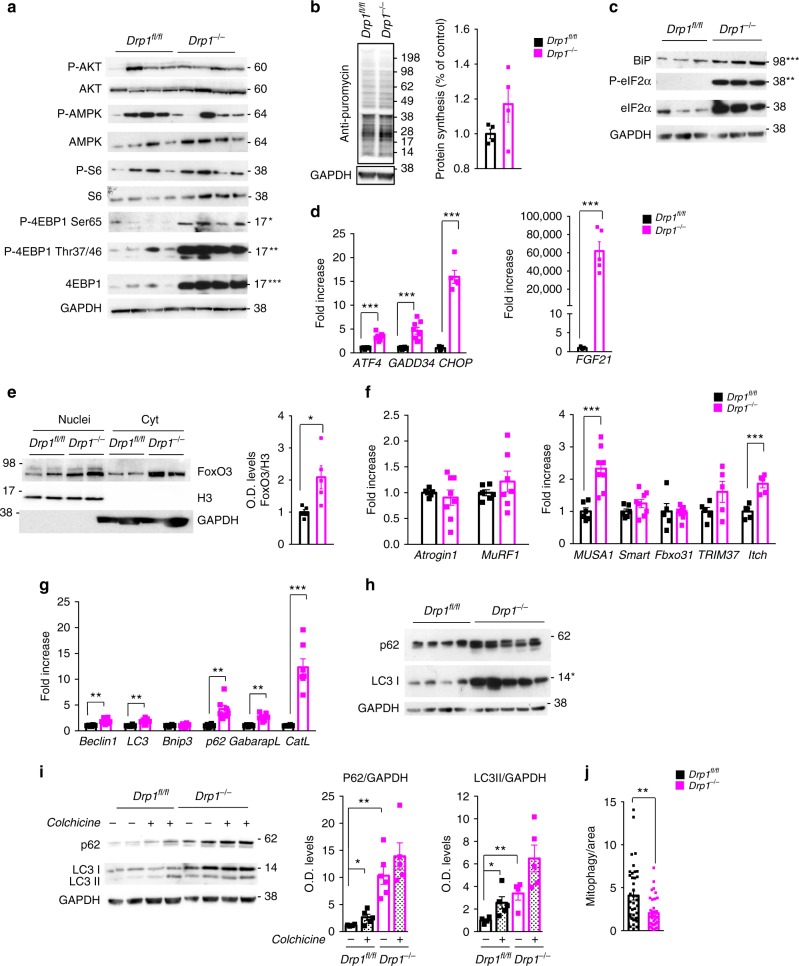
- DRP1 loss activated UPR (Bip/Grp78, p-eIF2α, ATF4, FGF21; FGF21 blood increased 20-fold in acute KO), induced FoxO3/UPS, blocked autophagy/mitophagy, and increased mitochondrial Ca²⁺ uptake via MCU upregulation and miR1 downregulation; MCU knockdown normalized cytosolic Ca²⁺ and reduced center-nucleated fibers.
Methods
- Two muscle-specific Drp1 knockout models: constitutive Drp1fl/fl × MLC1f-Cre mice analyzed at postnatal day 12, and tamoxifen-inducible Drp1fl/fl × HSA-Cre-ER mice treated at 5 months of age; Cre-negative littermates served as controls.
- Readouts included electron microscopy/stereology, histology and SDH staining, RT-qPCR, immunoblotting, mitochondrial respiration and Blue Native PAGE, SUnSET protein synthesis, TMRM membrane potential, Fura-2 and cameleon Ca²⁺ probes, in vivo/ex vivo force and fatigue measurements, mito-Keima mitophagy assay, MCU knockdown, and plasma FGF21/IGF1 measurements.
- Data are means ± SEM; statistical analysis used two-tailed unpaired Student’s t test or two-way ANOVA with Bonferroni’s multiple comparison test, with significance at p < 0.05.
Limitations
- Stated: MCU knockdown did not completely block degeneration/regeneration because transfection efficiency was low, so MCU was reduced only in some myofibers.
- Evident: all findings are from mouse models; no human patient validation is reported.
- Evident: some analyses used very small n (e.g., WT n = 2 for succinate/rotenone respiration in Fig. 5d), and the causal role of Ca²⁺ dysregulation is supported by rescue/knockdown experiments but not fully isolated from other DRP1-dependent defects.
Model-written summary. Check it against the paper before relying on it.
Integrity signals
Registry
Cites
Statistics
Figures
Verification
Claims the paper makes
36 Own result · 22 Own interpretation · 13 Not checked yet · 8 Own method · 5 No basis given · 1 Partly supported · accuracy not yet measured
The cited sources support only part of this claim — read each source’s verdict below.
In the paper
“In skeletal muscle the mitochondrial fission proteins are reduced in different physiopathological conditions including ageing sarcopenia, cancer cachexia and chemotherapy-induced muscle wasting.”
- Also stated in: § Introduction · plain
“In cancer cachexia and in chemotherapy-induced cachexia, DRP1, OPA1, and Mitofusin2 are dramatically suppressed16–18.”
§ DRP1-mediated mitochondrial shape controls calcium homeostasis and muscle mass > Abstract
What the sources say
- Partly supportedcites [13] Tezze, C. et al. Age-associated loss of OPA1 in muscle impacts muscle mass, metabolic homeostasis, systemic inflammation, and epithelial senescence. Cell Metab. 25, 1374–1389 e1376 (2017). sourceExperimental — accuracy not yet measured
The Results section, “Age-Related Muscle Loss in Humans and Mice Is Associated with Decreased OPA1 Expression” (page unavailable), reports reduced DRP1 transcripts and protein in muscle biopsies from older sedentary sarcopenic subjects. The passages from our copy do not establish reduced fission proteins in cancer cachexia or chemotherapy-induced muscle wasting. (LLM, conf=0.88)
- Partly supportedcites [14] Zhou, J. et al. Changes in macroautophagy, chaperone-mediated autophagy, and mitochondrial metabolism in murine skeletal and cardiac muscle during aging. Aging (Albany NY) 9, 583–599 (2017). sourceExperimental — accuracy not yet measured
The Results section ('Decreased markers for mitochondrial quality control in muscle but not heart in aged mice'; page unavailable) reports reduced Drp1, a mitochondrial fission protein, in skeletal muscle from aged mice. The paper does not report reduced fission proteins in cancer cachexia or chemotherapy-induced muscle wasting, and its finding in aged mice does not specifically establish sarcopenia. (LLM, conf=0.88)
- Partly supportedcites [16] Barreto, R. et al. Cancer and chemotherapy contribute to muscle loss by activating common signaling pathways. Front Physiol. 7, 472 (2016). sourceExperimental — accuracy not yet measured
The Discussion reports decreased expression of mitochondrial fusion and fission markers in skeletal muscle from C26 tumor-bearing mice and mice treated with chemotherapy. It does not report that fission proteins are reduced in ageing sarcopenia, so the claim's third condition is unsupported by this paper. (LLM, conf=0.88)
- Not checked yetcites [17] van der Ende, M. et al. Mitochondrial dynamics in cancer-induced cachexia. Biochimica et biophysica acta. Rev. cancer 1870, 137–150 (2018).
- Partly supportedcites [18] Brown, J. L. et al. Mitochondrial degeneration precedes the development of muscle atrophy in progression of cancer cachexia in tumour-bearing mice. J. Cachex-. Sarcopenia Muscle 8, 926–938 (2017). sourceExperimental — accuracy not yet measured
The Results section (‘Lewis lung carcinoma impairs mitochondrial quality control’; page not provided) reports that Drp1 was about 45% lower in cachectic mice, supporting a reduction in one fission protein in cancer cachexia. But the other measured fission protein, Fis1, was about 80% higher. The paper does not report fission-protein reductions in ageing sarcopenia or chemotherapy-induced muscle wasting. (LLM, conf=0.90)
plaincorrelational- Asserted: passes — The authors put it forward as true.
- Checkable: passes — It can be checked against evidence.
- Load-bearing: unclear — It is unclear whether the paper’s conclusions depend on it.
- Based: passes — The paper gives a reason why it holds.
- Also stated in: § Introduction · plain
A result the paper reports from its own data — it cites no other source for it, so there is none to check. The quote shows it is in the paper.
In the paper
“FGF21 blood levels were also increased of 20-fold in DRP1 knockout mice when compared with controls”
§ DRP1-mediated mitochondrial shape controls calcium homeostasis and muscle mass > Results > Acute deletion of Drp1 induces ER stress and blocks autophagy
plaincorrelational- Asserted: passes — The authors put it forward as true.
- Checkable: passes — It can be checked against evidence.
- Load-bearing: unclear — It is unclear whether the paper’s conclusions depend on it.
- Based: passes — The paper gives a reason why it holds.
A result the paper reports from its own data — it cites no other source for it, so there is none to check. The quote shows it is in the paper.
In the paper
“inducible deletion results in atrophy and degeneration”
§ DRP1-mediated mitochondrial shape controls calcium homeostasis and muscle mass > Abstract
plaindirect- Asserted: passes — The authors put it forward as true.
- Checkable: passes — It can be checked against evidence.
- Load-bearing: passes — The paper’s conclusions depend on it.
- Based: passes — The paper gives a reason why it holds.
A result the paper reports from its own data — it cites no other source for it, so there is none to check. The quote shows it is in the paper.
In the paper
“while atrogin1 and MuRF1 did not change”
§ DRP1-mediated mitochondrial shape controls calcium homeostasis and muscle mass > Results > Acute deletion of Drp1 induces ER stress and blocks autophagy
plain- Asserted: passes — The authors put it forward as true.
- Checkable: passes — It can be checked against evidence.
- Load-bearing: unclear — It is unclear whether the paper’s conclusions depend on it.
- Based: passes — The paper gives a reason why it holds.
A result the paper reports from its own data — it cites no other source for it, so there is none to check. The quote shows it is in the paper.
In the paper
“we found an upregulation of most of these genes”
§ DRP1-mediated mitochondrial shape controls calcium homeostasis and muscle mass > Results > Acute deletion of Drp1 induces ER stress and blocks autophagy
plaindirect- Asserted: passes — The authors put it forward as true.
- Checkable: passes — It can be checked against evidence.
- Load-bearing: unclear — It is unclear whether the paper’s conclusions depend on it.
- Based: passes — The paper gives a reason why it holds.
A result the paper reports from its own data — it cites no other source for it, so there is none to check. The quote shows it is in the paper.
In the paper
“protein synthesis was reduced by 30% in Drp1−/− mice”
§ DRP1-mediated mitochondrial shape controls calcium homeostasis and muscle mass > Results > Drp1 deletion reduces protein synthesis and induces atrophy
plaindirect- Asserted: passes — The authors put it forward as true.
- Checkable: passes — It can be checked against evidence.
- Load-bearing: passes — The paper’s conclusions depend on it.
- Based: passes — The paper gives a reason why it holds.
A result the paper reports from its own data — it cites no other source for it, so there is none to check. The quote shows it is in the paper.
In the paper
“Absence of DRP1 induces mitochondrial depolarization.”
§ DRP1-mediated mitochondrial shape controls calcium homeostasis and muscle mass > Results > Acute deletion of Drp1 causes mitochondrial dysfunction
plaindirect- Asserted: passes — The authors put it forward as true.
- Checkable: passes — It can be checked against evidence.
- Load-bearing: passes — The paper’s conclusions depend on it.
- Based: passes — The paper gives a reason why it holds.
A result the paper reports from its own data — it cites no other source for it, so there is none to check. The quote shows it is in the paper.
In the paper
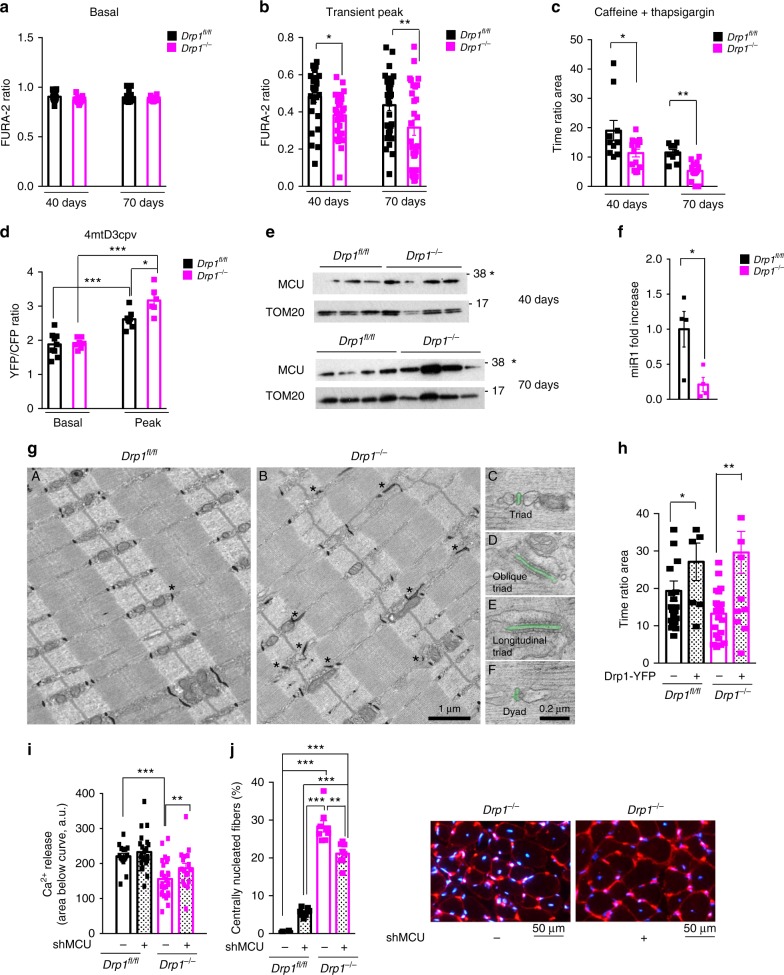
“we initially measured cytosolic calcium of Drp1−/− and controls in basal condition and found no difference”
§ DRP1-mediated mitochondrial shape controls calcium homeostasis and muscle mass > Results > Inhibition of DRP1 alters normal calcium homeostasis
plain- Asserted: passes — The authors put it forward as true.
- Checkable: passes — It can be checked against evidence.
- Load-bearing: passes — The paper’s conclusions depend on it.
- Based: passes — The paper gives a reason why it holds.
A result the paper reports from its own data — it cites no other source for it, so there is none to check. The quote shows it is in the paper.
In the paper
“we showed an increase of MCU in mitochondria of DRP1-deficient mice”
§ DRP1-mediated mitochondrial shape controls calcium homeostasis and muscle mass > Results > Inhibition of DRP1 alters normal calcium homeostasis
boostedcorrelational- Asserted: passes — The authors put it forward as true.
- Checkable: passes — It can be checked against evidence.
- Load-bearing: passes — The paper’s conclusions depend on it.
- Based: passes — The paper gives a reason why it holds.
A result the paper reports from its own data — it cites no other source for it, so there is none to check. The quote shows it is in the paper.
In the paper
“we found no increase of p62 and LC3II upon colchicine treatment in DRP1-deficient mice”
§ DRP1-mediated mitochondrial shape controls calcium homeostasis and muscle mass > Results > Acute deletion of Drp1 induces ER stress and blocks autophagy
plain- Asserted: passes — The authors put it forward as true.
- Checkable: passes — It can be checked against evidence.
- Load-bearing: passes — The paper’s conclusions depend on it.
- Based: passes — The paper gives a reason why it holds.
- It may state two separate claims as one. 36
- Probably not a substantial claim. 14
A result the paper reports from its own data — it cites no other source for it, so there is none to check. The quote shows it is in the paper.
In the paper
“we found an activation of the UPR pathway. Bip/Grp78 and p-eIF2α (Fig. 6c; Supplementary Fig. 7a) and the transcripts of ATF4 and downstream genes, including FGF21, were induced in DRP1-null muscles”
§ DRP1-mediated mitochondrial shape controls calcium homeostasis and muscle mass > Results > Acute deletion of Drp1 induces ER stress and blocks autophagy
plaindirect- Asserted: passes — The authors put it forward as true.
- Checkable: passes — It can be checked against evidence.
- Load-bearing: passes — The paper’s conclusions depend on it.
- Based: passes — The paper gives a reason why it holds.
It may state two separate claims as one.
A result the paper reports from its own data — it cites no other source for it, so there is none to check. The quote shows it is in the paper.
In the paper
“we did not detect an increase of lipidated LC3II, but instead we found an accumulation of LC3I”
§ DRP1-mediated mitochondrial shape controls calcium homeostasis and muscle mass > Results > Acute deletion of Drp1 induces ER stress and blocks autophagy
plain- Asserted: passes — The authors put it forward as true.
- Checkable: passes — It can be checked against evidence.
- Load-bearing: passes — The paper’s conclusions depend on it.
- Based: passes — The paper gives a reason why it holds.
It may state two separate claims as one.
A result the paper reports from its own data — it cites no other source for it, so there is none to check. The quote shows it is in the paper.
In the paper
“Ablation of DRP1 in adulthood modifies mitochondrial shape and reduces RCS assembly, Complex-I-, Complex-II-, and complex-IV-dependent respiration.”
§ DRP1-mediated mitochondrial shape controls calcium homeostasis and muscle mass > Results > Acute deletion of Drp1 causes mitochondrial dysfunction
plaindirectn = 5- Asserted: passes — The authors put it forward as true.
- Checkable: passes — It can be checked against evidence.
- Load-bearing: passes — The paper’s conclusions depend on it.
- Based: passes — The paper gives a reason why it holds.
It may state two separate claims as one.
A result the paper reports from its own data — it cites no other source for it, so there is none to check. The quote shows it is in the paper.
In the paper
“Here we show that muscle-specific loss of the pro-fission dynamin related protein (DRP) 1 induces muscle wasting and weakness.”
§ DRP1-mediated mitochondrial shape controls calcium homeostasis and muscle mass > Abstract
plaindirect- Asserted: passes — The authors put it forward as true.
- Checkable: passes — It can be checked against evidence.
- Load-bearing: passes — The paper’s conclusions depend on it.
- Based: passes — The paper gives a reason why it holds.
It may state two separate claims as one.
A result the paper reports from its own data — it cites no other source for it, so there is none to check. The quote shows it is in the paper.
In the paper
“Drp1 deficient mitochondria are morphologically bigger and functionally abnormal.”
§ DRP1-mediated mitochondrial shape controls calcium homeostasis and muscle mass > Abstract
plaindirect- Asserted: passes — The authors put it forward as true.
- Checkable: passes — It can be checked against evidence.
- Load-bearing: passes — The paper’s conclusions depend on it.
- Based: passes — The paper gives a reason why it holds.
It may state two separate claims as one.
A result the paper reports from its own data — it cites no other source for it, so there is none to check. The quote shows it is in the paper.
In the paper
“SDH staining indicating the presence of bigger mitochondria in KO muscles compared with control.”
- Also stated in: § Acute deletion of Drp1 causes mitochondrial dysfunction · plain
“Ablation of DRP1 in adulthood modifies mitochondrial shape and reduces RCS assembly, Complex-I-, Complex-II-, and complex-IV-dependent respiration.”
§ DRP1-mediated mitochondrial shape controls calcium homeostasis and muscle mass > Results > Acute deletion of Drp1 causes mitochondrial dysfunction
plaindirect- Asserted: passes — The authors put it forward as true.
- Checkable: passes — It can be checked against evidence.
- Load-bearing: passes — The paper’s conclusions depend on it.
- Based: passes — The paper gives a reason why it holds.
It may state two separate claims as one.
- Also stated in: § Acute deletion of Drp1 causes mitochondrial dysfunction · plain
A result the paper reports from its own data — it cites no other source for it, so there is none to check. The quote shows it is in the paper.
In the paper
“Mitochondrial matrix-free calcium concentration is not affected at rest but is higher in Drp1−/− compared with control during a train of electrical stimulation at 60 Hz, 2 s duration”
- Also stated in: § Inhibition of DRP1 alters normal calcium homeostasis · plain
“the peak of Ca2+ concentration reached during high-frequency electrical stimulation was higher in DRP1-deficient myofibers”
§ DRP1-mediated mitochondrial shape controls calcium homeostasis and muscle mass > Results > Inhibition of DRP1 alters normal calcium homeostasis
plaincorrelational- Asserted: passes — The authors put it forward as true.
- Checkable: passes — It can be checked against evidence.
- Load-bearing: passes — The paper’s conclusions depend on it.
- Based: passes — The paper gives a reason why it holds.
It may state two separate claims as one.
- Also stated in: § Inhibition of DRP1 alters normal calcium homeostasis · plain
A result the paper reports from its own data — it cites no other source for it, so there is none to check. The quote shows it is in the paper.
In the paper
“Constitutive Drp1 ablation in muscles reduces growth and causes animal death”
§ DRP1-mediated mitochondrial shape controls calcium homeostasis and muscle mass > Abstract
plaindirect- Asserted: passes — The authors put it forward as true.
- Checkable: passes — It can be checked against evidence.
- Load-bearing: passes — The paper’s conclusions depend on it.
- Based: passes — The paper gives a reason why it holds.
It may state two separate claims as one.
A result the paper reports from its own data — it cites no other source for it, so there is none to check. The quote shows it is in the paper.
In the paper
“the Akt-mTOR axis appeared inconsistent with the atrophic phenotype being 4EBP1 robustly hyper-phosphorylated in two mTOR-dependent sites and S6 unchanged”
§ DRP1-mediated mitochondrial shape controls calcium homeostasis and muscle mass > Results > Acute deletion of Drp1 induces ER stress and blocks autophagy
hedgeddirect- Asserted: passes — The authors put it forward as true.
- Checkable: passes — It can be checked against evidence.
- Load-bearing: passes — The paper’s conclusions depend on it.
- Based: passes — The paper gives a reason why it holds.
It may state two separate claims as one.
A result the paper reports from its own data — it cites no other source for it, so there is none to check. The quote shows it is in the paper.
In the paper
“These changes occurred early after 40 days from tamoxifen treatment when animals have not yet lost muscle mass and progressively increased at 70 days.”
§ DRP1-mediated mitochondrial shape controls calcium homeostasis and muscle mass > Results > Inhibition of DRP1 alters normal calcium homeostasis
plaincorrelational- Asserted: passes — The authors put it forward as true.
- Checkable: passes — It can be checked against evidence.
- Load-bearing: passes — The paper’s conclusions depend on it.
- Based: passes — The paper gives a reason why it holds.
It may state two separate claims as one.
A result the paper reports from its own data — it cites no other source for it, so there is none to check. The quote shows it is in the paper.
In the paper
“the inflammatory response is not present and oxidative stress is not increased in DRP1 knockout mice (Supplementary Figs. 9f, 6e).”
§ DRP1-mediated mitochondrial shape controls calcium homeostasis and muscle mass > Discussion
plain- Asserted: passes — The authors put it forward as true.
- Checkable: passes — It can be checked against evidence.
- Load-bearing: passes — The paper’s conclusions depend on it.
- Based: passes — The paper gives a reason why it holds.
It may state two separate claims as one.
A result the paper reports from its own data — it cites no other source for it, so there is none to check. The quote shows it is in the paper.
In the paper
“DRP1 overexpression reverted or induced UPR in DRP1 knockout and control mice, respectively”
§ DRP1-mediated mitochondrial shape controls calcium homeostasis and muscle mass > Results > DRP1 rescue or MCU inhibition normalizes Ca2+ homeostasis
plaindirect- Asserted: passes — The authors put it forward as true.
- Checkable: passes — It can be checked against evidence.
- Load-bearing: passes — The paper’s conclusions depend on it.
- Based: passes — The paper gives a reason why it holds.
It may state two separate claims as one.
The paper states this without a source or data behind it here, so there is nothing to check it against. The quote shows it is in the paper.
In the paper
“Under these assumptions, the resting cytosolic calcium concentration will be 71 nM at R = 0.87 and 87 nM at R = 0.92.”
§ DRP1-mediated mitochondrial shape controls calcium homeostasis and muscle mass > Methods > Free calcium concentration in the cytosol
hedgedcorrelational- Asserted: passes — The authors put it forward as true.
- Checkable: passes — It can be checked against evidence.
- Load-bearing: fails — The paper’s conclusions may not depend on it.
- Based: passes — The paper gives a reason why it holds.
Probably not a substantial claim. The paper’s conclusions may not depend on it. It may state two separate claims as one.
- The authors state this as an assumption: The calibration equation and constants (KD = 145 nM, Rmin, Rmax, β) used to convert Fura-2 fluorescence ratios to free cytosolic calcium concentration are valid.
A result the paper reports from its own data — it cites no other source for it, so there is none to check. The quote shows it is in the paper.
In the paper
“we performed EM analyses and found some modification in CRUs compared with WT fibers”
- Also stated in: § Inhibition of DRP1 alters normal calcium homeostasis · boosted
“we showed an increased frequency of oblique/longitudinal triads (inserts D and E) and a decrease in the number/area of CRUs compared with WT fibers”
§ DRP1-mediated mitochondrial shape controls calcium homeostasis and muscle mass > Results > Inhibition of DRP1 alters normal calcium homeostasis
boosteddirect- Asserted: passes — The authors put it forward as true.
- Checkable: passes — It can be checked against evidence.
- Load-bearing: passes — The paper’s conclusions depend on it.
- Based: passes — The paper gives a reason why it holds.
It may state two separate claims as one.
- Also stated in: § Inhibition of DRP1 alters normal calcium homeostasis · boosted
A result the paper reports from its own data — it cites no other source for it, so there is none to check. The quote shows it is in the paper.
In the paper
“By reducing MCU expression for two months, we reduced the amount of center-nucleated fibers (Fig. 7j) and suppressed UPR (Supplementary Fig. 9e).”
§ DRP1-mediated mitochondrial shape controls calcium homeostasis and muscle mass > Results > DRP1 rescue or MCU inhibition normalizes Ca2+ homeostasis
plaindirect- Asserted: passes — The authors put it forward as true.
- Checkable: passes — It can be checked against evidence.
- Load-bearing: passes — The paper’s conclusions depend on it.
- Based: passes — The paper gives a reason why it holds.
It may state two separate claims as one.
In the paper
“Another peculiarity of the loss-of-function approach is the decrease of the ER-mitochondria tethering protein mitofusin2 and the down- and upregulation of the ER chaperones calnexin and Bip/Grp78, respectively11.”
§ DRP1-mediated mitochondrial shape controls calcium homeostasis and muscle mass > Discussion
What the sources say
- Not checked yetcites [11] Touvier, T. et al. Muscle-specific Drp1 overexpression impairs skeletal muscle growth via translational attenuation. Cell Death Dis. 6, e1663 (2015). source
plaindirect- Asserted: passes — The authors put it forward as true.
- Checkable: passes — It can be checked against evidence.
- Load-bearing: passes — The paper’s conclusions depend on it.
- Based: passes — The paper gives a reason why it holds.
It may state two separate claims as one.
A result the paper reports from its own data — it cites no other source for it, so there is none to check. The quote shows it is in the paper.
In the paper
“we found a downregulation in their expression”
§ DRP1-mediated mitochondrial shape controls calcium homeostasis and muscle mass > Results > Inhibition of DRP1 alters normal calcium homeostasis
plaindirect- Asserted: passes — The authors put it forward as true.
- Checkable: passes — It can be checked against evidence.
- Load-bearing: passes — The paper’s conclusions depend on it.
- Based: passes — The paper gives a reason why it holds.
It may state two separate claims as one.
A conclusion the paper draws from its own results — it cites no other source for it, so there is none to check. The quote shows it is in the paper.
In the paper
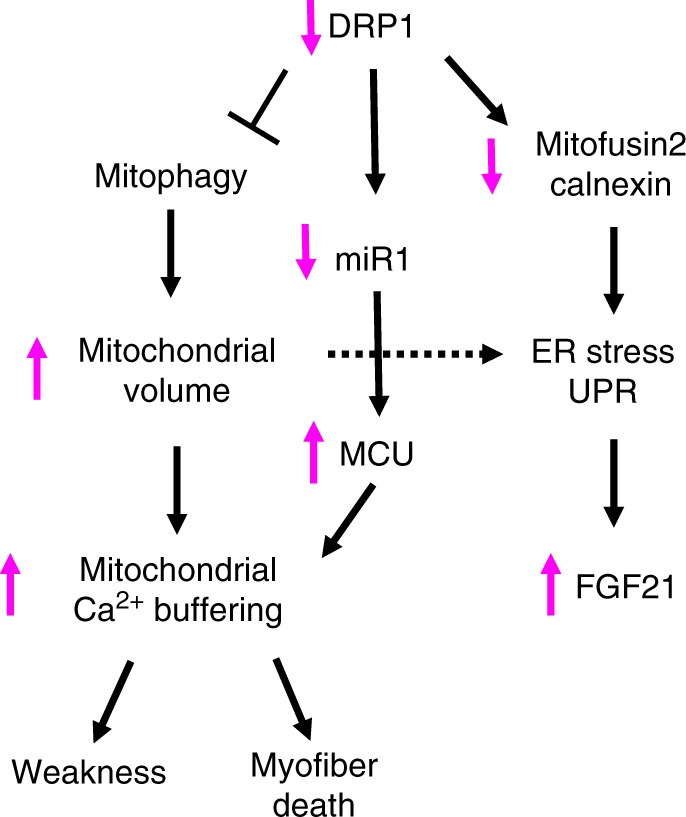
“the change of mitochondrial volume results in an increase of mitochondrial Ca2+ uptake and myofiber death”
§ DRP1-mediated mitochondrial shape controls calcium homeostasis and muscle mass > Abstract
plaindirect- Asserted: passes — The authors put it forward as true.
- Checkable: passes — It can be checked against evidence.
- Load-bearing: passes — The paper’s conclusions depend on it.
- Based: passes — The paper gives a reason why it holds.
It may state two separate claims as one.
A conclusion the paper draws from its own results — it cites no other source for it, so there is none to check. The quote shows it is in the paper.
In the paper
“Thus, acute inhibition of DRP1 causes muscle loss and important weakness, but ameliorates fatigue.”
§ DRP1-mediated mitochondrial shape controls calcium homeostasis and muscle mass > Results > Acute deletion of Drp1 causes muscle wasting and weakness
plaindirect- Asserted: passes — The authors put it forward as true.
- Checkable: passes — It can be checked against evidence.
- Load-bearing: passes — The paper’s conclusions depend on it.
- Based: passes — The paper gives a reason why it holds.
It may state two separate claims as one.
In the paper
“loss of DRP1 in adult muscle is sufficient to induce a catabolic condition that involves activation of the UPS system and inhibition of autophagy and mitophagy pathways34.”
§ DRP1-mediated mitochondrial shape controls calcium homeostasis and muscle mass > Results > Acute deletion of Drp1 induces ER stress and blocks autophagy
What the sources say
- Not checked yetcites [34] Masiero, E. et al. Autophagy is required to maintain muscle mass. Cell Metab. 10, 507–515 (2009). source
plaindirect- Asserted: passes — The authors put it forward as true.
- Checkable: passes — It can be checked against evidence.
- Load-bearing: passes — The paper’s conclusions depend on it.
- Based: passes — The paper gives a reason why it holds.
It may state two separate claims as one.
A conclusion the paper draws from its own results — it cites no other source for it, so there is none to check. The quote shows it is in the paper.
In the paper
“Therefore, DRP1 ablation alters mitochondrial morphology and function.”
§ DRP1-mediated mitochondrial shape controls calcium homeostasis and muscle mass > Results > Drp1 deletion impairs mitochondrial function
plaindirect- Asserted: passes — The authors put it forward as true.
- Checkable: passes — It can be checked against evidence.
- Load-bearing: passes — The paper’s conclusions depend on it.
- Based: passes — The paper gives a reason why it holds.
It may state two separate claims as one.
A conclusion the paper draws from its own results — it cites no other source for it, so there is none to check. The quote shows it is in the paper.
In the paper
“supporting the concept that UPR is strongly activated in Drp1−/− muscles and can account for the translation impairment”
§ DRP1-mediated mitochondrial shape controls calcium homeostasis and muscle mass > Results > Drp1 deletion reduces protein synthesis and induces atrophy
boosteddirect- Asserted: passes — The authors put it forward as true.
- Checkable: passes — It can be checked against evidence.
- Load-bearing: passes — The paper’s conclusions depend on it.
- Based: passes — The paper gives a reason why it holds.
It may state two separate claims as one.
In the paper
“We monitored autophagic flux in basal condition using colchicine62.”
§ DRP1-mediated mitochondrial shape controls calcium homeostasis and muscle mass > Methods > Autophagic flux quantification
What the sources say
- Not checked yetcites [62] Ju, J. S., Varadhachary, A. S., Miller, S. E. & Weihl, C. C. Quantitation of “autophagic flux” in mature skeletal muscle. Autophagy 6, 929–935 (2010). source
plain- Asserted: passes — The authors put it forward as true.
- Checkable: passes — It can be checked against evidence.
- Load-bearing: fails — The paper’s conclusions may not depend on it.
- Based: passes — The paper gives a reason why it holds.
Probably not a substantial claim. The paper’s conclusions may not depend on it.
None of the sources cited for this claim have been checked yet.
In the paper
“it has been shown that inhibition of PTP opening is beneficial in dystrophic muscles45–47.”
§ DRP1-mediated mitochondrial shape controls calcium homeostasis and muscle mass > Discussion
What the sources say
- Not checked yetcites [45] Millay, D. P. et al. Genetic and pharmacologic inhibition of mitochondrial-dependent necrosis attenuates muscular dystrophy. Nat. Med. 14, 442–447 (2008). source
- Not checked yetcites [46] Irwin, W. A. et al. Mitochondrial dysfunction and apoptosis in myopathic mice with collagen VI deficiency. Nat. Genet. 35, 367–371 (2003). source
- Not checked yetcites [47] Angelin, A. et al. Mitochondrial dysfunction in the pathogenesis of Ullrich congenital muscular dystrophy and prospective therapy with cyclosporins. Proc. Natl Acad. Sci. USA 104, 991–996 (2007). source
boosteddirect- Asserted: passes — The authors put it forward as true.
- Checkable: passes — It can be checked against evidence.
- Load-bearing: fails — The paper’s conclusions may not depend on it.
- Based: passes — The paper gives a reason why it holds.
Probably not a substantial claim. The paper’s conclusions may not depend on it.
A conclusion the paper draws from its own results — it cites no other source for it, so there is none to check. The quote shows it is in the paper.
In the paper
“In conclusion, even though both fusion and fission machinery inhibitions induce mitochondrial dysfunction, revealed by decreased respiration, supercomplex formation, and mitochondrial membrane potential, the signaling pathways and the biological effects downstream mitochondria are peculiar for fusion or fission deficiency.”
§ DRP1-mediated mitochondrial shape controls calcium homeostasis and muscle mass > Discussion
plaindirect- Asserted: passes — The authors put it forward as true.
- Checkable: passes — It can be checked against evidence.
- Load-bearing: passes — The paper’s conclusions depend on it.
- Based: passes — The paper gives a reason why it holds.
It may state two separate claims as one.
A conclusion the paper draws from its own results — it cites no other source for it, so there is none to check. The quote shows it is in the paper.
In the paper
“The finding that two different knockouts mice, muscle-specific and inducible muscle-specific, result in striking phenotypes (Supplementary Table 3) underlines the critical role of DRP1 in mitochondria function and muscle homeostasis.”
§ DRP1-mediated mitochondrial shape controls calcium homeostasis and muscle mass > Discussion
boosteddirectn = 2- Asserted: passes — The authors put it forward as true.
- Checkable: passes — It can be checked against evidence.
- Load-bearing: passes — The paper’s conclusions depend on it.
- Based: passes — The paper gives a reason why it holds.
It may state two separate claims as one.
What the paper did — it cites no source for this, so there is none to check. The quote shows it is in the paper.
In the paper
“Force was normalized to the muscle mass as an estimate of specific force.”
§ DRP1-mediated mitochondrial shape controls calcium homeostasis and muscle mass > Methods > Contractile force measurements
plain- Asserted: passes — The authors put it forward as true.
- Checkable: passes — It can be checked against evidence.
- Load-bearing: fails — The paper’s conclusions may not depend on it.
- Based: passes — The paper gives a reason why it holds.
Probably not a substantial claim. The paper’s conclusions may not depend on it.
In the paper
“ER stress and UPR activation are well-known triggers of FGF21 production in different organs, such as the liver, pancreas, or adipose tissue39.”
§ DRP1-mediated mitochondrial shape controls calcium homeostasis and muscle mass > Discussion
What the sources say
- Not checked yetcites [39] Gimeno, R. E. & Moller, D. E. FGF21-based pharmacotherapy-potential utility for metabolic disorders. Trends Endocrinol. Metab. 25, 303–311 (2014). source
boosteddirect- Asserted: passes — The authors put it forward as true.
- Checkable: passes — It can be checked against evidence.
- Load-bearing: fails — The paper’s conclusions may not depend on it.
- Based: passes — The paper gives a reason why it holds.
Probably not a substantial claim. The paper’s conclusions may not depend on it.
A conclusion the paper draws from its own results — it cites no other source for it, so there is none to check. The quote shows it is in the paper.
In the paper
“Therefore, the shape of the mitochondria is critical for mitochondrial function, but triggers different signaling pathways and biological processes that are peculiar of fusion or fission impairment.”
§ DRP1-mediated mitochondrial shape controls calcium homeostasis and muscle mass > Discussion
plaindirect- Asserted: passes — The authors put it forward as true.
- Checkable: passes — It can be checked against evidence.
- Load-bearing: passes — The paper’s conclusions depend on it.
- Based: passes — The paper gives a reason why it holds.
It may state two separate claims as one.
None of the sources cited for this claim have been checked yet.
In the paper
“Thus, the impairment of the SR–mitochondria tethering and ER chaperon proteins would explain the abnormalities of CRUs and the presence of ER stress36,37.”
§ DRP1-mediated mitochondrial shape controls calcium homeostasis and muscle mass > Results > Inhibition of DRP1 alters normal calcium homeostasis
What the sources say
- Not checked yetcites [36] Gutierrez, T. & Simmen, T. Endoplasmic reticulum chaperones tweak the mitochondrial calcium rheostat to control metabolism and cell death. Cell Calcium 70, 64–75 (2018). source
- Not checked yetcites [37] Debattisti, V., Pendin, D., Ziviani, E., Daga, A. & Scorrano, L. Reduction of endoplasmic reticulum stress attenuates the defects caused by Drosophila mitofusin depletion. J. Cell Biol. 204, 303–312 (2014). source
hedgedconditional- Asserted: passes — The authors put it forward as true.
- Checkable: passes — It can be checked against evidence.
- Load-bearing: passes — The paper’s conclusions depend on it.
- Based: passes — The paper gives a reason why it holds.
It may state two separate claims as one.
What the paper did — it cites no source for this, so there is none to check. The quote shows it is in the paper.
In the paper
“The mtDNA copy number was calculated using 18S amplification as a reference for nuclear DNA content.”
§ DRP1-mediated mitochondrial shape controls calcium homeostasis and muscle mass > Methods > Measurement of mitochondrial DNA copy number
plain- Asserted: passes — The authors put it forward as true.
- Checkable: passes — It can be checked against evidence.
- Load-bearing: fails — The paper’s conclusions may not depend on it.
- Based: passes — The paper gives a reason why it holds.
Probably not a substantial claim. The paper’s conclusions may not depend on it.
What the paper did — it cites no source for this, so there is none to check. The quote shows it is in the paper.
In the paper
“We did not completely block the degeneration/regeneration process because the efficiency of transfection was low, and consequently, MCU was reduced only in some myofibers.”
§ DRP1-mediated mitochondrial shape controls calcium homeostasis and muscle mass > Discussion
plaindirect- Asserted: passes — The authors put it forward as true.
- Checkable: passes — It can be checked against evidence.
- Load-bearing: unclear — It is unclear whether the paper’s conclusions depend on it.
- Based: passes — The paper gives a reason why it holds.
It may state two separate claims as one.
A conclusion the paper draws from its own results — it cites no other source for it, so there is none to check. The quote shows it is in the paper.
In the paper
“Like other systems, such as autophagy, both chronic inhibition or acute hyperactivation of mitochondrial fission result in detrimental effects on muscle mass and function, but with different phenotypes and mechanisms.”
§ DRP1-mediated mitochondrial shape controls calcium homeostasis and muscle mass > Discussion
plaindirect- Asserted: passes — The authors put it forward as true.
- Checkable: passes — It can be checked against evidence.
- Load-bearing: passes — The paper’s conclusions depend on it.
- Based: passes — The paper gives a reason why it holds.
It may state two separate claims as one.
A conclusion the paper draws from its own results — it cites no other source for it, so there is none to check. The quote shows it is in the paper.
In the paper
“Therefore, DRP1 inhibition causes increased MCU expression via miR1 downregulation and enhanced Ca2+ uptake of the mitochondria.”
§ DRP1-mediated mitochondrial shape controls calcium homeostasis and muscle mass > Results > Inhibition of DRP1 alters normal calcium homeostasis
plaindirect- Asserted: passes — The authors put it forward as true.
- Checkable: passes — It can be checked against evidence.
- Load-bearing: passes — The paper’s conclusions depend on it.
- Based: passes — The paper gives a reason why it holds.
It may state two separate claims as one.
A conclusion the paper draws from its own results — it cites no other source for it, so there is none to check. The quote shows it is in the paper.
In the paper
“However, while the initial outcome of genetic DRP1 ablation is identical to its overexpression, i.e., muscle atrophy via FoxO, our loss-of-function study also reveals the appearance of center-nucleated fibers, a sign of myopathy, and the involvement of different signaling pathways, including MCU upregulation, ER-stress, UPR activation, and great FGF21 induction (Fig. 8).”
§ DRP1-mediated mitochondrial shape controls calcium homeostasis and muscle mass > Discussion
plaindirect- Asserted: passes — The authors put it forward as true.
- Checkable: passes — It can be checked against evidence.
- Load-bearing: passes — The paper’s conclusions depend on it.
- Based: passes — The paper gives a reason why it holds.
It may state two separate claims as one.
What the paper did — it cites no source for this, so there is none to check. The quote shows it is in the paper.
In the paper
“No evidence of necrosis or inflammation were observed after the transfection procedure.”
§ DRP1-mediated mitochondrial shape controls calcium homeostasis and muscle mass > Methods > In vivo FDB electroporation
plain- Asserted: passes — The authors put it forward as true.
- Checkable: passes — It can be checked against evidence.
- Load-bearing: fails — The paper’s conclusions may not depend on it.
- Based: passes — The paper gives a reason why it holds.
Probably not a substantial claim. The paper’s conclusions may not depend on it. It may state two separate claims as one.
A conclusion the paper draws from its own results — it cites no other source for it, so there is none to check. The quote shows it is in the paper.
In the paper
“Altogether, these findings confirm that inhibition of the fission machinery alters the SR–mitochondria tethering, decreases CRU units, increases mitochondrial Ca2+ uptake that, altogether, reduces Ca2+ availability for contraction, and simultaneously induces myofiber death, due to mitochondrial Ca2+ overload.”
§ DRP1-mediated mitochondrial shape controls calcium homeostasis and muscle mass > Results > DRP1 rescue or MCU inhibition normalizes Ca2+ homeostasis
boosteddirect- Asserted: passes — The authors put it forward as true.
- Checkable: passes — It can be checked against evidence.
- Load-bearing: passes — The paper’s conclusions depend on it.
- Based: passes — The paper gives a reason why it holds.
It may state two separate claims as one.
A conclusion the paper draws from its own results — it cites no other source for it, so there is none to check. The quote shows it is in the paper.
In the paper
“The increased expression of MCU in Drp1−/− fibers could induce mitochondrial Ca2+ overload, and possibly explains the increased presence of the swollen and damaged mitochondria (Fig. 5 b; Supplementary Table 1).”
§ DRP1-mediated mitochondrial shape controls calcium homeostasis and muscle mass > Discussion
hedgedconditional- Asserted: passes — The authors put it forward as true.
- Checkable: passes — It can be checked against evidence.
- Load-bearing: passes — The paper’s conclusions depend on it.
- Based: passes — The paper gives a reason why it holds.
It may state two separate claims as one.
The paper states this without a source or data behind it here, so there is nothing to check it against. The quote shows it is in the paper.
In the paper
“ATP-synthase can reversely transport protons across the inner mitochondrial membrane, so maintaining the potential also in dysfunctional mitochondria.”
§ DRP1-mediated mitochondrial shape controls calcium homeostasis and muscle mass > Methods > Mitochondrial membrane potential determination
plaindirect- Asserted: passes — The authors put it forward as true.
- Checkable: passes — It can be checked against evidence.
- Load-bearing: passes — The paper’s conclusions depend on it.
- Based: fails — The paper may give no reason why it holds.
Probably not a substantial claim. The paper may give no reason why it holds. It may state two separate claims as one.
None of the sources cited for this claim have been checked yet.
In the paper
“Free Ca2+ concentrations in the mitochondrial matrix and SR lumen were determined using cameleon Ca2+ probes, 4mtD3cpv54 for mitochondria and D1-ER 55 for sarcoplasmic reticulum, kindly donated by Dr. R.Y. Tsien (University of California, San Diego).”
§ DRP1-mediated mitochondrial shape controls calcium homeostasis and muscle mass > Methods > Detection of free Ca2+ in the SR and mitochondrial matrix
What the sources say
- Not checked yetcites [54] Giacomello, M. et al. Ca2+ hot spots on the mitochondrial surface are generated by Ca2+ mobilization from stores, but not by activation of store-operated Ca2+ channels. Mol. Cell 38, 280–290 (2010). source
- Not checked yetcites [55] Palmer, A. E., Jin, C., Reed, J. C. & Tsien, R. Y. Bcl-2-mediated alterations in endoplasmic reticulum Ca2+ analyzed with an improved genetically encoded fluorescent sensor. Proc. Natl Acad. Sci. USA 101, 17404–17409 (2004). source
plain- Asserted: passes — The authors put it forward as true.
- Checkable: passes — It can be checked against evidence.
- Load-bearing: passes — The paper’s conclusions depend on it.
- Based: passes — The paper gives a reason why it holds.
Probably not a substantial claim.
In the paper
“it is well known that Ca2+ overload triggers permeability transition pore (PTP) opening and mitochondrial swelling44.”
§ DRP1-mediated mitochondrial shape controls calcium homeostasis and muscle mass > Discussion
What the sources say
- Not checked yetcites [44] Giorgio, V., Guo, L., Bassot, C., Petronilli, V. & Bernardi, P. Calcium and regulation of the mitochondrial permeability transition. Cell Calcium 70, 56–63 (2017). source
boosteddirect- Asserted: passes — The authors put it forward as true.
- Checkable: passes — It can be checked against evidence.
- Load-bearing: passes — The paper’s conclusions depend on it.
- Based: passes — The paper gives a reason why it holds.
It may state two separate claims as one.
A conclusion the paper draws from its own results — it cites no other source for it, so there is none to check. The quote shows it is in the paper.
In the paper
“The apparent paradox could be explained by the lower force developed by DRP1-deficient muscles compared with control muscles. The reduction of force due to less contractile proteins and of cytosolic Ca2+ level leads to a decreased ATP consumption during contraction by myosin and SERCA ATPase pump, delaying ATP drop and consequently, improving fatigue.”
§ DRP1-mediated mitochondrial shape controls calcium homeostasis and muscle mass > Discussion
hedgeddirect- Asserted: passes — The authors put it forward as true.
- Checkable: passes — It can be checked against evidence.
- Load-bearing: passes — The paper’s conclusions depend on it.
- Based: passes — The paper gives a reason why it holds.
It may state two separate claims as one.
None of the sources cited for this claim have been checked yet.
In the paper
“Mitochondrial volume (Supplementary Table 1, column A and Supplementary Fig. 2a) was determined using the well-established stereology point-counting technique49,50 in micrographs taken from transversal sections at ×7.100 magnifications.”
§ DRP1-mediated mitochondrial shape controls calcium homeostasis and muscle mass > Methods > Quantitative analyses of the mitochondria
What the sources say
- Not checked yetcites [49] Loud, A. V., Barany, W. C. & Pack, B. A. Quantitative evaluation of cytoplasmic structures in electron micrographs. Lab. Invest. 14, 996–1008 (1965).
- Not checked yetcites [50] Mobley, B. A. & Eisenberg, B. R. Sizes of components in frog skeletal muscle measured by methods of stereology. J. Gen. Physiol. 66, 31–45 (1975). source
boosted- Asserted: passes — The authors put it forward as true.
- Checkable: passes — It can be checked against evidence.
- Load-bearing: passes — The paper’s conclusions depend on it.
- Based: passes — The paper gives a reason why it holds.
Probably not a substantial claim.
What the paper did — it cites no source for this, so there is none to check. The quote shows it is in the paper.
In the paper
“Only mitochondria which were entirely visualized in the micrograph were measured.”
§ DRP1-mediated mitochondrial shape controls calcium homeostasis and muscle mass > Methods > Quantitative analyses of the mitochondria
plain- Asserted: passes — The authors put it forward as true.
- Checkable: passes — It can be checked against evidence.
- Load-bearing: fails — The paper’s conclusions may not depend on it.
- Based: passes — The paper gives a reason why it holds.
Probably not a substantial claim. The paper’s conclusions may not depend on it.
None of the sources cited for this claim have been checked yet.
In the paper
“In vivo protein synthesis was measured by using the SUnSET technique25,60.”
§ DRP1-mediated mitochondrial shape controls calcium homeostasis and muscle mass > Methods > In vivo protein synthesis measurements
What the sources say
- Not checked yetcites [25] Schmidt, E. K., Clavarino, G., Ceppi, M. & Pierre, P. SUnSET, a nonradioactive method to monitor protein synthesis. Nat. Methods 6, 275–277 (2009). source
- Not checked yetcites [60] Goodman, C. A. et al. Novel insights into the regulation of skeletal muscle protein synthesis as revealed by a new nonradioactive in vivo technique. FASEB J. 25, 1028–1039 (2011). source
plain- Asserted: passes — The authors put it forward as true.
- Checkable: passes — It can be checked against evidence.
- Load-bearing: fails — The paper’s conclusions may not depend on it.
- Based: passes — The paper gives a reason why it holds.
Probably not a substantial claim. The paper’s conclusions may not depend on it.
What the paper did — it cites no source for this, so there is none to check. The quote shows it is in the paper.
In the paper
“The results were normalized to citrate synthase enzymatic activity.”
§ DRP1-mediated mitochondrial shape controls calcium homeostasis and muscle mass > Methods > Mitochondrial assays
plain- Asserted: passes — The authors put it forward as true.
- Checkable: passes — It can be checked against evidence.
- Load-bearing: fails — The paper’s conclusions may not depend on it.
- Based: passes — The paper gives a reason why it holds.
Probably not a substantial claim. The paper’s conclusions may not depend on it.
What the paper did — it cites no source for this, so there is none to check. The quote shows it is in the paper.
In the paper
“Micrographs of non-overlapping regions were randomly collected from transversal and longitudinal sections of internal fiber areas of EDL muscles.”
§ DRP1-mediated mitochondrial shape controls calcium homeostasis and muscle mass > Methods > Quantitative analyses of the mitochondria
plain- Asserted: passes — The authors put it forward as true.
- Checkable: passes — It can be checked against evidence.
- Load-bearing: passes — The paper’s conclusions depend on it.
- Based: passes — The paper gives a reason why it holds.
Probably not a substantial claim.
The paper relies on this without support.
Mitochondrial quality control is essential in highly structured cells such as neurons and muscles.
“Mitochondrial quality control is essential in highly structured cells such as neurons and muscles.”
The paper relies on this without support.
Insulin signaling through mTOR plays a critical role in controlling protein synthesis.
“Insulin signaling, through mTOR, plays a critical role in controlling protein synthesis.”
The paper relies on this without support.
FGF21 causes GH resistance.
“Because FGF21 causes GH resistance”
The authors state this as an assumption.
The calibration equation and constants (KD = 145 nM, Rmin, Rmax, β) used to convert Fura-2 fluorescence ratios to free cytosolic calcium concentration are valid.
“Under these assumptions, the resting cytosolic calcium concentration will be 71 nM at R = 0.87 and 87 nM at R = 0.92.”
Claims other papers make about this one
Each is checked against this paper’s own text: does it say what the citing paper says it does?
The cited source doesn’t support the claim as written.
In the citing paper
“Conversely, DRP1 ablation alters calcium homeostasis and mitochondria–ER tethering resulting in myofiber degeneration but with normal animal survival78.”
From Mechanisms of muscle atrophy and hypertrophy: implications in health and disease (2021) · cites this paper as [78]
Checked by a reasoning model — may be wrong.
Experimental — accuracy not yet measuredThe source backs part of the claim, not all of it — or backs it for a different population, condition or comparison.
In the citing paper
“Interestingly, the stress-response myokine FGF21 is dramatically increased in muscle and serum of all these three models, even if with a different degree.”
From The connection between the dynamic remodeling of the mitochondrial network and the regulation of muscle mass (2021) · cites this paper as [196]
Experimental — accuracy not yet measuredThe cited source says what the claim attributes to it.
In the citing paper
“In rodent genetic models, these findings indicate that mitophagy, mitochondrial fusion, and fission are essential for skeletal muscle health (Dulac et al., 2020; Favaro et al., 2019; Tezze et al., 2017).”
From Autophagy gene expression in skeletal muscle of older individuals is associated with physical performance, muscle volume and mitochondrial function in the study of muscle, mobility and aging ( SOMMA ) (2024) · cites this paper as Favaro et al., 2019
The cited source says what the claim attributes to it.
In the citing paper
“There is strong evidence in skeletal muscle that supports a causal link between the dysregulation of mitochondrial fission and alterations in muscle maintenance [152, 196, 197, 210, 211].”
From The connection between the dynamic remodeling of the mitochondrial network and the regulation of muscle mass (2021) · cites this paper as [196]
The cited source says what the claim attributes to it.
In the citing paper
“Accordingly, the failure in mitochondrial-shaping processes has detrimental consequences for the maintenance of muscle mass and function [4,5,6,7,8,13,29].”
From Inhibition of the Fission Machinery Mitigates OPA1 Impairment in Adult Skeletal Muscles (2019) · cites this paper as [8]
In the citing paper
“Consistently, knockout mice for the fusion protein OPA1 or the fission component DRP1 display muscle wasting77,78.”
From Mechanisms of muscle atrophy and hypertrophy: implications in health and disease (2021) · cites this paper as [78]
In the citing paper
“Impairment of fission leads to the disruption of selective mitochondrial autophagic degradation, followed by dysfunctional organelles accumulation [58, 196–200].”
From The connection between the dynamic remodeling of the mitochondrial network and the regulation of muscle mass (2021) · cites this paper as [196]
In the citing paper
“Consistent with this crucial role, conditional ablation of DRP1 in the heart, brain, and skeletal muscle causes lethality [196, 198–200, 208, 209].”
From The connection between the dynamic remodeling of the mitochondrial network and the regulation of muscle mass (2021) · cites this paper as [196]
In the citing paper
“Early deletion of DRP1 in skeletal muscle during embryogenesis resulted in reduced postnatal growth and premature lethality, while its acute ablation in adulthood causes muscle loss and degeneration [196].”
From The connection between the dynamic remodeling of the mitochondrial network and the regulation of muscle mass (2021) · cites this paper as [196]
In the citing paper
“FGF21 serum levels are lower in DRP1 knockout mice than OPA1-null mice.”
From The connection between the dynamic remodeling of the mitochondrial network and the regulation of muscle mass (2021) · cites this paper as [196]
In the citing paper
“OPA1 inhibition triggers IL6 and IL1 upregulation via ROS [187], while the ablation of DRP1 does not alter the expression of inflammatory cytokines [196].”
From The connection between the dynamic remodeling of the mitochondrial network and the regulation of muscle mass (2021) · cites this paper as [196]
In the citing paper
“In DRP1-null muscles, the sarcoplasmic reticulum's calcium stores are unchanged, while abnormal elongated mitochondria display increased MCU-dependent mitochondrial Ca2 + uptake capacity, leading to myofiber death and muscle regeneration [196].”
From The connection between the dynamic remodeling of the mitochondrial network and the regulation of muscle mass (2021) · cites this paper as [196]
In the citing paper
“Early deletion of DRP1 in skeletal muscle during embryogenesis resulted in reduced postnatal growth and premature lethality, while its acute ablation in adulthood causes muscle loss and degeneration [196].”
From The connection between the dynamic remodeling of the mitochondrial network and the regulation of muscle mass (2021) · cites this paper as [196]
In the citing paper
“Mechanistically, DRP1 inhibition induced autophagy and mitophagy impairment, MCU upregulation and mitochondrial calcium overload, ER stress, UPR activation, and FGF21 induction.”
From The connection between the dynamic remodeling of the mitochondrial network and the regulation of muscle mass (2021) · cites this paper as [196]
In the citing paper
“In muscles, the Drp1 inhibition causes muscle weakness and wasting that is consequent to an abnormal calcium homeostasis [8].”
From Inhibition of the Fission Machinery Mitigates OPA1 Impairment in Adult Skeletal Muscles (2019) · cites this paper as [8]
In the citing paper
“Emerging evidence suggested that apart from energy production, mitochondria perform other critical functions to maintain homeostasis and function in the skeletal myocytes, including regulation of intracellular Ca2+ homeostasis, modulation of cell proliferation, and integration of apoptotic signaling (17–19).”
From From mitochondria to sarcopenia: role of 17β-estradiol and testosterone (2023) · cites this paper as [18]
In the citing paper
“Additionally, muscle-specific ablation of DRP1 induces severe muscle wasting and weakness, as well as abnormal morphology, function, and Ca2+ homeostasis in mitochondria (18).”
From From mitochondria to sarcopenia: role of 17β-estradiol and testosterone (2023) · cites this paper as [18]
In the citing paper
“indicating that Drp1 is a key player in regulating skeletal muscle development and maintenance.”
From Mitochondrial Dynamics and Mitophagy in Skeletal Muscle Health and Aging (2021) · cites this paper as [42]
In the citing paper
“Muscle-specific Drp1 knockout in mice leads to a severe myopathic phenotype including muscle wasting, weakness, and signs of muscle degeneration and regeneration [42].”
From Mitochondrial Dynamics and Mitophagy in Skeletal Muscle Health and Aging (2021) · cites this paper as [42]
In the citing paper
“Taken altogether, the findings discussed above clearly indicate that mitochondrial fission is essential for skeletal muscle health.”
From Mitochondrial Dynamics and Mitophagy in Skeletal Muscle Health and Aging (2021) · cites this paper as [42]
In the citing paper
“deletion or insufficient expression of Drp1 in skeletal muscle led to 40–50% atrophy [42,43]”
From Mitochondrial Dynamics and Mitophagy in Skeletal Muscle Health and Aging (2021) · cites this paper as [42]
Self-check
Percentages, sums and reported differences re-computed from the paper’s own numbers.
Each contradiction between two passages listed here was confirmed by an independent check.
Rated major: it would touch a result — a value a result rests on, reported and recomputed p-values on opposite sides of the significance level, two passages that conflict with no sign which is right, or a cited work retracted before this paper was published.
In the paper
§ DRP1-mediated mitochondrial shape controls calcium homeostasis and muscle mass > Results > Muscle-specific Drp1 deletion results in postnatal lethality
“Muscles displayed a reduction in the total number of fibers (Supplementary Fig. 1e) because glycolytic type 2B/2X fibers are less than controls (Fig. 1f)”
§ DRP1-mediated mitochondrial shape controls calcium homeostasis and muscle mass > Results > Muscle-specific Drp1 deletion results in postnatal lethality
“The cross-sectional area analysis of fibers (g) and the total number of different fiber types in hindlimb muscles (f) indicate a reduction of DRP1 KO fiber size without hypoplasia.”
Rated minor: it would not touch a result — a value no result rests on, a p-value that stays on the same side of the significance level, or a conflict that is clerical, resolved elsewhere in the paper, or outside its own findings.
In the paper
§ DRP1-mediated mitochondrial shape controls calcium homeostasis and muscle mass > Methods > Free calcium concentration in the cytosol
“Ca2+ measurements were expressed as fluorescence ratio of the emission at 480 nm with reference to the excitation wavelengths of 360 and 380 nm, respectively.”
§ DRP1-mediated mitochondrial shape controls calcium homeostasis and muscle mass > Methods > Free calcium concentration in the cytosol
“where R is the ratio of fluorescence excited at 340 nm to that excited at 380 nm”
Citations
Cites
Fiji: an open-source platform for biological-image analysis
Schindelin, J., Arganda-Carreras, I., Frise, E., Kaynig, V., Longair, M., Pietzsch, T., Preibisch, S., Rueden, C., Saalfeld, S., Schmid, B., et al. (2012) · Nature Methods · doi:10.1038/nmeth.2019 · Cited by 66,890
Sandri, M., Sandri, C., Gilbert, A., Skurk, C., Calabria, E., Picard, A., Walsh, K., Schiaffino, S., Lecker, S. H., & Goldberg, A. L. (2004) · Cell · doi:10.1016/s0092-8674(04)00400-3 · Cited by 3,012
Self-citationA forty-kilodalton protein of the inner membrane is the mitochondrial calcium uniporter
Stefani, D. D., Raffaello, A., Teardo, E., Szabó, I., & Rizzuto, R. (2011) · Nature · doi:10.1038/nature10230 · Cited by 1,957
FoxO3 Controls Autophagy in Skeletal Muscle In Vivo
Mammucari, C., Milan, G., Romanello, V., Masiero, E., Rudolf, R., Del Piccolo, P., Burden, S. J., Di Lisi, R., Sandri, C., Zhao, J., et al. (2007) · Cell Metabolism · doi:10.1016/j.cmet.2007.11.001 · Cited by 1,953
Self-citationDynamin-related Protein Drp1 Is Required for Mitochondrial Division in Mammalian Cells
Smirnova, E., Griparić, L., Shurland, D., & van der Bliek, A. M. (2001) · Molecular Biology of the Cell · doi:10.1091/mbc.12.8.2245 · Cited by 1,938
SUnSET, a nonradioactive method to monitor protein synthesis
Schmidt, E. K., Clavarino, G., Ceppi, M., & Pierre, P. (2009) · Nature Methods · doi:10.1038/nmeth.1314 · Cited by 1,706
Mechanisms regulating skeletal muscle growth and atrophy
Schiaffino, S., Dyar, K. A., Ciciliot, S., Blaauw, B., & Sandri, M. (2013) · The FEBS Journal · doi:10.1111/febs.12253 · Cited by 1,492
Self-citationZhao, J., Brault, J. J., Schild, A., Cao, P., Sandri, M., Schiaffino, S., Lecker, S. H., & Goldberg, A. L. (2007) · Cell Metabolism · doi:10.1016/j.cmet.2007.11.004 · Cited by 1,489
Self-citationAutophagy is required to maintain muscle mass.
Masiero, E., Agatea, L., Mammucari, C., Blaauw, B., Loro, E., Komatsu, M., Metzger, D., Reggiani, C., Schiaffino, S., & Sandri, M. (2009) · Cell Metabolism · doi:10.1016/j.cmet.2009.10.008 · Cited by 1,282
Self-citationCogliati, S., Frezza, C., Soriano, M. E., Varanita, T., Quintana-Cabrera, R., Corrado, M., Cipolat, S., Costa, V., Casarin, A., Gomes, L. C., et al. (2013) · Cell · doi:10.1016/j.cell.2013.08.032 · Cited by 1,265
Self-citation
Cited by
Sorted by citations
Items 201–300 of 397
Interactions of mitochondrial and skeletal muscle biology in mitochondrial myopathy
Leo, V. D., Gomes, T. M. B., & Vincent, A. E. (2023) · Biochemical Journal · doi:10.1042/bcj20220233 · Cited by 18
Mitochondrial nucleoid condensates drive peripheral fission through high membrane curvature
Chen, Q., Liu, L., Tian, Z., Fang, Z., Wang, K., Shao, X., Zhang, C., Zou, W., Rowan, F., Qiu, K., et al. (2023) · Cell Reports · doi:10.1016/j.celrep.2023.113472 · Cited by 18
Spurlock, B., Parker, D., Basu, M., Hjelmeland, A., Sajina, G., Liu, S., Siegal, G., Gunter, A., Moran, A., & Mitra, K. (2021) · eLife · doi:10.7554/elife.68394 · Cited by 17
Coen, P. M., Huo, Z., Tranah, G. J., Barnes, H. N., Zhang, X., Wolff, C. A., Wu, K., Cawthon, P. M., Hepple, R. T., Toledo, F. G. S., et al. (2024) · Aging Cell · doi:10.1111/acel.14118 · Cited by 17
“In rodent genetic models, these findings indicate that mitophagy, mitochondrial fusion, and fission are essential for skeletal muscle health (Dulac et al., 2020 ; Favaro et al., 2019; Tezze et al., 2017 ).”
BackgroundSarkar, A., Hameed, R., Mishra, A., Bhatta, R. S., & Nazir, A. (2021) · Life Sciences · doi:10.1016/j.lfs.2021.120226 · Cited by 17
Marshall, R. N., Smeuninx, B., Seabright, A. P., Morgan, P. T., Atherton, P. J., Philp, A., & Breen, L. (2022) · Physiological Reports · doi:10.14814/phy2.15345 · Cited by 17
Regulation of diurnal energy balance by mitokines
Klaus, S., Gil, C. I., & Ost, M. (2021) · Cellular and Molecular Life Sciences · doi:10.1007/s00018-020-03748-9 · Cited by 19
Trib1 deficiency causes brown adipose respiratory chain depletion and mitochondrial disorder
Zhang, X., Zhang, B., Zhang, C., Sun, G., & Sun, X. (2021) · Cell Death and Disease · doi:10.1038/s41419-021-04389-x · Cited by 17
Impaired endothelial function contributes to cardiac dysfunction: role of mitochondrial dynamics
Gutierrez‐Huerta, C. A., Quiroz-Delfi, G., Faleel, F. D. M., & Beyer, A. (2024) · American Journal of Physiology-Heart and Circulatory Physiology · doi:10.1152/ajpheart.00531.2024 · Cited by 18
Brocca, L., Rossi, M., Canepari, M., Bottinelli, R., & Pellegrino, M. A. (2021) · International Journal of Molecular Sciences · doi:10.3390/ijms23010148 · Cited by 17
Mitophagy-mediated inflammation and oxidative stress contribute to muscle wasting in cancer cachexia
Zhang, Z., Tan, S., Li, S., Cheng, Y.-X., Wang, J., Liu, H., Yan, M., & Wu, G. (2023) · Journal of Clinical Biochemistry and Nutrition · doi:10.3164/jcbn.23-1 · Cited by 16
Cancer-associated muscle weakness - From triggers to molecular mechanisms
Shorter, E., Engman, V., & Lanner, J. T. (2024) · Molecular Aspects of Medicine · doi:10.1016/j.mam.2024.101260 · Cited by 22
Gilkerson, R., Kaur, H., Carrillo, O., & Ramos, I. (2024) · International Journal of Molecular Sciences · doi:10.3390/ijms25084566 · Cited by 16
The involvement of autophagy in the maintenance of endothelial homeostasis: The role of mitochondria
Dymkowska, D. (2021) · Mitochondrion · doi:10.1016/j.mito.2020.12.013 · Cited by 15
Conte, E., Pannunzio, A., Imbrici, P., Camerino, G. M., Maggi, L., Mora, M., Gibertini, S., Cappellari, O., Luca, A. D., Coluccia, M., et al. (2021) · Frontiers in Cell and Developmental Biology · doi:10.3389/fcell.2021.635063 · Cited by 16
Huang, D., Yang, L., Guo, Y., Weng, M., Ye, H., Zhang, T., Lin, F., Zhang, K., & Fang, X. (2025) · Communications Biology · doi:10.1038/s42003-025-07654-3 · Cited by 15
Lin, A. J., Joshi, A. U., Mukherjee, R., Tompkins, C. A., Vijayan, V., Mochly‐Rosen, D., & Haileselassie, B. (2021) · Shock · doi:10.1097/shk.0000000000001885 · Cited by 15
Yuan, Y., Li, Z., Li, M., Jin, T., Zhang, X., Liu, X., & Hao, J. (2022) · Toxicology in Vitro · doi:10.1016/j.tiv.2022.105436 · Cited by 16
Identification of evolutionarily conserved regulators of muscle mitochondrial network organization
Katti, P., Ajayi, P. T., Aponte, A. M., Bleck, C. K. E., & Glancy, B. C. (2022) · Nature Communications · doi:10.1038/s41467-022-34445-9 · Cited by 17
Factors, mechanisms and improvement methods of muscle strength loss
Wang, K., Wang, X., & Wang, Y. (2024) · Frontiers in Cell and Developmental Biology · doi:10.3389/fcell.2024.1509519 · Cited by 18
King, W. T., Axelrod, C. L., Zunica, E. R. M., Noland, R. C., Davuluri, G., Fujioka, H., Tandler, B., Belmont, K. P., Hermann, G. E., Rogers, R. C., et al. (2021) · Journal of Biological Chemistry · doi:10.1016/j.jbc.2021.101196 · Cited by 15
Baraldo, M., Zorzato, S., Dondjang, A. H. T., Geremia, A., Nogara, L., Dumitras, A. G., Canato, M., Marcucci, L., Nolte, H., & Blaauw, B. (2022) · The Journal of Physiology · doi:10.1113/jp283686 · Cited by 17
Self-citationMatteis, V. D., Rizzello, L., Ingrosso, C., & Rinaldi, R. (2021) · Environmental Science and Pollution Research · doi:10.1007/s11356-020-12267-w · Cited by 15
Cheng, K. Y.-K., Bao, Z., Long, Y., Liu, C., Huang, T., Cui, C., Chow, S. K.-H., Wong, R. M. Y., & Cheung, W.-H. (2023) · Subcellular Biochemistry · doi:10.1007/978-3-031-26576-1_6 · Cited by 14
Liang, X., & Dang, S. (2021) · Pharmacogenomics and Personalized Medicine · doi:10.2147/pgpm.s314860 · Cited by 16
The critical roles of STING in mitochondrial homeostasis
Zou, S., Wang, B., Yi, K., Su, D., Chen, Y., Li, N., & Geng, Q. (2023) · Biochemical Pharmacology · doi:10.1016/j.bcp.2023.115938 · Cited by 17
Propofol-induced hippocampal Neurotoxicity: A mitochondrial perspective
Ebrahimi, M., Dabbagh, A., & Madadi, F. (2024) · Brain Research · doi:10.1016/j.brainres.2024.148841 · Cited by 15
Figueroa‐Toledo, A. M., Gutiérrez‐Pino, J., Carriel‐Nesvara, A., Marchese‐Bittencourt, M., Zbinden‐Foncea, H., & Castro‐Sepúlveda, M. (2024) · The Journal of Physiology · doi:10.1113/jp285955 · Cited by 14
Aging Science Talks: The role of miR-181a in age-related loss of muscle mass and function
Borja-Gonzalez, M., Casas-Martinez, J. C., McDonagh, B., & Goljanek‐Whysall, K. (2020) · Translational Medicine of Aging · doi:10.1016/j.tma.2020.07.001 · Cited by 14
Edwards, S. J., Shad, B. J., Marshall, R. N., Morgan, P. T., Wallis, G. A., & Breen, L. (2021) · Journal of Applied Physiology · doi:10.1152/japplphysiol.00650.2021 · Cited by 14
Deng, Z., Chen, X., Zhang, R., Kong, L., Yang, F., Guo, J., Shen, B. Q., & Zhang, L. (2024) · Stroke and Vascular Neurology · doi:10.1136/svn-2023-003080 · Cited by 13
Luo, W., Xu, Z., Li, F., Ding, L., Wang, R., Lin, Y., Mao, X., Chen, X., Li, Y., Lu, Z., et al. (2024) · Advanced Science · doi:10.1002/advs.202404033 · Cited by 14
Age and sex-specific changes in mitochondrial quality control in skeletal and cardiac muscle
Springer, C. B., Ogbara, O., Silva, M. C. D., Henderson, A., Liu, Y., Prior, S. J., & Kuzmiak‐Glancy, S. (2025) · Frontiers in Aging · doi:10.3389/fragi.2025.1606110 · Cited by 13
Bonora, M., Kahsay, A., & Pinton, P. (2021) · International review of cytology · doi:10.1016/bs.ircmb.2021.05.003 · Cited by 16
Goyal, S., Tiwari, S., Seth, B., Phoolmala, Tandon, A., & Chaturvedi, R. K. (2022) · Molecular Neurobiology · doi:10.1007/s12035-022-02862-y · Cited by 11
Chen, Q., Huang, W., Çapanoğlu, E., Amrouche, A. T., & Lu, B. (2023) · Food Frontiers · doi:10.1002/fft2.261 · Cited by 12
Ozcebe, S. G., Tristan, M., & Zorlutuna, P. (2025) · Stem Cells · doi:10.1093/stmcls/sxaf005 · Cited by 16
Alterations in peroxisome-mitochondria interplay in skeletal muscle accelerate muscle dysfunction
Scalabrin, M., Turco, E., Davigo, I., Filadi, R., Nogara, L., Gherardi, G., Barazzuol, L., Armani, A., Trani, G., Negro, S., et al. (2025) · Nature Communications · doi:10.1038/s41467-025-64833-w · Cited by 15
Self-citationMitochondrial dynamics: roles in exercise physiology and muscle mass regulation
Djalalvandi, A., & Scorrano, L. (2022) · Current Opinion in Physiology · doi:10.1016/j.cophys.2022.100550 · Cited by 14
Self-citationChoi, M., & Kang, K. W. (2022) · Biochimica et Biophysica Acta (BBA) - Molecular Basis of Disease · doi:10.1016/j.bbadis.2022.166570 · Cited by 12
Su, F., Sui, X. Y., Xu, J., Liu, Q., Li, J., Liu, W., Xu, Y., Zhang, Z., & Tao, F. (2023) · European Journal of Pharmacology · doi:10.1016/j.ejphar.2023.176188 · Cited by 14
PRKAR1A deficiency impedes hypertrophy and reduces heart size
Liu, Y., Xia, P., Chen, J., Bandettini, W. P., Kirschner, L. S., Stratakis, C. A., & Cheng, Z. (2020) · Physiological Reports · doi:10.14814/phy2.14405 · Cited by 12
Xu, C. B., Wang, B., Li, M., Dong, Z., Chen, N., Duan, J., Ye, Z., Mingfeng, J., Chen, R., & Yuan, W. (2023) · Cellular Signalling · doi:10.1016/j.cellsig.2023.110939 · Cited by 11
Deng, X., Zhu, M., Liu, Y., Zhang, N., Zhang, P., Zeng, W., & Ke, M. (2024) · Antioxidants and Redox Signaling · doi:10.1089/ars.2023.0502 · Cited by 11
Chau, P. K., Ryan, E., Dalen, K. T., & Haugen, F. (2024) · Journal of Thermal Biology · doi:10.1016/j.jtherbio.2024.103938 · Cited by 11
Integrating Mitochondrial Biology into Innovative Cell Therapies for Neurodegenerative Diseases
Ore, A., Angelastro, J. M., & Giulivi, C. (2024) · Brain Sciences · doi:10.3390/brainsci14090899 · Cited by 14
Aging triggers mitochondrial, endoplasmic reticulum, and metabolic stress responses in the heart
Muthu, S., Tran, Z., Thilagavathi, J., Bolarum, T., Azzam, E. I., Suzuki, C. K., & Venkatesh, S. (2025) · The Journal of Cardiovascular Aging · doi:10.20517/jca.2024.17 · Cited by 12
Kugler, B. A., Deng, W., Francois, B., Anderson, M. C., Hinkley, J. M., Houmard, J. A., Gona, P. N., & Zou, K. (2020) · Medicine & Science in Sports & Exercise · doi:10.1249/mss.0000000000002580 · Cited by 12
Greif, C. E., Mertens, R. T., Berger, G., Parkin, S., & Awuah, S. G. (2023) · RSC Chemical Biology · doi:10.1039/d3cb00051f · Cited by 11
You, Y., Chen, L., Wu, Y., Wang, M., Lu, H., Zhou, X., Liu, H., Fu, Z., He, Q., Ou, J., et al. (2020) · Cell Transplantation · doi:10.1177/0963689720950213 · Cited by 11
Shemer, S. (2026) · Journal of Biological Chemistry · doi:10.1016/j.jbc.2026.111229 · Cited by 11
Mitochondrial disorders as a mechanism for the development of obese Sarcopenia
Liao, T., Xiong, L., Wang, X., Yang, S., & Liang, Z. (2023) · Diabetology & Metabolic Syndrome · doi:10.1186/s13098-023-01192-w · Cited by 10
Rosen, H. G., BERGER, N. J. A., Hodge, S. N., Fujishiro, A. A., Lourie, J., Kapadia, V., Duzz, T., Linden, M. A., Jee, E., Kim, J., et al. (2025) · American Journal of Physiology-Cell Physiology · doi:10.1152/ajpcell.01009.2024 · Cited by 10
Li, Y., Yu, X., Xiao, T., Chi, H.-L., Zhu, G., & Kang, Y. (2021) · Cardiovascular Toxicology · doi:10.1007/s12012-021-09641-6 · Cited by 9
Zhang, J., Peng, Y., Fu, W., Wang, R., Cao, J., Li, S., Tian, X., Li, Z., Hua, C., Zhai, Y., et al. (2024) · Cell Death Discovery · doi:10.1038/s41420-024-01907-6 · Cited by 10
Talk to Me—Interplay between Mitochondria and Microbiota in Aging
Endres, K., & Friedland, K. (2023) · International Journal of Molecular Sciences · doi:10.3390/ijms241310818 · Cited by 9
Voos, K. M., TZENG, J., Patel, P., Rubinsky, S., Choi, H. E., Pharr, T., Sookram, S., Baur, J. A., Soderblom, E. J., & Lorenzo, D. N. (2025) · Nature Communications · doi:10.1038/s41467-025-62977-3 · Cited by 10
Marshall, R. N., McKendry, J., Smeuninx, B., Seabright, A. P., Morgan, P. T., Greig, C. A., & Breen, L. (2023) · Frontiers in Physiology · doi:10.3389/fphys.2022.1097988 · Cited by 8
Moon, S. H., Dilthey, B. G., Guan, S., Sims, H. F., Pittman, S. K., Keith, A. L., Jenkins, C. M., Weihl, C. C., & Gross, R. W. (2023) · iScience · doi:10.1016/j.isci.2023.106895 · Cited by 8
Enhanced mitochondrial buffering prevents Ca 2+ overload in naked mole‐rat brain
Cheng, H., Perkins, G. A., Ju, S., Keun-young Kim, A., Ellisman, M. H., & Pamenter, M. E. (2023) · The Journal of Physiology · doi:10.1113/jp285002 · Cited by 8
Carriel‐Nesvara, A., Muñoz-Medina, C., Deldicque, L., & Castro‐Sepúlveda, M. (2025) · The Journal of Physiology · doi:10.1113/jp289019 · Cited by 8
Li, Y.-C., Wu, S.-X., Zou, Q.-Y., Zheng, Y., Wu, Z., Zhao, X., Gao, X., Yang, Y., & Du, L. (2025) · Food Research International · doi:10.1016/j.foodres.2025.117086 · Cited by 7
RNA signaling in skeletal muscle: the central role of microRNAs and exosomal microRNAs
Liu, S., & Dong, H. (2025) · Frontiers in Cell and Developmental Biology · doi:10.3389/fcell.2025.1639123 · Cited by 10
Farhana, F., Sultana, M. A., Hia, R. A., & Hegde, V. K. (2025) · Neuroscience & Biobehavioral Reviews · doi:10.1016/j.neubiorev.2025.106501 · Cited by 8
Liu, Y., Luo, Z., Liao, Z., Wang, M., Zhou, Y., Luo, S., Ding, Y., Liu, T., Cao, C., & Yue, S. (2022) · Frontiers in Cardiovascular Medicine · doi:10.3389/fcvm.2022.837142 · Cited by 7
Kim, J. H., Lee, H., Kim, J. M., Lee, B., Kim, I., Pak, K., Jeon, Y. K., & Keun-young Kim, A. (2022) · Food Science & Nutrition · doi:10.1002/fsn3.2750 · Cited by 8
Diaphragm Fatigue in SMNΔ7 Mice and Its Molecular Determinants: An Underestimated Issue
Cadile, F., Recchia, D., Ansaldo, M., Rossi, P., Rastelli, G., Boncompagni, S., Brocca, L., Pellegrino, M. A., & Canepari, M. (2023) · International Journal of Molecular Sciences · doi:10.3390/ijms241914953 · Cited by 7
Self-citationFlores-Sierra, J. D. J., Muciño-Arellano, M. D. R., Romo-Morales, G. D. C., Sánchez-Palafox, J. E., Correa-Navarro, V. A., Colín‐Castelán, D., Pérez‐Vázquez, V., Rangel-Salazar, R., Rivera-Bustamante, R. F., de la Rocha, C., et al. (2024) · Journal of Lipid Research · doi:10.1016/j.jlr.2024.100586 · Cited by 8
Mechanistic insights into metabolic function of dynamin-related protein 1
Li, X., Do, K. P., Ysaguirre, J., Mahmud, I., Tan, L., Wei, B., Shao, L. J., Elizondo, M. E., Habib, R., Elizondo, F., et al. (2024) · Journal of Lipid Research · doi:10.1016/j.jlr.2024.100633 · Cited by 7
Paliwal, S., Fiumera, H. L., & Mohanty, S. (2020) · Mitochondrion · doi:10.1016/j.mito.2020.10.002 · Cited by 7
Muscle and Bone Defects in Metastatic Disease
Pauk, M., Saito, H., Hesse, E., & Taipaleenmäki, H. (2022) · Current Osteoporosis Reports · doi:10.1007/s11914-022-00741-y · Cited by 8
DISC1 as a prognostic biomarker correlated with immune infiltrates in gastric cancer
Zheng, S., Chen, Y., Yu, S., Weng, C., Lin, N., Luo, Z., Wang, Y., Xiong, P., Teng, Z., Wang, Y., et al. (2023) · Heliyon · doi:10.1016/j.heliyon.2023.e15058 · Cited by 7
Esteca, M. V., Divino, I. A., da Silva, A. L. V., Severino, M. B., Braga, R. R., Ropelle, E. R., Simabuco, F. M., & Baptista, I. L. (2024) · Acta Physiologica · doi:10.1111/apha.14111 · Cited by 8
Silva-Veiga, F. M., Miranda, C. S., Santana-Oliveira, D. A., Fernandes‐da‐Silva, A., Mandarim‐de‐Lacerda, C. A., & Souza‐Mello, V. (2025) · Obesity Research & Clinical Practice · doi:10.1016/j.orcp.2025.03.007 · Cited by 6
Protective Effect of Delta-Like 1 Homolog Against Muscular Atrophy in a Mouse Model
Lee, J. Y., Lee, M., Lee, D.-H., Lee, Y., Lee, B., Kang, E. S., & Soo, B. (2022) · Endocrinology and Metabolism · doi:10.3803/enm.2022.1446 · Cited by 6
Jang, J., Kim, Y., Song, T., Park, S., Kim, H., Koh, J., Cho, Y., Park, S., Sadayappan, S., Kwak, H., et al. (2024) · Journal of Cachexia Sarcopenia and Muscle · doi:10.1002/jcsm.13519 · Cited by 8
Zhao, N., Michelucci, A., Pietrangelo, L., Malik, S., Groom, L. A., Leigh, J., O’Connor, T. N., Takano, T., Kingsley, P. D., Palis, J., et al. (2024) · The EMBO Journal · doi:10.1038/s44318-024-00273-4 · Cited by 7
Self-citationWang, D., Chen, W., Bi, Q., Zong, X., Ruan, J., Yin, X., Wang, J., Zhang, H., & Ji, X. (2020) · Frontiers in Oncology · doi:10.3389/fonc.2020.523577 · Cited by 6
Li, X., Zhao, J., Lv, Q., Tian, Y., Zhang, L., & Liu, T. (2022) · The Anatomical Record · doi:10.1002/ar.24889 · Cited by 6
Kitaoka, Y., Watanabe, D., Nonaka, Y., Yagishita, K., Kano, Y., & Hoshino, D. (2019) · Physiological Reports · doi:10.14814/phy2.14266 · Cited by 6
Yanagi, T., Kitamura, S., Imafuku, K., Suto, A., Maeda, T., Tanaka, S., Sesaki, H., Abe, R., & Shimizu, H. (2020) · Journal of Dermatological Science · doi:10.1016/j.jdermsci.2020.06.009 · Cited by 6
Recent advances in cell‐based and cell‐free therapeutic approaches for sarcopenia
Wu, S., Lin, S., Zhang, X., Alizada, M., Wang, L., Zheng, Y., Ke, Q., & Xu, J. (2022) · The FASEB Journal · doi:10.1096/fj.202200675r · Cited by 7
Espinosa, A., Casas, M., & Jaimovich, E. (2023) · Preprints.org · doi:10.20944/preprints202305.2112.v1 · Cited by 6
Rosen, H. G., BERGER, N. J. A., Hodge, S. N., Fujishiro, A. A., Lourie, J., Kapadia, V., Linden, M. A., Jee, E., Kim, J., Kim, Y., et al. (2024) · bioRxiv (Cold Spring Harbor Laboratory) · doi:10.1101/2024.12.26.628172 · Cited by 6
Custom-made 3D-printed boot as a model of disuse-induced atrophy in murine skeletal muscle
Masiero, G., Ferrarese, G., Perazzolo, E., Baraldo, M., Nogara, L., & Tezze, C. (2024) · PLoS ONE · doi:10.1371/journal.pone.0304380 · Cited by 5
Self-citationFan, H., Yang, Z., Ying, H., Zhao, J., Wang, X., Gong, J., Li, L., Liu, X., Gong, T., Ke, Q., et al. (2025) · Redox Biology · doi:10.1016/j.redox.2025.103638 · Cited by 5
Bile Acids Alter the Autophagy and Mitogenesis in Skeletal Muscle Cells
Tacchi, F., Orozco-Aguilar, J., Valero‐Breton, M., & Cabello‐Verrugio, C. (2023) · Advances in experimental medicine and biology · doi:10.1007/978-3-031-26163-3_10 · Cited by 5
Gao, X., Liu, J. P., Jia, B., & Guo, J. (2025) · Journal of Biochemical and Molecular Toxicology · doi:10.1002/jbt.70258 · Cited by 5
Splitting up to heal: mitochondrial shape regulates signaling for focal membrane repair
Horn, A. J., & Jaiswal, J. K. (2020) · Biochemical Society Transactions · doi:10.1042/bst20200120 · Cited by 5
Lu, F., Zhang, Q., Zhang, M., Sun, S., Yang, X., & Yan, H. (2022) · Journal of Applied Toxicology · doi:10.1002/jat.4328 · Cited by 5
Chen, J., Yue, F., Kim, K. H., Zhu, P., Qiu, J., Tao, W. A., & Kuang, S. (2023) · bioRxiv (Cold Spring Harbor Laboratory) · doi:10.1101/2023.08.03.551853 · Cited by 5
Adult Human Heart ECM Improves Human iPSC-CM Function via Mitochondrial and Metabolic MaturationPreprint
Ozcebe, S. G., Tristan, M., & Zorlutuna, P. (2023) · bioRxiv (Cold Spring Harbor Laboratory) · doi:10.1101/2023.10.31.565062 · Cited by 5
Rahman, F. A., Graham, M. Q., Truong, A., & Quadrilatero, J. (2025) · Journal of Biomedical Science · doi:10.1186/s12929-025-01153-7 · Cited by 4
Mo, H. M. M., & Lee, J. H. (2025) · Muscles · doi:10.3390/muscles4030035 · Cited by 4
Fu, S., Nie, Y., Ping, P., Gao, Z., Zhao, Y., Wang, W., Li, Z., & Liu, Q. (2025) · Chinese Medical Journal · doi:10.1097/cm9.0000000000003757 · Cited by 4
Alway, S. E., Paez, H. G., Ferrandi, P. J., Pitzer, C. R., Halle, J. L., Khan, M. M., Mohamed, J. S., Deschenes, M. R., & Carson, J. A. (2025) · American Journal of Physiology-Cell Physiology · doi:10.1152/ajpcell.00744.2025 · Cited by 4
Downregulation of HHATL promotes cardiac hypertrophy via activation of SHH/DRP1
Xu, J., He, K., Ji, Y., Liu, X., & Dai, Q. (2024) · Experimental Cell Research · doi:10.1016/j.yexcr.2024.114072 · Cited by 4
Robert, A., Crottès, D., Bourgeais, J., Guéguen, N., Chevrollier, A., Dumas, J., Servais, S., Domingo, I., Chadet, S., Sobilo, J., et al. (2024) · PLoS Biology · doi:10.1371/journal.pbio.3002854 · Cited by 5
Oxidative Phosphorylation in Uncoupled Mitochondria
Brunetta, H. S., Mori, M. A., & Bartelt, A. (2025) · BioEssays · doi:10.1002/bies.70038 · Cited by 3
Energy deprivation in youth and old age
Stern, M. (2025) · Journal of Cell Science · doi:10.1242/jcs.264018 · Cited by 3
Metadata
- Authors
- Favaro, G., Romanello, V., Varanita, T., Andrea Desbats, M., Morbidoni, V., Tezze, C., Albiero, M., Canato, M., Gherardi, G., De Stefani, D., Mammucari, C., Blaauw, B., Boncompagni, S., Protasi, F., Reggiani, C., Scorrano, L., Salviati, L., & Sandri, M.
- Affiliations
- University of Padua (IT)
- University of Chieti-Pescara (IT)
- Corresponding author
- Salviati, Leonardo
- Sandri, Marco
- ORCID
- Venue
- Nature Communications
- Published
- 2019-06-12
- Volume
- 10
- Issue
- 1
- Pages
- 2576-2576
- ISSN
- 2041-1723 (ISSN-L)
- PMC
- PMC6561930
- OpenAlex
- W2950169360
- Semantic Scholar
- f4a2921dcb6e0705b3925fc5a9a47319adb62545
- Cited by
- 398
- References
- 62
- Citations by year
- 2026: 30 · 2025: 44 · 2024: 53 · 2023: 62 · 2022: 53 · 2021: 78 · 2020: 67 · 2019: 10
- FWCI
- 17.20
- Type
- journal article
- Language
- en
- Open access
- gold
- doi.org
- Locations
- Nature Communications (publishedVersion, cc-by)
- Europe PMC (PubMed Central) (publishedVersion, cc-by)
- PubMed Central (publishedVersion, cc-by)
- PubMed (publishedVersion)
- RePEc: Research Papers in Economics (submittedVersion)
- DOAJ (DOAJ: Directory of Open Access Journals) (submittedVersion, cc-by-sa)
- DOAJ (DOAJ: Directory of Open Access Journals) (submittedVersion)
- Padua Research Archive (University of Padova) (submittedVersion, cc-by)
- Funders
- Fondazione Cassa di Risparmio di Padova e Rovigo
- European Commission (MSCA-RISE-2014, H2020, 645648, H2020‐MSCA‐RISE‐2014, H2020-MSCA, H2020 MSCA Rise)
- Schweizerischer Nationalfonds zur Förderung der Wissenschaftlichen Forschung (133130)
- Ministero della Salute (GR-2011-02352681)
- Associazione Italiana per la Ricerca sul Cancro (PRIN 2015, 17388, PRIN 2010)
- Horizon 2020 Framework Programme (H2020-MSCA-RISE-2014, H2020-MSCA, H2020-MSCA-RISE, 645648)
- FP7 Ideas: European Research Council (282310)
- Topics
- Life Sciences › Biochemistry, Genetics and Molecular Biology › Molecular Biology › Mitochondrial Function and Pathology
- Life Sciences › Biochemistry, Genetics and Molecular Biology › Molecular Biology › Muscle Physiology and Disorders
- Life Sciences › Biochemistry, Genetics and Molecular Biology › Cell Biology › Autophagy in Disease and Therapy
- Keywords
- Drp1, mitochondrial fission, mitochondrial morphology, calcium homeostasis, muscle atrophy, skeletal muscle, mitochondrial quality control, ubiquitin-proteasome system, unfolded protein response, myofiber degeneration, mitochondrial calcium uptake, sarcopenia, cancer cachexia
- MeSH terms
- Animals, Calcium, Cell Nucleus, Disease Models, Animal, Homeostasis, Humans, Mitochondria, Muscle, Ubiquitins, Mitochondrial Myopathies, Mice, Knockout, Muscle, Skeletal, Dynamins, Proteasome Endopeptidase Complex, Mice, Unfolded Protein Response, Proteolysis, Mitochondrial Dynamics
About these checks
Registry, retraction, Cites and statistics results are computed, not judged, with one exception: a printed reference that no index lists is read once by a model before it counts as a citation error. Claims are extracted by a model and kept only when their quote appears verbatim in the text; each cited source is then checked, with a model’s help, for whether it says what the claim relies on. Those verdicts can be wrong — read the claim’s quote and the cited source before relying on one.
A language model drew the claims from the paper on 2026-10-06, under version 3 of the claim definition (model deepseek-v4.1-flash, prompt extract-v3).
A second model labelled each claim on 2026-10-06 (model jev-1.13-20260917, definition revision gold-guideline-v0.2).
Cited sources are checked with a language model’s help (gpt-6-sol).
Statistics and arithmetic are recomputed, not judged.
Confidence bands are shown only for fields calibrated on our annotated test set. None is calibrated yet, so no band is shown.
What counts as a claim ›How we measure confidence ›How we check this ›
Are you an author, or do you see a problem with this page? Request a review
