

The DOI matches its Crossref record; 11 of the 11 references it cites were found in a registry or an index.
A novel rapamycin analog is highly selective for mTORC1 in vivo
Abstract
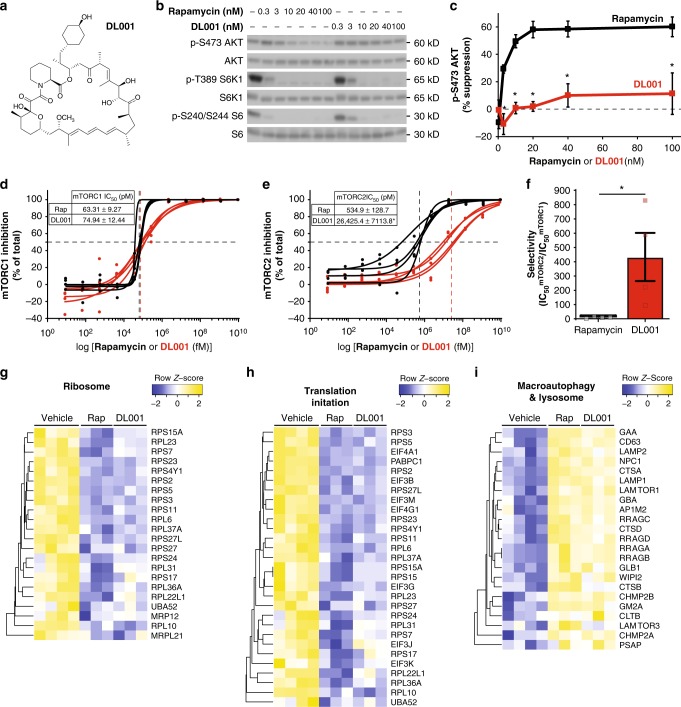
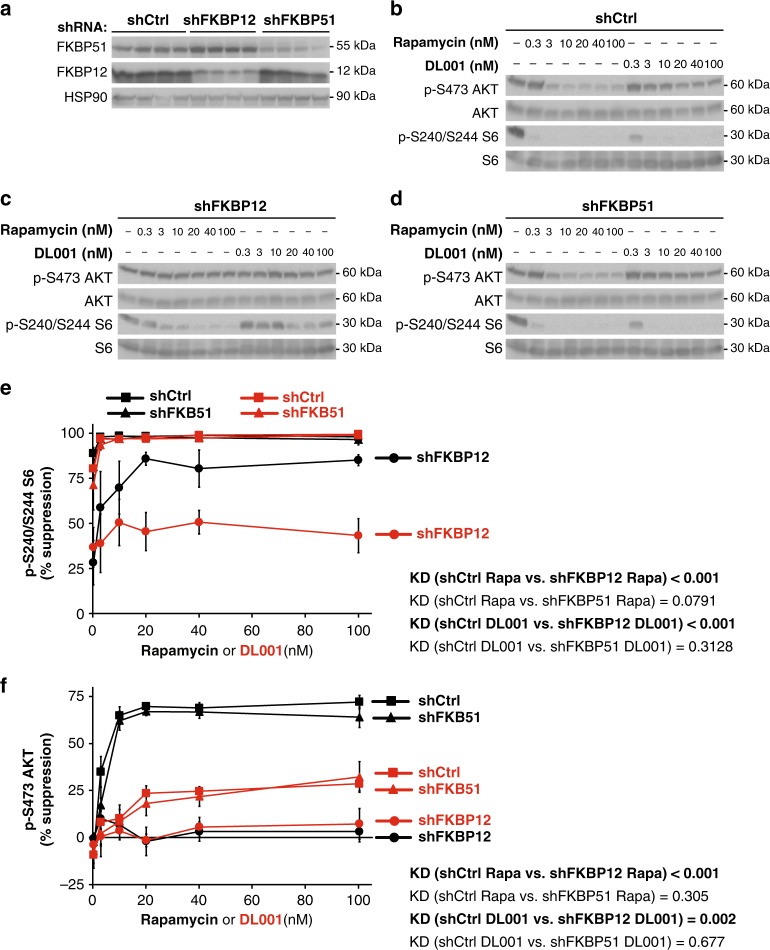
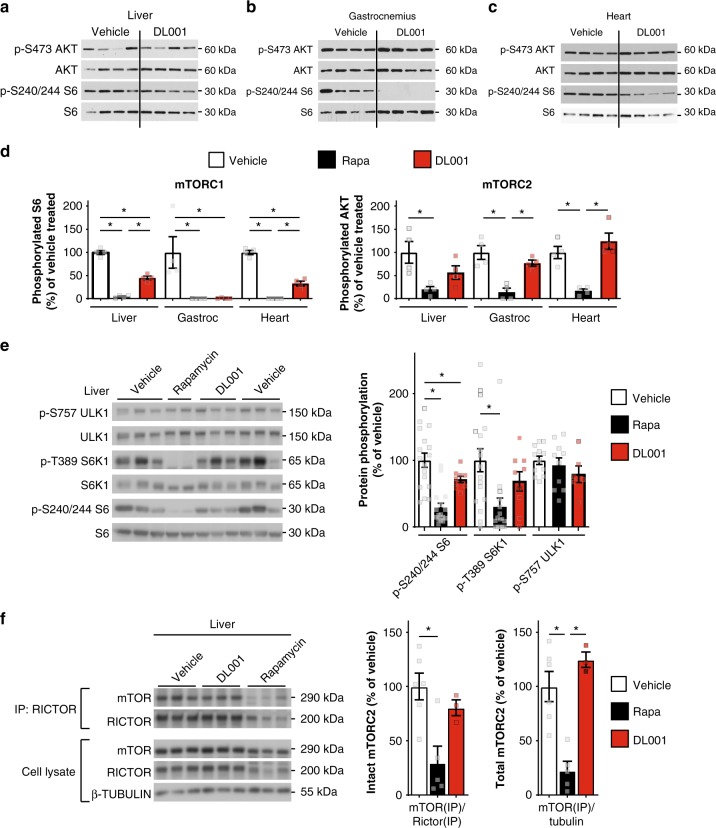
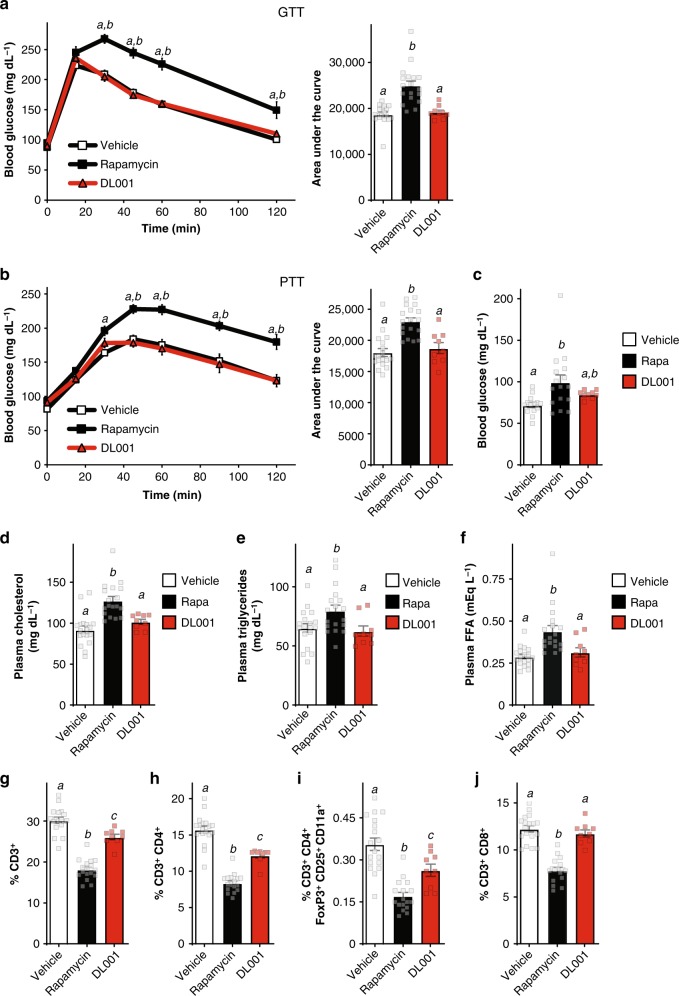
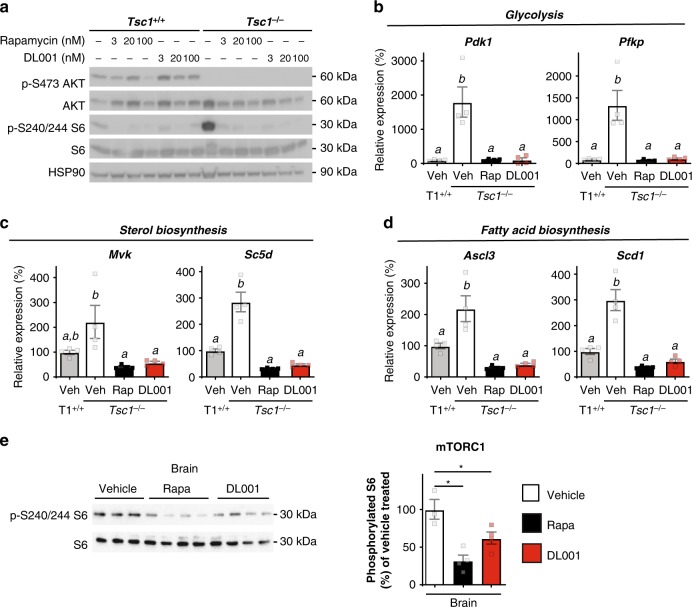
Rapamycin, an inhibitor of mechanistic Target Of Rapamycin Complex 1 (mTORC1), extends lifespan and shows strong potential for the treatment of age-related diseases. However, rapamycin exerts metabolic and immunological side effects mediated by off-target inhibition of a second mTOR-containing complex, mTOR complex 2. Here, we report the identification of DL001, a FKBP12-dependent rapamycin analog 40x more selective for mTORC1 than rapamycin. DL001 inhibits mTORC1 in cell culture lines and in vivo in C57BL/6J mice, in which DL001 inhibits mTORC1 signaling without impairing glucose homeostasis and with substantially reduced or no side effects on lipid metabolism and the immune system. In cells, DL001 efficiently represses elevated mTORC1 activity and restores normal gene expression to cells lacking a functional tuberous sclerosis complex. Our results demonstrate that highly selective pharmacological inhibition of mTORC1 can be achieved in vivo, and that selective inhibition of mTORC1 significantly reduces the side effects associated with conventional rapalogs.
Overview
The claims and statistics of this paper haven’t been checked yet.
Run the check — free, no account needed. It reads the open-access text and checks the sources it cites.
Integrity signals
Registry
Cites
Statistics
Figures
Verification
Claims the paper makes
The claims and statistics of this paper haven’t been checked yet.
Run the check — free, no account needed. It reads the open-access text and checks the sources it cites.
Claims other papers make about this one
Each is checked against this paper’s own text: does it say what the citing paper says it does?
The cited source says what the claim attributes to it.
In the citing paper
“and in accordance with this important role for mTORC2, compounds that selectively inhibit mTORC1 have a reduced effect on the immune system compared to rapamycin 120.”
From Targeting the biology of aging with mTOR inhibitors (2023) · cites this paper as [120]
The cited source says what the claim attributes to it.
In the citing paper
“As expected, mice treated with DL001 had reduced glucose intolerance, dyslipidemia, and immune disruption as compared to mice treated in parallel with rapamycin 120.”
From Targeting the biology of aging with mTOR inhibitors (2023) · cites this paper as [120]
The cited source says what the claim attributes to it.
In the citing paper
“As expected, mice treated with DL001 had reduced glucose intolerance, dyslipidemia, and immune disruption as compared to mice treated in parallel with rapamycin 120.”
From Targeting the biology of aging with mTOR inhibitors (2023) · cites this paper as [120]
The cited source says what the claim attributes to it.
In the citing paper
“As expected, mice treated with DL001 had reduced glucose intolerance, dyslipidemia, and immune disruption as compared to mice treated in parallel with rapamycin 120.”
From Targeting the biology of aging with mTOR inhibitors (2023) · cites this paper as [120]
In the citing paper
“Specific inhibition of mTORC1 in mice using a mTORC1-speicific inhibitor did not result in hyperglycemia, impaired glucose tolerance, hyperlipidemia or hypercholesterolemia, again demonstrating that these negative effects are mediated at least in part by inhibition of mTORC2 120.”
From Targeting the biology of aging with mTOR inhibitors (2023) · cites this paper as [120]
In the citing paper
“One company that screened a library of modified rapalogs identified a compound, DL001, with significantly greater selectivity for mTORC1 than rapamycin 120.”
From Targeting the biology of aging with mTOR inhibitors (2023) · cites this paper as [120]
Self-check
Percentages, sums and reported differences re-computed from the paper’s own numbers.
The self-check needs the paper’s full text.
Citations
Cites
Rapamycin fed late in life extends lifespan in genetically heterogeneous mice
Harrison, D. E., Strong, R., Sharp, Z. D., Nelson, J. F., Astle, C. M., Flurkey, K., Nadon, N. L., Wilkinson, J. E., Frenkel, K., Carter, C. S., et al. (2009) · Nature · doi:10.1038/nature08221 · Cited by 3,766
Thoreen, C. C., Kang, S. A., Chang, J. W., Liu, Q., Zhang, J., Gao, Y., Reichling, L. J., Sim, T., Sabatini, D. M., & Gray, N. S. (2009) · Journal of Biological Chemistry · doi:10.1074/jbc.m900301200 · Cited by 1,803
Spilman, P., Podlutskaya, N., Hart, M. J., Debnath, J., Gorostiza, O., Bredesen, D., Richardson, A., Strong, R., & Galvan, V. (2010) · PLoS ONE · doi:10.1371/journal.pone.0009979 · Cited by 1,033
Regulation of Immune Responses by mTOR
Powell, J. D., Pollizzi, K. N., Heikamp, E. B., & Horton, M. R. (2012) · Annual Review of Immunology · doi:10.1146/annurev-immunol-020711-075024 · Cited by 836
mTOR inhibition improves immune function in the elderly
Mannick, J. B., Del Giudice, G., Lattanzi, M., Valiante, N. M., Praestgaard, J., Huang, B., Lonetto, M. A., Maecker, H. T., Kovarik, J., Carson, S., et al. (2014) · Science Translational Medicine · doi:10.1126/scitranslmed.3009892 · Cited by 786
TOR Signaling and Rapamycin Influence Longevity by Regulating SKN-1/Nrf and DAF-16/FoxO
Robida-Stubbs, S., Glover-Cutter, K., Lamming, D. W., Mizunuma, M., Narasimhan, S. D., Neumann-Haefelin, E., Sabatini, D. M., & Blackwell, T. K. (2012) · Cell Metabolism · doi:10.1016/j.cmet.2012.04.007 · Cited by 648
Self-citationTORC1 inhibition enhances immune function and reduces infections in the elderly
Mannick, J. B., Morris, M., Hockey, H.-U. P., Roma, G., Beibel, M., Kulmatycki, K., Watkins, M., Shavlakadze, T., Zhou, W., Quinn, D., et al. (2018) · Science Translational Medicine · doi:10.1126/scitranslmed.aaq1564 · Cited by 496
Rapamycin attenuates the progression of tau pathology in P301S tau transgenic mice.
Ozcelik, S., Fraser, G., Castets, P., Schaeffer, V., Skachokova, Z., Breu, K., Clavaguera, F., Sinnreich, M., Kappos, L., Goedert, M., et al. (2013) · PLoS ONE · doi:10.1371/journal.pone.0062459 · Cited by 226
Arriola Apelo, S. I., Neuman, J. C., Baar, E. L., Syed, F. A., Cummings, N. E., Brar, H. K., Pumper, C. P., Kimple, M. E., & Lamming, D. W. (2016) · Aging Cell · doi:10.1111/acel.12405 · Cited by 182
Self-citationRapamycin-induced metabolic defects are reversible in both lean and obese mice
Liu, Y., Diaz, V., Fernandez, E., Strong, R., Ye, L., Baur, J. A., Lamming, D. W., Richardson, A., & Salmon, A. B. (2014) · Aging · doi:10.18632/aging.100688 · Cited by 68
Self-citationMammalian target of rapamycin complex 2 regulates muscle glucose uptake during exercise in mice
Kleinert, M., Parker, B. L., Fritzen, A. M., Knudsen, J. R., Jensen, T. E., Kjøbsted, R., Sylow, L., Ruegg, M., James, D. E., & Richter, E. A. (2017) · The Journal of Physiology · doi:10.1113/jp274203 · Cited by 59
Research works printed but not linked: 59
- Bjedov, I. et al. Mechanisms of life span extension by rapamycin in the fruit fly Drosophila melanogaster. Cell Metab. 11, 35–46 (2010). · DOI · Paper page
- Powers, R. W. 3rd, Kaeberlein, M., Caldwell, S. D., Kennedy, B. K. & Fields, S. Extension of chronological life span in yeast by decreased TOR pathway signaling. Genes Dev. 20, 174–184 (2006). · DOI · Paper page
- Majumder, S. et al. Lifelong rapamycin administration ameliorates age-dependent cognitive deficits by reducing IL-1beta and enhancing NMDA signaling. Aging Cell 11, 326–335 (2012). · DOI
- Dai, D. F. et al. Altered proteome turnover and remodeling by short-term caloric restriction or rapamycin rejuvenate the aging heart. Aging Cell 13, 529–539 (2014). · DOI
- Wilkinson, J. E. et al. Rapamycin slows aging in mice. Aging Cell 11, 675–682 (2012). · DOI · Paper page
- Urfer, S. R. et al. A randomized controlled trial to establish effects of short-term rapamycin treatment in 24 middle-aged companion dogs. Geroscience 39, 117–127 (2017). · DOI · Paper page
- Lelegren, M., Liu, Y., Ross, C., Tardif, S. & Salmon, A. B. Pharmaceutical inhibition of mTOR in the common marmoset: effect of rapamycin on regulators of proteostasis in a non-human primate. Pathobiol. Aging Age Relat. Dis. 6, 31793 (2016). · DOI
- Trelinska, J. et al. Complications of mammalian target of rapamycin inhibitor anticancer treatment among patients with tuberous sclerosis complex are common and occasionally life-threatening. Anti-cancer drugs 26, 437–442 (2015). · DOI · Paper page
- Lamming, D. W., Ye, L., Sabatini, D. M. & Baur, J. A. Rapalogs and mTOR inhibitors as anti-aging therapeutics. J. Clin. Invest 123, 980–989 (2013). · DOI · Paper page
- Kennedy, B. K. & Lamming, D. W. The Mechanistic Target of Rapamycin: The Grand ConducTOR of Metabolism and Aging. Cell Metab. 23, 990–1003 (2016). · DOI · Paper page
- Verges, B. & Cariou, B. mTOR inhibitors and diabetes. Diabetes Res Clin. Pr. 110, 101–108 (2015). · DOI
- Kaplan, B., Qazi, Y. & Wellen, J. R. Strategies for the management of adverse events associated with mTOR inhibitors. Transplant. Rev. 28, 126–133 (2014). · DOI
- Hurvitz, S. A. et al. Combination of everolimus with trastuzumab plus paclitaxel as first-line treatment for patients with HER2-positive advanced breast cancer (BOLERO-1): a phase 3, randomised, double-blind, multicentre trial. Lancet Oncol. 16, 816–829 (2015). · DOI
- Yao, J. C. et al. Everolimus for the treatment of advanced, non-functional neuroendocrine tumours of the lung or gastrointestinal tract (RADIANT-4): a randomised, placebo-controlled, phase 3 study. Lancet 387, 968–977 (2016). · DOI
- Arriola Apelo, S. I., Pumper, C. P., Baar, E. L., Cummings, N. E. & Lamming, D. W. Intermittent Administration of Rapamycin Extends the Life Span of Female C57BL/6J Mice. J. Gerontol. A Biol. Sci. Med Sci. 71, 876–881 (2016). · DOI
- Kraig, E. et al. A randomized control trial to establish the feasibility and safety of rapamycin treatment in an older human cohort: Immunological, physical performance, and cognitive effects. Exp. Gerontol. 105, 53–69 (2018). · DOI · Paper page
- Miller, R. A. et al. Rapamycin-mediated lifespan increase in mice is dose and sex dependent and metabolically distinct from dietary restriction. Aging Cell 13, 468–477 (2014). · DOI
- Bitto, A. et al. Transient rapamycin treatment can increase lifespan and healthspan in middle-aged mice. eLife 5, e16351 (2016). · DOI · Paper page
- Dumas S. N., Lamming D. W. Next generation strategies for geroprotection via mTORC1 inhibition. J. Gerontol. A Biol. Sci. Med. Sci. glz056 https://doi.org/10.1093/gerona/glz056 (2019). [Epub ahead of print] · DOI
- Sarbassov, D. D. et al. Rictor, a novel binding partner of mTOR, defines a rapamycin-insensitive and raptor-independent pathway that regulates the cytoskeleton. Curr. Biol. 14, 1296–1302 (2004). · DOI · Paper page
- Lamming, D. W. et al. Rapamycin-induced insulin resistance is mediated by mTORC2 loss and uncoupled from longevity. Science 335, 1638–1643 (2012). · DOI · Paper page
- Zeng, Z. et al. Rapamycin derivatives reduce mTORC2 signaling and inhibit AKT activation in AML. Blood 109, 3509–3512 (2007). · DOI
- Schreiber, K. H. et al. Rapamycin-mediated mTORC2 inhibition is determined by the relative expression of FK506-binding proteins. Aging Cell 14, 265–273 (2015). · DOI
- Sarbassov, D. D. et al. Prolonged rapamycin treatment inhibits mTORC2 assembly and Akt/PKB. Mol. Cell 22, 159–168 (2006). · DOI · Paper page
- Liang, J., Choi, J. & Clardy, J. Refined structure of the FKBP12-rapamycin-FRB ternary complex at 2.2 A resolution. Acta Crystallogr D. Biol. Crystallogr 55, 736–744 (1999). · DOI · Paper page
- Marz, A. M., Fabian, A. K., Kozany, C., Bracher, A. & Hausch, F. Large FK506-binding proteins shape the pharmacology of rapamycin. Mol. Cell Biol. 33, 1357–1367 (2013). · DOI · Paper page
- Harrington, L. S. et al. The TSC1–2 tumor suppressor controls insulin-PI3K signaling via regulation of IRS proteins. J. Cell Biol. 166, 213–223 (2004). · DOI
- Hsu, P. P. et al. The mTOR-regulated phosphoproteome reveals a mechanism of mTORC1-mediated inhibition of growth factor signaling. Science 332, 1317–1322 (2011). · DOI · Paper page
- Tang, Y. et al. Adipose tissue mTORC2 regulates ChREBP-driven de novo lipogenesis and hepatic glucose metabolism. Nat. Commun. 7, 11365 (2016). · DOI
- Kumar, A. et al. Muscle-specific deletion of rictor impairs insulin-stimulated glucose transport and enhances Basal glycogen synthase activity. Mol. Cell Biol. 28, 61–70 (2008). · DOI
- Kumar, A. et al. Fat cell-specific ablation of rictor in mice impairs insulin-regulated fat cell and whole-body glucose and lipid metabolism. Diabetes 59, 1397–1406 (2010). · DOI
- Lamming, D. W. et al. Depletion of Rictor, an essential protein component of mTORC2, decreases male lifespan. Aging Cell 13, 911–917 (2014). · DOI · Paper page
- de Wit, D. et al. Everolimus pharmacokinetics and its exposure-toxicity relationship in patients with thyroid cancer. Cancer Chemother. Pharm. 78, 63–71 (2016). · DOI
- Kovarik, J. M. et al. Everolimus in de novo cardiac transplantation: pharmacokinetics, therapeutic range, and influence on cyclosporine exposure. J. Heart Lung Transpl. 22, 1117–1125 (2003). · DOI
- Lamming, D. W. et al. Young and old genetically heterogeneous HET3 mice on a rapamycin diet are glucose intolerant but insulin sensitive. Aging Cell 12, 712–718 (2013). · DOI
- Lamming, D. W. & Sabatini, D. M. A Central role for mTOR in lipid homeostasis. Cell Metab. 18, 465–469 (2013). · DOI
- Peterson, T. R. et al. mTOR complex 1 regulates lipin 1 localization to control the SREBP pathway. Cell 146, 408–420 (2011). · DOI
- Soliman, G. A., Acosta-Jaquez, H. A. & Fingar, D. C. mTORC1 inhibition via rapamycin promotes triacylglycerol lipolysis and release of free fatty acids in 3T3-L1 adipocytes. Lipids 45, 1089–1100 (2010). · DOI
- Chakrabarti, P. et al. Insulin inhibits lipolysis in adipocytes via the evolutionarily conserved mTORC1-Egr1-ATGL-mediated pathway. Mol. Cell Biol. 33, 3659–3666 (2013). · DOI
- Mahe, E. et al. Cutaneous adverse events in renal transplant recipients receiving sirolimus-based therapy. Transplantation 79, 476–482 (2005). · DOI
- Goldberg, E. L. et al. Lifespan-extending caloric restriction or mTOR inhibition impair adaptive immunity of old mice by distinct mechanisms. Aging Cell 14, 130–138 (2015). · DOI
- Goldberg, E. L., Smithey, M. J., Lutes, L. K., Uhrlaub, J. L. & Nikolich-Zugich, J. Immune memory-boosting dose of rapamycin impairs macrophage vesicle acidification and curtails glycolysis in effector CD8 cells, impairing defense against acute infections. J. Immunol. 193, 757–763 (2014). · DOI · Paper page
- Wang, Y. et al. Regulatory T cells require mammalian target of rapamycin signaling to maintain both homeostasis and alloantigen-driven proliferation in lymphocyte-replete mice. J. Immunol. 186, 2809–2818 (2011). · DOI
- Makki, K. et al. Beneficial metabolic effects of rapamycin are associated with enhanced regulatory cells in diet-induced obese mice. PLoS ONE 9, e92684 (2014). · DOI
- Kwiatkowski, D. J. & Manning, B. D. Tuberous sclerosis: a GAP at the crossroads of multiple signaling pathways. Hum. Mol. Genet 14(Spec No. 2), R251–R258 (2005). · DOI · Paper page
- Yang, J. et al. Renal tumours in a Tsc2( + /-) mouse model do not show feedback inhibition of Akt and are effectively prevented by rapamycin. Oncogene 34, 922–931 (2015). · DOI
- Krueger, D. A. et al. Everolimus long-term safety and efficacy in subependymal giant cell astrocytoma. Neurology 80, 574–580 (2013). · DOI
- Kwiatkowski, D. J. et al. Response to everolimus is seen in TSC-associated SEGAs and angiomyolipomas independent of mutation type and site in TSC1 and TSC2. Eur. J. Hum. Genet. : EJHG 23, 1665–1672 (2015). · DOI
- Bissler, J. J. et al. Everolimus long-term use in patients with tuberous sclerosis complex: Four-year update of the EXIST-2 study. PLoS One 12, e0180939 (2017). · DOI · Paper page
- Krueger, D. A. et al. Long-term treatment of epilepsy with everolimus in tuberous sclerosis. Neurology 87, 2408–2415 (2016). · DOI · Paper page
- Duvel, K. et al. Activation of a metabolic gene regulatory network downstream of mTOR complex 1. Mol. Cell 39, 171–183 (2010). · DOI · Paper page
- Li, K. et al. Rheb1 deletion in myeloid cells aggravates OVA-induced allergic inflammation in mice. Sci. Rep. 7, 42655 (2017). · DOI
- Yang, W. et al. Genetic deletion of Rheb1 in the brain reduces food intake and causes hypoglycemia with altered peripheral metabolism. Int J. Mol. Sci. 15, 1499–1510 (2014). · DOI
- Tian, Q. et al. RHEB1 insufficiency in aged male mice is associated with stress-induced seizures. Geroscience 39, 557–570 (2017). · DOI
- Frey, J. W., Jacobs, B. L., Goodman, C. A. & Hornberger, T. A. A role for Raptor phosphorylation in the mechanical activation of mTOR signaling. Cell Signal 26, 313–322 (2014). · DOI
- Crino, P. B. Focal brain malformations: a spectrum of disorders along the mTOR cascade. Novartis Found. Symp. 288, 260–272 (2007). discussion 272–281. · DOI
- Ye, L., Varamini, B., Lamming, D. W., Sabatini, D. M. & Baur, J. A. Rapamycin has a biphasic effect on insulin sensitivity in C2C12 myotubes due to sequential disruption of mTORC1 and mTORC2. Front Genet 3, 177 (2012). · DOI
- Cummings, N. E. et al. Restoration of metabolic health by decreased consumption of branched-chain amino acids. J. Physiol. 596, 623–645 (2018). · DOI
- Ritchie, M. E. et al. limma powers differential expression analyses for RNA-sequencing and microarray studies. Nucleic Acids Res 43, e47 (2015). · DOI · Paper page
Cited by
Sorted by citations
Molecular mechanisms of dietary restriction promoting health and longevity
Green, C. L., Lamming, D. W., & Fontana, L. (2022) · Nature Reviews Molecular Cell Biology · doi:10.1038/s41580-021-00411-4 · Cited by 714
Self-citationTargeting the biology of aging with mTOR inhibitors
Mannick, J. B., & Lamming, D. W. (2023) · Nature Aging · doi:10.1038/s43587-023-00416-y · Cited by 372
Self-citationThe Role of Rapamycin in Healthspan Extension via the Delay of Organ Aging
Zhang, Y., Zhang, J., & Wang, S. (2021) · Ageing Research Reviews · doi:10.1016/j.arr.2021.101376 · Cited by 92
Metadata
- Authors
- Schreiber, K. H., Arriola Apelo, S. I., Yu, D., Brinkman, J. A., Velarde, M. C., Syed, F. A., Liao, C.-Y., Baar, E. L., Carbajal, K. A., Sherman, D. S., Ortiz, D., Brunauer, R., Yang, S. E., Tzannis, S. T., Kennedy, B. K., & Lamming, D. W.
- Venue
- Nature Communications
- Published
- 2019-07-19
- Volume
- 10
- Issue
- 1
- ISSN
- 2041-1723
- PMC
- PMC6642166
- Cited by
- 177
- References
- 11
- Language
- en
- Funders
- American Diabetes Association (1-16-PMF-001)
- American Heart Association (17PRE33410983)
- U.S. Department of Health & Human Services | NIH | National Cancer Institute (P30CA014520)
- U.S. Department of Health & Human Services | NIH | National Center for Advancing Translational Sciences (UL1TR002373)
- UW | School of Medicine and Public Health, University of Wisconsin-Madison
- U.S. Department of Health & Human Services | NIH | National Institute on Aging (R01AG056771, R01AG062328)
- Aeonian Pharmaceuticals
About these checks
Registry, retraction, Cites and statistics results are computed, not judged, with one exception: a printed reference that no index lists is read once by a model before it counts as a citation error. Claims are extracted by a model and kept only when their quote appears verbatim in the text; each cited source is then checked, with a model’s help, for whether it says what the claim relies on. Those verdicts can be wrong — read the claim’s quote and the cited source before relying on one.
Statistics and arithmetic are recomputed, not judged.
Confidence bands are shown only for fields calibrated on our annotated test set. None is calibrated yet, so no band is shown.
What counts as a claim ›How we measure confidence ›How we check this ›
Are you an author, or do you see a problem with this page? Request a review
