

The DOI matches its Crossref record; 57 of the 57 references it cites were found in a registry or an index.
Harnessing calcineurin-FK506-FKBP12 crystal structures from invasive fungal pathogens to develop antifungal agents
Open accessAbstract
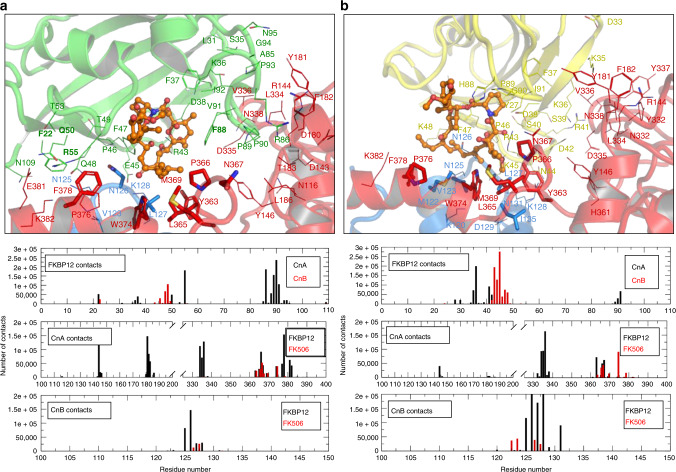
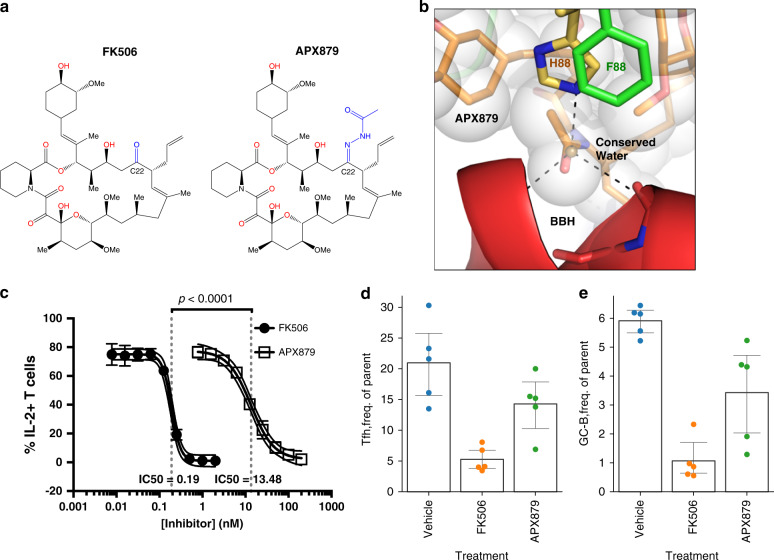
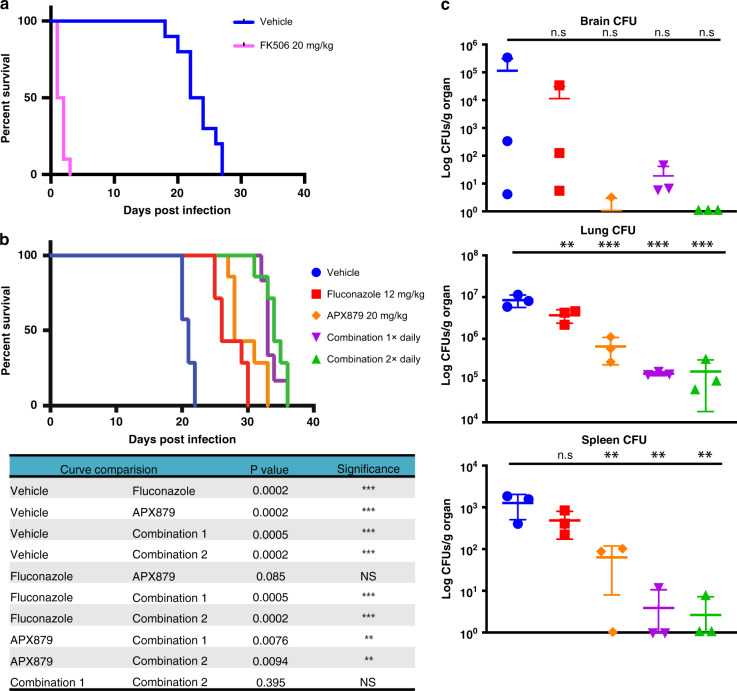
Calcineurin is important for fungal virulence and a potential antifungal target, but compounds targeting calcineurin, such as FK506, are immunosuppressive. Here we report the crystal structures of calcineurin catalytic (CnA) and regulatory (CnB) subunits complexed with FK506 and the FK506-binding protein (FKBP12) from human fungal pathogens (Aspergillus fumigatus, Candida albicans, Cryptococcus neoformans and Coccidioides immitis). Fungal calcineurin complexes are similar to the mammalian complex, but comparison of fungal and human FKBP12 (hFKBP12) reveals conformational differences in the 40s and 80s loops. NMR analysis, molecular dynamic simulations, and mutations of the A. fumigatus CnA/CnB-FK506-FKBP12-complex identify a Phe88 residue, not conserved in hFKBP12, as critical for binding and inhibition of fungal calcineurin. These differences enable us to develop a less immunosuppressive FK506 analog, APX879, with an acetohydrazine substitution of the C22-carbonyl of FK506. APX879 exhibits reduced immunosuppressive activity and retains broad-spectrum antifungal activity and efficacy in a murine model of invasive fungal infection.
Overview
The claims and statistics of this paper haven’t been checked yet.
Run the check — free, no account needed. It reads the open-access text and checks the sources it cites.
Integrity signals
Registry
Cites
Statistics
Figures
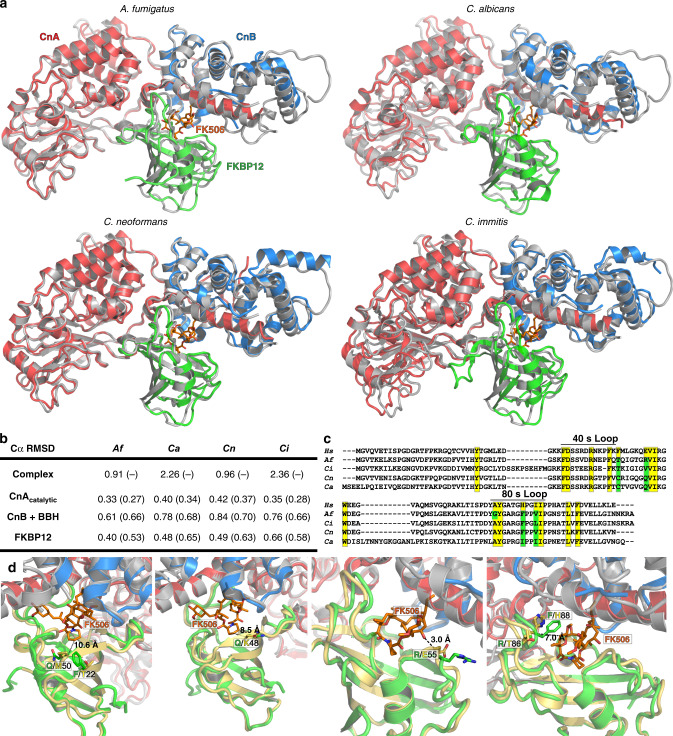
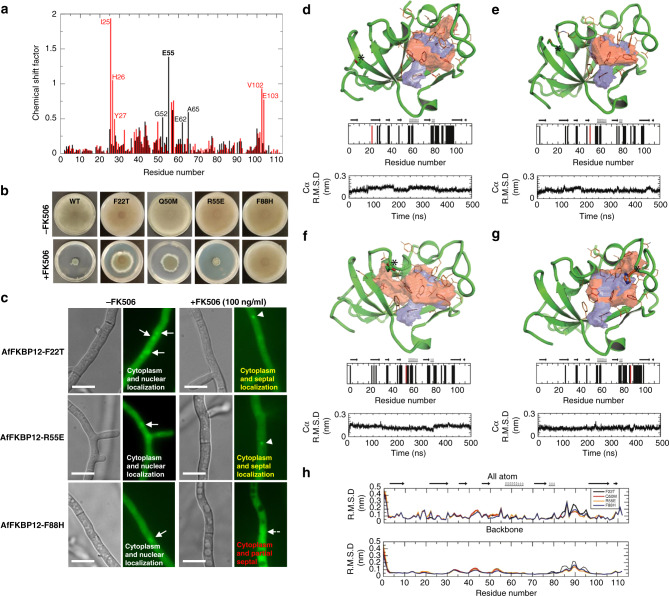
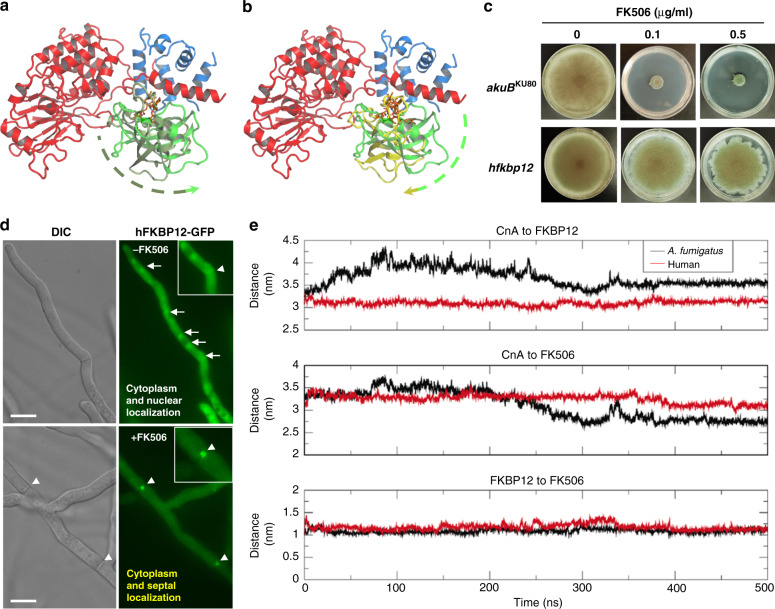
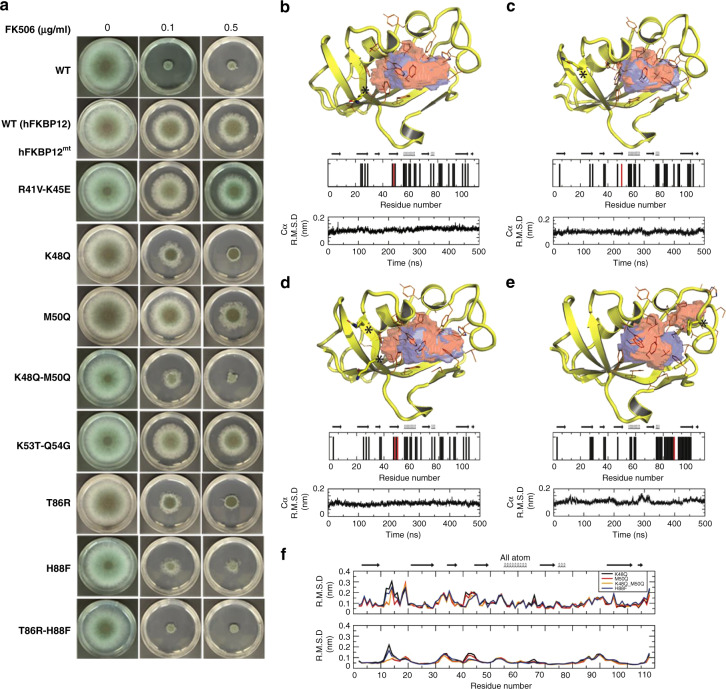
Verification
Claims the paper makes
The claims and statistics of this paper haven’t been checked yet.
Run the check — free, no account needed. It reads the open-access text and checks the sources it cites.
Claims other papers make about this one
Each is checked against this paper’s own text: does it say what the citing paper says it does?
In the citing paper
“These structures identified a specific residue that is conserved in the fungal FKBP12 but not the human FKBP12 and is crucial for FK506-mediated inhibition of calcineurin77”
From Treatment strategies for cryptococcal infection: challenges, advances and future outlook (2021) · cites this paper as [77]
In the citing paper
“enabling the design of APX879, an FK506 analogue with an acetohydrazine substitution of the C22 carbonyl, which has 70-fold lower immunosuppressive effects than FK506 while retaining antifungal activity77”
From Treatment strategies for cryptococcal infection: challenges, advances and future outlook (2021) · cites this paper as [77]
In the citing paper
“Fortunately, the crystal structure of the two subunits of calcineurin in a complex with the inhibitor FK506 and the FK506-binding protein FKBP12 from four prominent fungal pathogens, including C. neoformans, has been solved.”
From Treatment strategies for cryptococcal infection: challenges, advances and future outlook (2021) · cites this paper as [77]
Self-check
Percentages, sums and reported differences re-computed from the paper’s own numbers.
The self-check needs the paper’s full text.
Citations
Cites
Berman, H. M. (2000) · Nucleic Acids Research · doi:10.1093/nar/28.1.235 · Cited by 40,196
Features and development of Coot
Emsley, P., Lohkamp, B., Scott, W. G., & Cowtan, K. (2010) · Acta Crystallographica Section D Biological Crystallography · doi:10.1107/s0907444910007493 · Cited by 29,915
PHENIX : a comprehensive Python-based system for macromolecular structure solution
Adams, P. D., Afonine, P. V., Bunkóczi, G., Chen, V. B., Davis, I. W., Echols, N., Headd, J. J., Hung, L.-W., Kapral, G. J., Grosse-Kunstleve, R. W., et al. (2010) · Acta Crystallographica Section D Biological Crystallography · doi:10.1107/s0907444909052925 · Cited by 23,716
Phaser crystallographic software
McCoy, A. J., Grosse-Kunstleve, R. W., Adams, P. D., Winn, M. D., Storoni, L. C., & Read, R. J. (2007) · Journal of Applied Crystallography · doi:10.1107/s0021889807021206 · Cited by 20,612
The CCP4 suite: programs for protein crystallography
Number Collaborative Computational Project (1994) · Acta Crystallographica Section D Biological Crystallography · doi:10.1107/s0907444994003112 · Cited by 17,317
Calcium's Role in Mechanotransduction during Muscle Development
Damm, T. B., & Egli, M. (2014) · Cellular Physiology and Biochemistry · doi:10.1159/000356667 · Cited by 14,552
MolProbity : all-atom structure validation for macromolecular crystallography
Chen, V. B., Arendall, W. B., Headd, J. J., Keedy, D. A., Immormino, R. M., Kapral, G. J., Murray, L. W., Richardson, J. S., & Richardson, D. C. (2010) · Acta Crystallographica Section D Biological Crystallography · doi:10.1107/s0907444909042073 · Cited by 14,115
Overview of the CCP 4 suite and current developments
Winn, M. D., Ballard, C. C., Cowtan, K. D., Dodson, E. J., Emsley, P., Evans, P. R., Keegan, R. M., Krissinel, E. B., Leslie, A. G. W., McCoy, A., et al. (2011) · Acta Crystallographica Section D Biological Crystallography · doi:10.1107/s0907444910045749 · Cited by 12,353
GROMACS 4.5: a high-throughput and highly parallel open source molecular simulation toolkit
Pronk, S., Páll, S., Schulz, R., Larsson, P., Bjelkmar, P., Apostolov, R., Shirts, M., Smith, J., Kasson, P., van der Spoel, D., et al. (2013) · Bioinform. · doi:10.1093/bioinformatics/btt055 · Cited by 7,255
Improved side-chain torsion potentials for the Amber ff99SB protein force field
Lindorff-Larsen, K., Piana, S., Palmo, K., Maragakis, P., Klepeis, J., Dror, R., & Shaw, D. (2010) · Proteins: Structure, Function, and Bioinformatics · doi:10.1002/prot.22711 · Cited by 6,056
Automatic atom type and bond type perception in molecular mechanical calculations
Wang, J., Wang, W., Kollman, P. A., & Case, D. A. (2006) · Journal of Molecular Graphics and Modelling · doi:10.1016/j.jmgm.2005.12.005 · Cited by 5,517
Calcineurin is a common target of cyclophilin-cyclosporin A and FKBP-FK506 complexes
Liu, J., Farmer, J. D., Lane, W. S., Friedman, J., Weissman, I., & Schreiber, S. L. (1991) · Cell · doi:10.1016/0092-8674(91)90124-h · Cited by 4,116
Molecular replacement with MOLREP
Vagin, A. A., & Teplyakov, A. (2009) · Acta Crystallographica Section D Biological Crystallography · doi:10.1107/s0907444909042589 · Cited by 3,669
HADDOCK: A Protein−Protein Docking Approach Based on Biochemical or Biophysical Information
Dominguez, C., Boelens, R., & Bonvin, A. M. J. J. (2003) · Journal of the American Chemical Society · doi:10.1021/ja026939x · Cited by 3,187
Comparative Protein Structure Modeling of Genes and Genomes
Martí-Renom, M. A., Stuart, A. C., Fiser, A., Sánchez, R., Melo, F., & Šali, A. (2000) · Annual Review of Biophysics and Biomolecular Structure · doi:10.1146/annurev.biophys.29.1.291 · Cited by 3,169
Announcing the worldwide Protein Data Bank
Berman, H., Henrick, K., & Nakamura, H. (2003) · Nature Structural & Molecular Biology · doi:10.1038/nsb1203-980 · Cited by 3,093
Global and Multi-National Prevalence of Fungal Diseases-Estimate Precision
Bongomin, F., Gago, S., Oladele, R., & Denning, D. (2017) · Journal of Fungi · doi:10.3390/jof3040057 · Cited by 2,953
Hooft, R. W. W., Vriend, G., Sander, C., & Abola, E. E. (1996) · Nature · doi:10.1038/381272a0 · Cited by 2,180
Transcriptional regulation by calcium, calcineurin, and NFAT
Hogan, P. G., Chen, L., Nardone, J., & Rao, A. (2003) · Genes & Development · doi:10.1101/gad.1102703 · Cited by 1,991
Protein Structure Modeling with MODELLER
Eswar, N., Eramian, D., Webb, B., Shen, M., & Šali, A. (2008) · Methods in molecular biology · doi:10.1007/978-1-60327-058-8_8 · Cited by 1,781
Main-chain Bond Lengths and Bond Angles in Protein Structures
Laskowski, R. A., Moss, D. S., & Thornton, J. M. (1993) · Journal of Molecular Biology · doi:10.1006/jmbi.1993.1351 · Cited by 1,217
The antifungal pipeline: a reality check
Perfect, J. R. (2017) · Nature Reviews Drug Discovery · doi:10.1038/nrd.2017.46 · Cited by 866
X-ray structure of calcineurin inhibited by the immunophilin-immunosuppressant FKBP12-FK506 complex
Griffith, J. P., Kim, J. L., Kim, E. E., Sintchak, M. D., Thomson, J. A., Fitzgibbon, M. J., Fleming, M. A., Caron, P. R., Hsiao, K., & Navia, M. A. (1995) · Cell · doi:10.1016/0092-8674(95)90439-5 · Cited by 834
Crystal structures of human calcineurin and the human FKBP12–FK506–calcineurin complex
Kissinger, C. R., Parge, H. E., Knighton, D. R., Lewis, C. T., Pelletier, L. A., Tempczyk, A., Kalish, V. J., Tucker, K. D., Showalter, R. E., Moomaw, E. W., et al. (1995) · Nature · doi:10.1038/378641a0 · Cited by 768
FireDock: a web server for fast interaction refinement in molecular docking
Mashiach, E., Schneidman‐Duhovny, D., Andrusier, N., Nussinov, R., & Wolfson, H. J. (2008) · Nucleic Acids Research · doi:10.1093/nar/gkn186 · Cited by 742
Volkamer, A., Kühn, D., Rippmann, F., & Rarey, M. (2012) · Bioinformatics · doi:10.1093/bioinformatics/bts310 · Cited by 619
Protein Structure Modeling with MODELLER
Webb, B., & Šali, A. (2017) · Methods in molecular biology · doi:10.1007/978-1-4939-7231-9_4 · Cited by 416
Rapid comparison of protein structures
McLachlan, A. (1982) · Acta Crystallographica Section A · doi:10.1107/s0567739482001806 · Cited by 395
Interaction of calcineurin with substrates and targeting proteins
Li, H., Rao, A., & Hogan, P. G. (2010) · Trends in Cell Biology · doi:10.1016/j.tcb.2010.09.011 · Cited by 381
Calcineurin inhibitors: 40 years later, can’t live without
Azzi, J. R., Sayegh, M. H., & Mallat, S. G. (2013) · The Journal of Immunology · doi:10.4049/jimmunol.1390055 · Cited by 337
Harnessing calcineurin as a novel anti-infective agent against invasive fungal infections.
Steinbach, W. J., Reedy, J. L., Cramer, R. A., Perfect, J. R., & Heitman, J. (2007) · Nature Reviews Microbiology · doi:10.1038/nrmicro1680 · Cited by 313
Self-citationCalcineurin: From structure to function
Aramburu, J. F., Rao, A., & Klee, C. B. (2001) · Current topics in cellular regulation · doi:10.1016/s0070-2137(01)80011-x · Cited by 299
FK506, An Immunosuppressant Targeting Calcineurin Function
Dumont, F. J. (2000) · Current Medicinal Chemistry · doi:10.2174/0929867003374723 · Cited by 251
Stock-based detection of protein oligomeric states in jsPISA
Krissinel, E. (2015) · Nucleic Acids Research · doi:10.1093/nar/gkv314 · Cited by 240
Imboden, J. B., Weiss, A., & Stobo, J. D. (1985) · The Journal of Immunology · doi:10.4049/jimmunol.134.2.663 · Cited by 222
Juvvadi, P. R., Lee, S. C., Heitman, J., & Steinbach, W. J. (2016) · Virulence · doi:10.1080/21505594.2016.1201250 · Cited by 179
Self-citationLiu, S., Hou, Y., Liu, W., Lu, C., Wang, W., & Sun, S. (2015) · Eukaryotic Cell · doi:10.1128/ec.00271-14 · Cited by 174
Del Poeta, M., Cruz, M. C., Cardenas, M. E., Perfect, J. R., & Heitman, J. (2000) · Antimicrobial Agents and Chemotherapy · doi:10.1128/aac.44.3.739-746.2000 · Cited by 169
Self-citationJohn, A. R. O., Poeta, M. D., Perfect, J. R., & Heitman, J. (1997) · Antimicrobial Agents and Chemotherapy · doi:10.1128/aac.41.1.156 · Cited by 153
Self-citationJuvvadi, P. R., Lamoth, F., & Steinbach, W. J. (2014) · Fungal Biology Reviews · doi:10.1016/j.fbr.2014.02.004 · Cited by 116
Self-citationKontoyiannis, D. P. (2003) · Journal of Antimicrobial Chemotherapy · doi:10.1093/jac/dkg090 · Cited by 116
Structures of calcineurin and its complexes with immunophilins–immunosuppressants
Ke, H., & Huai, Q. (2003) · Biochemical and Biophysical Research Communications · doi:10.1016/s0006-291x(03)01537-7 · Cited by 90
Juvvadi, P. R., Fortwendel, J. R., Rogg, L. E., Burns, K. A., Randell, S. H., & Steinbach, W. J. (2011) · Molecular Microbiology · doi:10.1111/j.1365-2958.2011.07886.x · Cited by 80
Self-citationFK506 Binding Protein Mutational Analysis
Futer, O., DeCenzo, M. T., Aldape, R. A., & Livingston, D. J. (1995) · Journal of Biological Chemistry · doi:10.1074/jbc.270.32.18935 · Cited by 61
Rotonda, J., Burbaum, J. J., Chan, H., Marcy, A. I., & Becker, J. W. (1993) · Journal of Biological Chemistry · doi:10.1016/s0021-9258(18)52995-1 · Cited by 61
Gene Composer: database software for protein construct design, codon engineering, and gene synthesis
Lorimer, D. D., Raymond, A. C., Walchli, J., Mixon, M. B., Barrow, A., Wallace, E., Grice, R., Burgin, A. B., & Stewart, L. J. (2009) · BMC Biotechnology · doi:10.1186/1472-6750-9-36 · Cited by 58
In VitroandIn VivoAssessment of FK506 Analogs as Novel Antifungal Drug Candidates
Lee, Y., Lee, K.-T., Lee, S. J., Beom, J. Y., Hwangbo, A., Jung, J. A., Song, M., Yoo, Y. J., Kang, S. H., Averette, A. F., et al. (2018) · Antimicrobial Agents and Chemotherapy · doi:10.1128/aac.01627-18 · Cited by 58
Self-citationRotonda, J., Burbaum, J. J., Chan, H., et al. (1993) · PubMed · doi:10.2210/pdb1yat/pdb · Cited by 53
The biosynthetic pathway of FK506 and its engineering: from past achievements to future prospects
Ban, Y. H., Park, S. R., & Yoon, Y. J. (2015) · Journal of Industrial Microbiology & Biotechnology · doi:10.1007/s10295-015-1677-7 · Cited by 43
The medicinal chemistry of FK-506
Goulet, M. T., Rupprecht, K. M., Sinclair, P. J., Wyvratt, M. J., & Parsons, W. H. (1994) · Perspectives in Drug Discovery and Design · doi:10.1007/bf02171741 · Cited by 36
Structures of Pathogenic Fungal FKBP12s Reveal Possible Self-Catalysis Function
Tonthat, N. K., Juvvadi, P. R., Zhang, H., Lee, S. C., Venters, R. A., Spicer, L. D., Steinbach, W. J., Heitman, J., & Schumacher, M. A. (2016) · mBio · doi:10.1128/mbio.00492-16 · Cited by 36
Self-citationA calcineurin antifungal strategy with analogs of FK506
Nambu, M. D., Covel, J. A., Kapoor, M., Li, X., Moloney, M. K., Numa, M. M. D., Soltow, Q. A., Trzoss, M., Webb, P. J., Webb, R. R., et al. (2017) · Bioorganic & Medicinal Chemistry Letters · doi:10.1016/j.bmcl.2017.04.004 · Cited by 26
Self-citationCharacterization of the FKBP12-Encoding Genes in Aspergillus fumigatus
Falloon, K., Juvvadi, P. R., Richards, A. D., Vargas-Muñiz, J. M., Renshaw, H., & Steinbach, W. J. (2015) · PLoS ONE · doi:10.1371/journal.pone.0137869 · Cited by 21
Self-citationChemistry of the Immunomodulatory Macrolide Ascomycin and Related Analogues
Bulusu, M. A. R. C., Baumann, K., & Stuetz, A. (2011) · Fortschritte der Chemie Organischer Naturstoffe/Fortschritte der Chemie organischer Naturstoffe/Progress in the chemistry of organic natural products · doi:10.1007/978-3-7091-0748-5_2 · Cited by 14
Studies relating to the immunosuppressive activity of FK506
Furber, M., Cooper, M., & Donald, D. K. (1993) · Tetrahedron Letters · doi:10.1016/s0040-4039(00)91793-3 · Cited by 11
Juvvadi, P. R., Pemble, C. W., Ma, Y., & Steinbach, W. J. (2016) · FEBS Letters · doi:10.1002/1873-3468.12075 · Cited by 11
Self-citationSynthesis of ascomycin and FK 506 derivatives with modified effector domain
Nußbaumer, P., Grassberger, M. A., & Schulz, G. (1999) · Tetrahedron Letters · doi:10.1016/s0040-4039(99)00629-2 · Cited by 10
Cited by
Sorted by citations
Antifungal Drug Resistance: Molecular Mechanisms in Candida albicans and Beyond
Lee, Y., Puumala, E., Robbins, N., & Cowen, L. E. (2021) · Chemical Reviews · doi:10.1021/acs.chemrev.0c00199 · Cited by 801
Threats Posed by the Fungal Kingdom to Humans, Wildlife, and Agriculture
Fisher, M. C., Gurr, S. J., Cuomo, C. A., Blehert, D. S., Jin, H., Stukenbrock, E. H., Stajich, J., Kahmann, R., Boone, C. M., Denning, D. W., et al. (2020) · mBio · doi:10.1128/mbio.00449-20 · Cited by 587
Self-citationTreatment strategies for cryptococcal infection: challenges, advances and future outlook
Iyer, K. R., Revie, N. M., Fu, C., Robbins, N., & Cowen, L. E. (2021) · Nature Reviews Microbiology · doi:10.1038/s41579-021-00511-0 · Cited by 363
Molecular mechanisms governing antifungal drug resistance
Lee, Y., Robbins, N., & Cowen, L. E. (2023) · npj Antimicrobials and Resistance · doi:10.1038/s44259-023-00007-2 · Cited by 304
Chasing molecular glue degraders: screening approaches
Domostegui, A., Nieto-Barrado, L., Perez-Lopez, C., & Mayor-Ruiz, C. (2022) · Chemical Society Reviews · doi:10.1039/d2cs00197g · Cited by 200
Metadata
- Authors
- Juvvadi, P. R., Fox, D., Bobay, B. G., Hoy, M. J., Gobeil, S. M. C., Venters, R. A., Chang, Z., Lin, J. J., Averette, A. F., Cole, D. C., Barrington, B. C., Wheaton, J. D., Ciofani, M., Trzoss, M., Li, X., Lee, S. C., Chen, Y.-L., Mutz, M., Spicer, L. D., Schumacher, M. A., Heitman, J., & Steinbach, W. J.
- Affiliations
- Duke University (US)
- Beryllium (United States) (US)
- Duke Medical Center (US)
- Amplyx Pharmaceuticals (United States) (US)
- The University of Texas at San Antonio (US)
- National Taiwan University (TW)
- Genentech (US)
- Corresponding author
- Juvvadi, Praveen R.
- Steinbach, William J.
- ORCID
- Juvvadi, Praveen R.
- Bobay, Benjamin G.
- Hoy, Michael J.
- Gobeil, Sophie M. C.
- Venters, Ronald A.
- Chang, Zanetta
- Lin, Jackie J.
- Averette, Anna Floyd
- Cole, D. Christopher
- Wheaton, Joshua D.
- Ciofani, Maria
- Li, Xiaoming
- Lee, Soo Chan
- Chen, Ying-Lien
- Spicer, Leonard D.
- Schumacher, Maria A.
- Heitman, Joseph
- Steinbach, William J.
- Venue
- Nature Communications
- Published
- 2019-09-19
- Volume
- 10
- Issue
- 1
- Pages
- 4275-4275
- ISSN
- 2041-1723 (ISSN-L)
- PMC
- PMC6753081
- OpenAlex
- W2973294764
- Cited by
- 116
- References
- 56
- Citations by year
- 2026: 10 · 2025: 11 · 2024: 14 · 2023: 14 · 2022: 17 · 2021: 26 · 2020: 22 · 2019: 1
- FWCI
- 5.96
- Type
- journal article
- Language
- en
- Update notices
- correction (2025-07-03)
- Open access
- gold
- doi.org
- Locations
- Nature Communications (publishedVersion, cc-by)
- PubMed Central (publishedVersion, cc-by)
- PubMed (publishedVersion)
- OSTI OAI (U.S. Department of Energy Office of Scientific and Technical Information) (submittedVersion)
- RePEc: Research Papers in Economics (submittedVersion)
- DOAJ (DOAJ: Directory of Open Access Journals) (submittedVersion)
- DOAJ (DOAJ: Directory of Open Access Journals) (submittedVersion, cc-by-sa)
- Funders
- U.S. Department of Health & Human Services | NIH | National Institute of Allergy and Infectious Diseases (R01 AI112595-04, P01 AI104533-04, R43AI098300, R43AI106235, HHSN272200700057, HHSN272201200025C, HHSN272201700059C)
- Ministry of Trade, Industry and Energy (N0001720)
- Topics
- Life Sciences › Biochemistry, Genetics and Molecular Biology › Molecular Biology › Signaling Pathways in Disease
- Health Sciences › Medicine › Infectious Diseases › Antifungal resistance and susceptibility
- Life Sciences › Immunology and Microbiology › Applied Microbiology and Biotechnology › Microbial Natural Products and Biosynthesis
- Keywords
- calcineurin, FK506, FKBP12, antifungal agents, fungal virulence, Aspergillus fumigatus, Candida albicans, Cryptococcus neoformans, Coccidioides immitis, immunosuppressive activity, invasive fungal infections, crystal structure
- MeSH terms
- Animals, Antifungal Agents, Aspergillosis, Aspergillus fumigatus, Binding Sites, Candida albicans, Cells, Cultured, Coccidioides, Cryptococcosis, Cryptococcus neoformans, Female, Male, Mice, Inbred A, Mice, Inbred C57BL, Tacrolimus, Crystallography, X-Ray, Calcineurin, Tacrolimus Binding Protein 1A, Mice, Drug Discovery, Molecular Dynamics Simulation, Calcineurin Inhibitors
About these checks
Registry, retraction, Cites and statistics results are computed, not judged, with one exception: a printed reference that no index lists is read once by a model before it counts as a citation error. Claims are extracted by a model and kept only when their quote appears verbatim in the text; each cited source is then checked, with a model’s help, for whether it says what the claim relies on. Those verdicts can be wrong — read the claim’s quote and the cited source before relying on one.
Statistics and arithmetic are recomputed, not judged.
Confidence bands are shown only for fields calibrated on our annotated test set. None is calibrated yet, so no band is shown.
What counts as a claim ›How we measure confidence ›How we check this ›
Are you an author, or do you see a problem with this page? Request a review
