

The DOI matches its Crossref record; 69 of the 69 references it cites were found in a registry or an index.
Large-scale genome-wide analysis links lactic acid bacteria from food with the gut microbiome
Open accessAbstract
Lactic acid bacteria (LAB) are fundamental in the production of fermented foods and several strains are regarded as probiotics. Large quantities of live LAB are consumed within fermented foods, but it is not yet known to what extent the LAB we ingest become members of the gut microbiome. By analysis of 9445 metagenomes from human samples, we demonstrate that the prevalence and abundance of LAB species in stool samples is generally low and linked to age, lifestyle, and geography, with Streptococcus thermophilus and Lactococcus lactis being most prevalent. Moreover, we identify genome-based differences between food and gut microbes by considering 666 metagenome-assembled genomes (MAGs) newly reconstructed from fermented food microbiomes along with 154,723 human MAGs and 193,078 reference genomes. Our large-scale genome-wide analysis demonstrates that closely related LAB strains occur in both food and gut environments and provides unprecedented evidence that fermented foods can be indeed regarded as a possible source of LAB for the gut microbiome.
Overview
The claims and statistics of this paper haven’t been checked yet.
Run the check — free, no account needed. It reads the open-access text and checks the sources it cites.
Integrity signals
Registry
Cites
Statistics
Figures
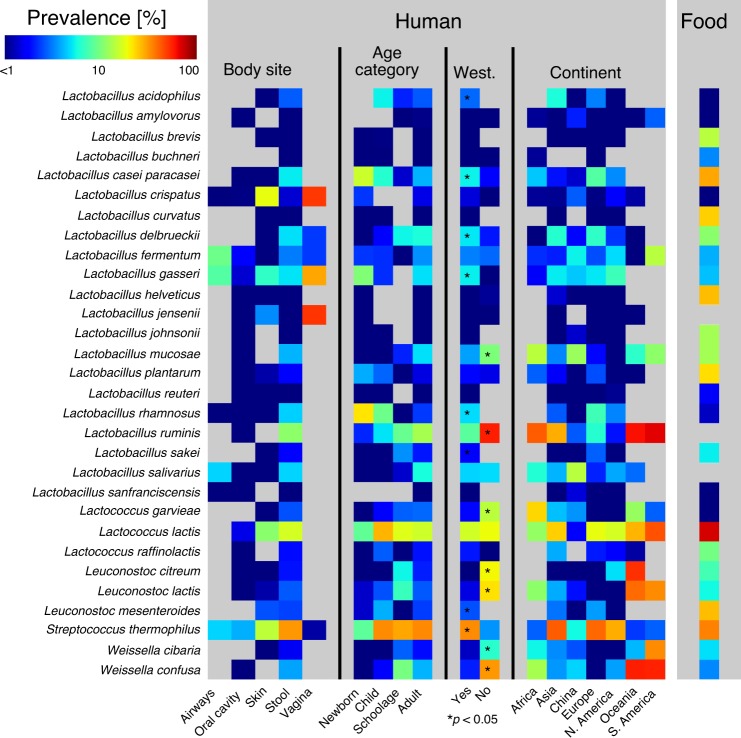
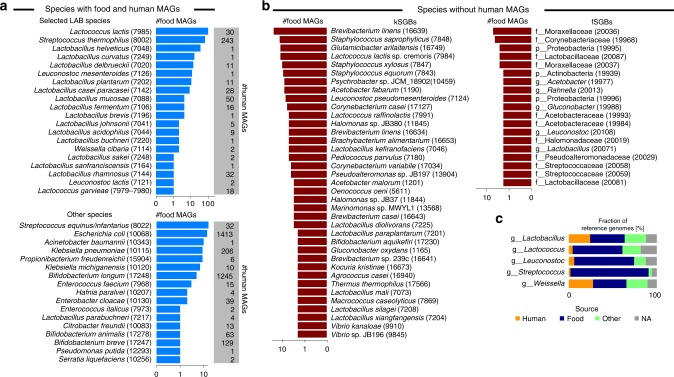
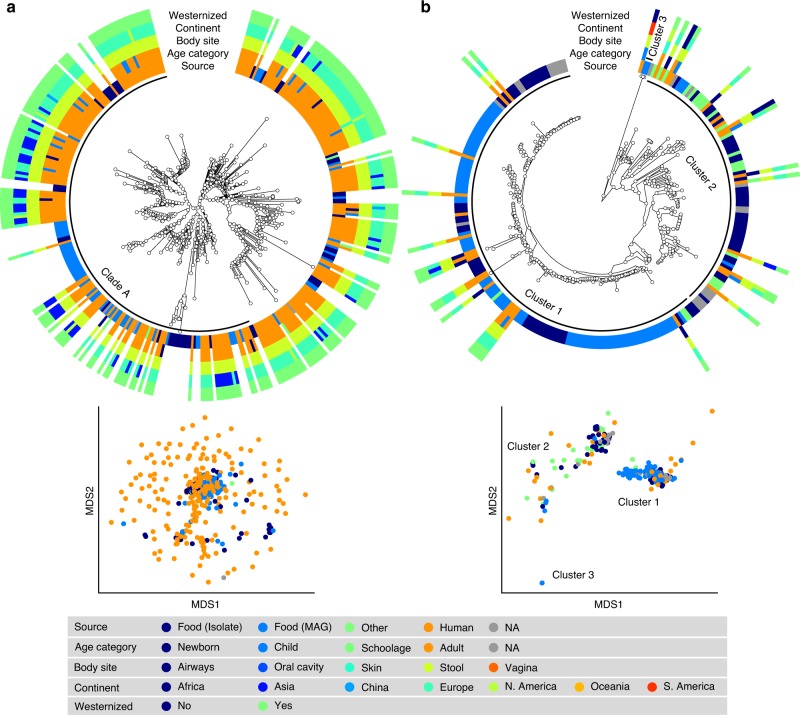
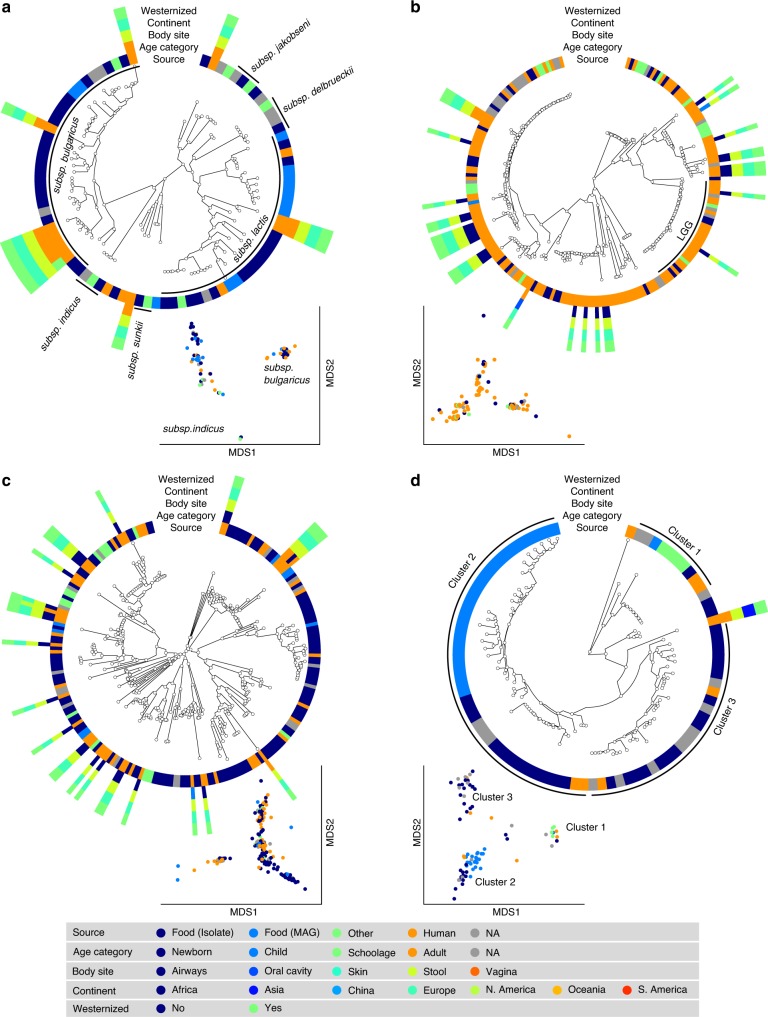
Verification
Claims the paper makes
The claims and statistics of this paper haven’t been checked yet.
Run the check — free, no account needed. It reads the open-access text and checks the sources it cites.
Claims other papers make about this one
Each is checked against this paper’s own text: does it say what the citing paper says it does?
The cited source says what the claim attributes to it.
In the citing paper
“and early evidence of dietary microbes becoming human microbiome members motivates a more comprehensive investigation of this phenomenon across food types and human populations. 44-47”
From Unexplored microbial diversity from 2,500 food metagenomes and links with the human microbiome. (2024) · cites this paper as [45]
The cited source says what the claim attributes to it.
In the citing paper
“Moreover, whether food microbes detected in the humangutareindeed microbiome colonizers or simply transient requires further investigation. 45”
From Unexplored microbial diversity from 2,500 food metagenomes and links with the human microbiome. (2024) · cites this paper as [45]
The cited source says what the claim attributes to it.
In the citing paper
“which play a vital role in dairy-the most sampled category-and are commonly found in the human gut.”
From Unexplored microbial diversity from 2,500 food metagenomes and links with the human microbiome. (2024) · cites this paper as [45]
In the citing paper
“a species otherwise very rarely found in gut metagenomes of westernized and non-westernized communities.56”
From Maternal and food microbial sources shape the infant microbiome of a rural Ethiopian population (2023) · cites this paper as [56]
Self-check
Percentages, sums and reported differences re-computed from the paper’s own numbers.
The self-check needs the paper’s full text.
Citations
Cites
Basic local alignment search tool
Altschul, S. F., Gish, W., Miller, W., Myers, E. W., & Lipman, D. J. (1990) · Journal of Molecular Biology · doi:10.1006/jmbi.1990.9999 · Cited by 98,669
MAFFT Multiple Sequence Alignment Software Version 7: Improvements in Performance and Usability
Katoh, K., & Standley, D. M. (2013) · Molecular Biology and Evolution · doi:10.1093/molbev/mst010 · Cited by 46,209
RAxML version 8: a tool for phylogenetic analysis and post-analysis of large phylogenies
Stamatakis, A. (2014) · Bioinformatics · doi:10.1093/bioinformatics/btu033 · Cited by 32,291
Prokka: rapid prokaryotic genome annotation
Seemann, T. (2014) · Bioinformatics · doi:10.1093/bioinformatics/btu153 · Cited by 18,937
FastTree 2 – Approximately Maximum-Likelihood Trees for Large Alignments
Price, M. N., Dehal, P. S., & Arkin, A. P. (2010) · PLoS ONE · doi:10.1371/journal.pone.0009490 · Cited by 14,894
Parks, D. H., Imelfort, M., Skennerton, C. T., Hugenholtz, P., & Tyson, G. W. (2015) · Genome Research · doi:10.1101/gr.186072.114 · Cited by 12,496
trimAl: a tool for automated alignment trimming in large-scale phylogenetic analyses
Capella-Gutiérrez, S., Silla-Martinez, J., & Gabaldón, T. (2009) · Bioinform. · doi:10.1093/bioinformatics/btp348 · Cited by 12,052
Hill (2014) · doi:10.1038/nrgastro.2014.66 · Cited by 9,592
High throughput ANI analysis of 90K prokaryotic genomes reveals clear species boundaries
Jain, C., Rodriguez-R, L. M., Phillippy, A. M., Konstantinidis, K. T., & Aluru, S. (2018) · Nature Communications · doi:10.1038/s41467-018-07641-9 · Cited by 5,748
Roary: rapid large-scale prokaryote pan genome analysis
Page, A. J., Cummins, C. A., Hunt, M., Wong, V. K., Reuter, S., Holden, M. T. G., Fookes, M., Falush, D., Keane, J. A., & Parkhill, J. (2015) · Bioinformatics · doi:10.1093/bioinformatics/btv421 · Cited by 5,736
Cited by
Sorted by citations
Items 201–300 of 375
Myoung, K.-S., Choi, E.-J., Kim, S., Hwang, J. A., Lee, J. Y., Kim, H.-J., & Hwang, J. S. (2024) · Biotechnology and Bioprocess Engineering · doi:10.1007/s12257-024-00132-3 · Cited by 8
Ahsan, A., Mazhar, B., Khan, M. K., Mustafa, M., Hammad, H. M., & Ali, N. M. (2021) · ADMET & DMPK · doi:10.5599/admet.1053 · Cited by 8
Biogenic action of Lactobacillus plantarum SBT2227 promotes sleep in Drosophila melanogaster
Ko, T., Murakami, H., Kamikouchi, A., & Ishimoto, H. (2022) · iScience · doi:10.1016/j.isci.2022.104626 · Cited by 9
Bamgbose, T., Sinha, S., Abdullahi, I. O., Inabo, H. I., Bellò, M., Kori, L. D., Ametefe, E. N., & Anvikar, A. R. (2022) · Current Topic in Lactic Acid Bacteria and Probiotics · doi:10.35732/ctlabp.2022.8.1.17 · Cited by 8
Danielewicz, A., Morze, J., Staniewska, K., Dąbrowska, A. Z., Sawicki, T., Yang, Z., Baranowska, M., Darewicz, M., Żulewska, J., Staniewski, B., et al. (2022) · Nutrients · doi:10.3390/nu14235018 · Cited by 8
Belkacemi, S., Alou, M. T., Million, M., Levasseur, A., Khelaifia, S., & Raoult, D. (2020) · Research Square · doi:10.21203/rs.3.rs-117420/v1 · Cited by 9
aurora: a machine learning gwas tool for analyzing microbial habitat adaptation
Bujdoš, D., Walter, J., & O’Toole, P. W. (2025) · Genome biology · doi:10.1186/s13059-025-03524-7 · Cited by 7
Park, J.-W., Yun, Y.-E., Cho, J. A., Yoon, S.-I., In, S.-A., Park, E., & Kim, M. (2025) · Nature Communications · doi:10.1038/s41467-025-58856-6 · Cited by 7
Jia, S., Lin, S., Liu, Q., Wang, S., Chen, X., & Sun, N. (2024) · Food Bioscience · doi:10.1016/j.fbio.2024.105254 · Cited by 7
LSQP-DB: a species-specific quantitative PCR primer database for 307 Lactobacillaceae species
Du, R., Wang, S., Wu, Q. J., & Xu, Y. (2022) · Systems Microbiology and Biomanufacturing · doi:10.1007/s43393-022-00128-1 · Cited by 7
The hidden diversity of food microbiomes
Pasolli, E., & Ercolini, D. (2025) · Current Opinion in Food Science · doi:10.1016/j.cofs.2025.101318 · Cited by 7
Self-citationLugli, G. A., Argentini, C., Tarracchini, C., Longhi, G., Mancabelli, L., Bianchi, M. G., Taurino, G., Amaretti, A., Candeliere, F., Bussolati, O., et al. (2025) · Applied and Environmental Microbiology · doi:10.1128/aem.01547-25 · Cited by 6
Zhai, Y., & Wei, C. (2022) · Frontiers in Microbiology · doi:10.3389/fmicb.2022.948138 · Cited by 6
Cao, J., Zhang, J., Wu, H., Lin, Y., Fang, X., Yun, S., Du, M., Su, S., Liu, Y., Wang, N., et al. (2025) · Microorganisms · doi:10.3390/microorganisms13050957 · Cited by 5
Chinese soy-based microbiome and associated microbial risks: a metagenomic investigation
Xiang, X., Li, Y., Ye, J., Li, B., He, G., Zhu, M., Zhang, J., Zhang, B., Miao, M., & Yang, Y. (2025) · npj Biofilms and Microbiomes · doi:10.1038/s41522-025-00768-w · Cited by 6
Bai, X., Lu, F., Jing, Y., Wang, H., Qian, H., Zhang, M., Zhai, Z., & Hao, Y. (2025) · Nutrients · doi:10.3390/nu17223555 · Cited by 7
Mosiej, W., Długosz, E., Kruk, M., & Zielińska, D. (2025) · Molecular Nutrition & Food Research · doi:10.1002/mnfr.70047 · Cited by 6
Liu, Y., Zhang, S., Liao, J., Khan, N. A., Tang, S., Zhou, C., Tan, Z., Elnagar, A., Rehan, I. F., Zigo, F., et al. (2025) · Frontiers in Veterinary Science · doi:10.3389/fvets.2025.1557614 · Cited by 7
Farajipour, H., Sadr, S., Matin, H. R., Aschner, M., Asemi, Z., Banikazemi, Z., Mirzaei, H., & Taghizadeh, M. (2022) · Journal of Immunoassay and Immunochemistry · doi:10.1080/15321819.2022.2159765 · Cited by 5
Yamane, K., Tanizawa, Y., Kobayashi, H., Kamizono, T., Kojima, Y., Takagi, H., & Tohno, M. (2024) · INTERNATIONAL JOURNAL OF SYSTEMATIC AND EVOLUTIONARY MICROBIOLOGY · doi:10.1099/ijsem.0.006517 · Cited by 5
Daily, J. W., & Park, S. (2024) · Journal of Ethnic Foods · doi:10.1186/s42779-024-00255-1 · Cited by 5
Ficoseco, C. A., Chieffi, D., Montemurro, M., Bavaro, A. R., Rizzello, C. G., Nader-Macı́as, M. E., Fadda, S., Fanelli, F., Fusco, V., & Vignolo, G. M. (2025) · Environmental Microbiology Reports · doi:10.1111/1758-2229.70176 · Cited by 4
Nam, E. H., Lee, M., Kim, H., Kim, D., Lee, Y., Jung, Y. H., Yang, J., & Shin, M. (2025) · Scientific Reports · doi:10.1038/s41598-025-20976-w · Cited by 5
Zhang, J., Wang, X., Wang, D., Zheng, Z., Wang, H., & La, M. (2026) · mSystems · doi:10.1128/msystems.00800-25 · Cited by 5
Dietary influence on human microbiome
Requena, T., de Zaldívar, B. S., Peláez, C., & Martínez‐Cuesta, M. C. (2022) · Elsevier eBooks · doi:10.1016/b978-0-323-91313-3.00007-6 · Cited by 4
Wang, Y., Liu, S., Zhao, Q., Wang, N., Liu, X., Zhang, T., He, G., Zhao, G., Jiang, Y., & Chen, B. (2024) · Nutrients · doi:10.3390/nu16020214 · Cited by 4
Rocchetti, M. T., Chiano, M. D., Elouardi, I., & Fiocco, D. (2025) · Global Pediatrics · doi:10.1016/j.gpeds.2025.100266 · Cited by 6
Hlangwani, E., & Doorsamy, W. (2023) · Elsevier eBooks · doi:10.1016/b978-0-323-98341-9.00008-6 · Cited by 4
CH-Bin: A convex hull based approach for binning metagenomic contigs
Chandrasiri, S., Perera, T. D. R., Dilhara, A., Perera, I., & Mallawaarachchi, V. (2022) · Computational Biology and Chemistry · doi:10.1016/j.compbiolchem.2022.107734 · Cited by 4
Wang, X. R., Xu, X., Zhang, J., & Xu, H. (2024) · Food Bioscience · doi:10.1016/j.fbio.2024.104528 · Cited by 4
Iannotti, L. L., García, A. M. R., Palma, G., Fontaine, F., Scherf, B., Neufeld, L. M., Zimmerman, R., & Fracassi, P. (2024) · Nutrients · doi:10.3390/nu16193231 · Cited by 5
Zang, J., Xiao, L., Zhao, X., Shi, Y., Ma, K., Zhang, C., Geng, S., Rui, X., Lin, T., & Li, W. (2026) · Critical Reviews in Food Science and Nutrition · doi:10.1080/10408398.2026.2631641 · Cited by 3
Eilers, T., Delanghe, L., Boeck, I. D., Rillaer, T. V., Malderen, J. V., Bakelants, S., Beeck, W. V., Wittouck, S., & Lebeer, S. (2026) · Scientific Reports · doi:10.1038/s41598-026-41449-8 · Cited by 3
Riley, T. M., Nagpal, R., Dawson, M. A., Hughes, D., Lee, Y., Kris‐Etherton, P. M., & Berryman, C. E. (2026) · Clinical Nutrition ESPEN · doi:10.1016/j.clnesp.2026.103414 · Cited by 3
Miller, E. M. (2023) · doi:10.1093/oso/9780197665718.001.0001 · Cited by 3
Opioid trail: Tracking contributions to opioid use disorder from host genetics to the gut microbiome
Duffy, E. P., Bachtell, R. K., & Ehringer, M. A. (2023) · Neuroscience & Biobehavioral Reviews · doi:10.1016/j.neubiorev.2023.105487 · Cited by 4
Chaudhari, D. N., Ahire, J. J., Devkatte, A. N., & Kulthe, A. A. (2024) · Probiotics and Antimicrobial Proteins · doi:10.1007/s12602-024-10385-2 · Cited by 3
Effect of food ingredients on susceptible gut indigenous bacteria
Kuda, T., & Brandelli, A. (2022) · Elsevier eBooks · doi:10.1016/b978-0-323-85170-1.00022-1 · Cited by 3
Strain-specific effect of Streptococcus thermophilus consumption on host physiology
Yu, P., Jiang, Y., Pan, Y., Guo, M., Yang, B. K., Liu, X., Zhao, J., Zhang, H., & Chen, W. (2023) · Food Science and Human Wellness · doi:10.26599/fshw.2022.9250233 · Cited by 3
Qiao, N., Gaur, G., Modesto, M., Chinnici, F., Scarafile, D., Borruso, L., Marín, A. C., Spiezio, C., Valente, D., Sandri, C., et al. (2023) · Journal of Applied Microbiology · doi:10.1093/jambio/lxad255 · Cited by 3
Chen, F., Zhao, L., Huang, L., Zhuo, Y., Xu, S., Lin, Y., Che, L., Feng, B., Wu, D., & Fang, Z. (2025) · Frontiers in Veterinary Science · doi:10.3389/fvets.2025.1554919 · Cited by 3
Reiprich, A., Skalden, L., Raab, A., Bolotina, N., & Lang, C. (2022) · Beneficial Microbes · doi:10.3920/bm2021.0103 · Cited by 3
Bioprotective Cultures and Bacteriocins for Food
Arbulu, S., Gómez‐Sala, B., García-Gutiérrez, E., & Cotter, P. D. (2022) · Wiley eBooks · doi:10.1002/9781119762621.ch9 · Cited by 4
Self-citationLebeer, S., Eilers, T., Delanghe, L., Boeck, I. D., Rillaer, T. V., Malderen, J. V., Bakelants, S., Beeck, W. V., & Wittouck, S. (2024) · Research Square · doi:10.21203/rs.3.rs-4182624/v1 · Cited by 3
Public Health Policies and Fermented Food Consumption
Dey, G., Ray, R. C., & Paramithiotis, S. (2024) · Springer eBooks · doi:10.1007/978-3-031-72000-0_17 · Cited by 2
Removal of sequencing adapter contamination improves microbial genome databases
Moeller, A. H., Dillard, B. A., Goldman, S. L., Real, M. V. F., & Sprockett, D. D. (2024) · BMC Genomics · doi:10.1186/s12864-024-10956-1 · Cited by 2
Starter Cultures: General Aspects
Powell, I. B., Zotta, T., & Parente, E. (2025) · Elsevier eBooks · doi:10.1016/b978-0-443-15956-5.00037-3 · Cited by 2
Botta, C., Spada, D., Buzzanca, D., Zadeh, N. S., Tsoureki, D., Biolcati, F., Ferrocino, I., Zeppa, G., & Dolci, P. (2025) · Food Research International · doi:10.1016/j.foodres.2025.117039 · Cited by 3
Edible microbiome and dietary microbiota: bridging two interrelated concepts
KOSTIC, T. M., Berg, G., Cotter, P. D., & Wicaksono, W. A. (2025) · Current Opinion in Food Science · doi:10.1016/j.cofs.2025.101356 · Cited by 2
Self-citationFentie, E. G., Lim, K., Ebabuye, Y., Park, S., & Shina, J.-H. (2026) · Current Research in Food Science · doi:10.1016/j.crfs.2026.101318 · Cited by 2
Wang, Y., An, M., Lv, Y., Hou, Y., Li, Z., Dai, J., Ni, W., & Hu, S. (2026) · Journal of Dairy Science · doi:10.3168/jds.2025-27589 · Cited by 3
Distinct signatures in the human gut and oral microbiomes of gastric cancer
Qin, Y., Zhang, Y.-X., Liu, L.-P., Xie, Y.-H., Ma, X.-Y., Hao, Y., Zhao, L.-C., Dong, J.-J., He, Y., Sun, K., et al. (2026) · Cell Reports Medicine · doi:10.1016/j.xcrm.2026.102761 · Cited by 3
High-throughput technologies in probiotics science
Stincone, P., Brandelli, A., & Angelis, M. D. (2022) · Elsevier eBooks · doi:10.1016/b978-0-323-85170-1.00010-5 · Cited by 2
Current Status and Prospects for Standards, Regulations, and Detection of Probiotic Yogurt: Review
Chon, J., Seo, K., Kim, T.-J., Youn, H., Kang, S.-H., Hwang, W.-U., Jeong, H., Jeong, D., & Song, K. (2023) · Journal of Dairy Science and Biotechnology · doi:10.22424/jdsb.2023.41.1.9 · Cited by 2
Dorsey, A., & Miller, E. M. (2023) · Evolutionary Anthropology (print) · doi:10.1002/evan.22004 · Cited by 2
The Microbiome, Metabolism, and Networks in Precision Nutrition
Mensah, G. E., Maseng, M. G., Allard, S., & Gilbert, J. A. (2024) · Precision Nutrition · doi:10.1016/b978-0-443-15315-0.00011-0 · Cited by 2
Park, C. E., Jo, Y., Jung, D.-R., Park, H.-C., & Shin, J. (2024) · Microorganisms · doi:10.3390/microorganisms12071419 · Cited by 2
Holmes, C., Illingworth, C. H., & Parry, L. (2024) · eFood · doi:10.1002/efd2.70023 · Cited by 2
Suzuki–Hashido, N., Tsuchida, S., Azumano, A., Goossens, B., Saldivar, D. A. R., Stark, D. J., Tuuga, A., Ushida, K., & Matsuda, I. (2023) · Microorganisms · doi:10.3390/microorganisms11061458 · Cited by 2
Somerville, V., Schowing, T., Chabas, H., Schmidt, R. S., von Ah, U., Bruggmann, R., & Engel, P. (2022) · bioRxiv (Cold Spring Harbor Laboratory) · doi:10.1101/2022.04.13.488139 · Cited by 2
Harke, A. S., Josephs-Spauling, J., Mohite, O. S., Chauhan, S., Ardalani, O., Palsson, B. Ø., & Phaneuf, P. V. (2023) · bioRxiv (Cold Spring Harbor Laboratory) · doi:10.1101/2023.09.22.558971 · Cited by 2
Luo, X., Hounmanou, Y. M. G., Ndayisenga, F., & Yu, Z. (2024) · The Science of The Total Environment · doi:10.1016/j.scitotenv.2024.172712 · Cited by 1
Isolation and identification of probiotic lactobacilli from ruminant animals
Abdou, A. M., Syame, S. M., Bakry, M. A., Effat, M. M., & Fouad, E. A. (2024) · Egyptian Pharmaceutical Journal · doi:10.4103/epj.epj_222_23 · Cited by 1
“Gut” to grips with the science of the microbiome – a symposium report
Finnegan, Y. E., Neill, H. R., Prpa, E. J., & Pot, B. (2024) · Gut Microbiome · doi:10.1017/gmb.2024.8 · Cited by 2
Anti-Inflammatory potential of lactic acid bacteria for dairy cows during the periparturient period
Ma, Y., Gao, X., Elsabagh, M., Feng, Y., Chen, Y. Q., Cheng, L., Li, Z., Chen, H., & Liu, F. (2025) · Animal Feed Science and Technology · doi:10.1016/j.anifeedsci.2025.116234 · Cited by 1
Nutrition, Diet, and Anti-aging: Fermented Foods and Anti-aging
Naito, Y. (2024) · Springer eBooks · doi:10.1007/978-981-97-8514-8_93 · Cited by 1
Sahran, N., Chong, C. W., Ismail, I. H., Taib, F., Hoo, P. S., Palanisamy, U. D., Sundralingam, U., Teh, C. S. J., Kong, Z.-X., Ayub, Q., et al. (2025) · Beneficial Microbes · doi:10.1163/18762891-bja00074 · Cited by 2
Global biosynthetic potential of secondary metabolite in human-associated Lactobacillaceae family
Du, R., Han, F., Chang, W., Xu, Y., Madadi, M., Wu, Q. J., & Khaneghah, A. M. (2025) · Food Bioscience · doi:10.1016/j.fbio.2025.107009 · Cited by 1
Qi, Y., Patel, M., Lu, S.-Y., & Skory, C. D. (2025) · Bioresource Technology · doi:10.1016/j.biortech.2025.132836 · Cited by 1
Application of synthetic biology in development of probiotic strains and delivery systems
Arte, P. A., Yin, J., Sarkar, S., Rajasekharan, S. K., Jobby, R., Tungare, K., & Ravichandran, V. (2025) · Elsevier eBooks · doi:10.1016/b978-0-443-27594-4.00018-8 · Cited by 1
Azimov, M., Cohen-Michnik, I., Rottenstreich, M., Katz, L. H., Zeigerman, H., & Yona, A. H. (2025) · The American Journal of Gastroenterology · doi:10.14309/ajg.0000000000003740 · Cited by 1
Functional Properties of Lactic Acid Bacteria Postbiotics Isolated from Tarhana Samples
Aydın, E., Albayrak, Ç. B., & Boyacioğlu, O. (2025) · Probiotics and Antimicrobial Proteins · doi:10.1007/s12602-025-10748-3 · Cited by 1
Exploring New Species of Lactic Acid Bacteria in Fermented Foods: A Case Study of Zha‐Chili
Qu, D., Wang, Y., Yan, L., Hou, Q., Zhao, H., & Guo, Z. (2025) · Food Science & Nutrition · doi:10.1002/fsn3.71090 · Cited by 1
Calderón, D. R., Sandholm, R. M., Samskott, T., Mjøs, M. T., Lorentsen, E. D., Røhr, Å. K., Bakke, I., & Rosa, S. L. L. (2026) · Applied and Environmental Microbiology · doi:10.1128/aem.02409-25 · Cited by 1
Sun, Y., Gao, Q., Meng, H., Zhang, C., Rui, X., Chen, X., & Zhang, Q. (2026) · Journal of the Science of Food and Agriculture · doi:10.1002/jsfa.70613 · Cited by 1
Kiplimo, D., Sánchez, A. M., Ramakrishnan, D. K., Wicaksono, W. A., Mwirichia, R., Teixidó, N., Berg, G., & Abdelfattah, A. (2026) · Environmental Microbiome · doi:10.1186/s40793-026-00880-0 · Cited by 1
Falana, M. B., Nurudeen, Q. O., Asinmi, M. R., & Dikwa, M. A. (2026) · npj Science of Food · doi:10.1038/s41538-026-00844-1 · Cited by 1
Hernandez, M. G. R., Beauséjour, M., Wolodko, J., & Gänzle, M. G. (2026) · Advances in food and nutrition research · doi:10.1016/bs.afnr.2026.04.002 · Cited by 2
Characterizing microbiomes of African fermented foods in a global context
Leech, J., Obafemi, Y. D., Breselge, S., Aremu, T., Obadina, A. O., Martins, I. E., Ezekiel, C. N., Parkouda, C., Tankoano, A., Traoré, K., et al. (2026) · Microbiology · doi:10.1099/mic.0.001695 · Cited by 1
Self-citationUnlocking microbial potential to advance nutritious and sustainable food systems
Liu, D., Cong, W., Davis, K. F., Singh, B. K., Chen, Q., Courty, P., Ali, T., Pan, B., Siddique, K. H. M., & Zhang, F. S. (2026) · One Earth · doi:10.1016/j.oneear.2026.101714 · Cited by 1
Genomic and biosynthetic landscape of high-temperature Daqu microbiome
Cheng, M., Qin, X., Han, Y., Tan, F., She, M., Xue, Z., Yuan, L., Teng, M., Ou, X., Luo, S., et al. (2026) · Bioresource Technology · doi:10.1016/j.biortech.2026.135297 · Cited by 1
Bujdoš, D., Walter, J., & O’Toole, P. W. (2026) · The ISME Journal · doi:10.1093/ismejo/wrag198 · Cited by 1
Le rôle du microbiote en santé humaine
Lecerf, J. (2021) · Actualités Pharmaceutiques · doi:10.1016/j.actpha.2021.04.003 · Cited by 1
Les yaourts, des produits laitiers fermentés
Lecerf, J. (2021) · Pratiques en nutrition · doi:10.1016/j.pranut.2021.09.005 · Cited by 1
Probiotics: Promising Opportunity for Future Functional Foods
Verma, M., & Rout, P. K. (2022) · Springer eBooks · doi:10.1007/978-981-16-8125-7_5 · Cited by 1
Roy, C. I. L., Kurilshikov, A., Leeming, E. R., Visconti, A., Bowyer, R. C. E., Menni, C., Falchi, M., Koutníková, H., Veiga, P., Zhernakova, A., et al. (2020) · doi:10.21203/rs.3.rs-38248/v1 · Cited by 1
Hồ, P.-H., Pham, T., Truong, Q., Nguyen, L.-H., Nguyen, T., Dam, H., Nguyen, C., Nguyen, H. T., Phi, Q., Nguyen, H. A., et al. (2022) · Wiley eBooks · doi:10.1002/9781119702160.ch2 · Cited by 1
Akuzawa, R., Miura, T., & SURONO, I. S. (2021) · Encyclopedia of Dairy Sciences · doi:10.1016/b978-0-12-818766-1.00099-4 · Cited by 1
Zhang, D., Zhang, J., Kalimuthu, S., Liu, J., Song, Z., He, B., Cai, P., Zhong, Z., Feng, C., Neelakantan, P., et al. (2022) · bioRxiv (Cold Spring Harbor Laboratory) · doi:10.1101/2022.07.03.498435 · Cited by 1
Yu, P., Jiang, Y., Pan, Y., Guo, M., Yang, B. K., Liu, X., Zhao, J., Zhang, H., & Chen, W. (2022) · Research Square · doi:10.21203/rs.3.rs-2012853/v1 · Cited by 1
Ecological factors that drive microbial communities in culturally diverse fermented foodsPreprint
Gautam, A., Poopalarajah, R., Ahmad, A. R., Rana, B., Denekew, T. W., Anh, N., Utenova, L., Kunwar, Y. S., Bhandari, N. N., & Jha, A. R. (2024) · bioRxiv (Cold Spring Harbor Laboratory) · doi:10.1101/2024.08.20.608727 · Cited by 1
Exploring the Microbiome of Fermented Soy Products: Implications for Gut Health in ChinaPreprint
Xiang, X., Li, Y., Ye, J., Li, B., He, G., Zhu, M., Zhang, J., Zhang, B., Miao, M., & Yang, Y. (2024) · Research Square · doi:10.21203/rs.3.rs-4982604/v1 · Cited by 1
Utilité nutritionnelle et fonctionnelle de la biodiversité des ferments fromagers
Foligné, B., & Desmasures, N. (2020) · Pratiques en nutrition · doi:10.1016/j.pranut.2020.09.009
Li, Q. (2020) · ERA: Education and Research Archive (University of Alberta) · doi:10.7939/r3-4jd8-n098
Multivariate statistical monitoring system for microbial population dynamics
Ishiya, K., & Aburatani, S. (2021) · Physical Biology · doi:10.1088/1478-3975/ac3ad6
Biogenic Action of Lactobacillus plantarum SBT2227 Promotes Sleep in Drosophila melanogasterPreprint
Ko, T., Murakami, H., Kamikouchi, A., & Ishimoto, H. (2021) · SSRN Electronic Journal · doi:10.2139/ssrn.3974126
Roy, C. I. L., Kurilshikov, A., Leeming, E. R., Visconti, A., Bowyer, R. C. E., Menni, C., Falchi, M., Koutníková, H., Veiga, P., Zhernakova, A., et al. (2020) · doi:10.21203/rs.3.rs-99718/v1
Kim, H., Oh, N., Kwon, M., Kwon, O.-H., Ku, S., Seo, J., & Roh, S. (2022) · Research Square · doi:10.21203/rs.3.rs-1613141/v1
Metataxonomic insights in the distribution of Lactobacillaceae in foods and food environmentsPreprint
Parente, E., Zotta, T., Giavalisco, M., & Ricciardi, A. (2022) · bioRxiv (Cold Spring Harbor Laboratory) · doi:10.1101/2022.09.09.507241
Stege, P. B. (2022) · Utrecht University Repository (Utrecht University) · doi:10.33540/1530
Metadata
- Authors
- Pasolli, E., De Filippis, F., Mauriello, I. E., Cumbo, F., Walsh, A. M., Leech, J., Cotter, P. D., Segata, N., & Ercolini, D.
- Affiliations
- University of Naples Federico II (IT)
- University of Trento (IT)
- Teagasc - The Irish Agriculture and Food Development Authority (IE)
- Corresponding author
- Ercolini, Danilo
- ORCID
- Venue
- Nature Communications
- Published
- 2020-05-25
- Volume
- 11
- Issue
- 1
- Pages
- 2610-2610
- ISSN
- 2041-1723 (ISSN-L)
- PMC
- PMC7248083
- OpenAlex
- W3027854790
- Cited by
- 367
- References
- 67
- Citations by year
- 2026: 41 · 2025: 59 · 2024: 49 · 2023: 78 · 2022: 74 · 2021: 51 · 2020: 14
- FWCI
- 4.75
- Type
- journal article
- Language
- en
- Open access
- gold
- doi.org
- Locations
- Nature Communications (publishedVersion, cc-by)
- PubMed Central (publishedVersion, cc-by)
- PubMed (publishedVersion)
- Arrow@dit (Dublin Institute of Technology) (acceptedVersion)
- HAL (submittedVersion)
- RePEc: Research Papers in Economics (submittedVersion)
- DOAJ (DOAJ: Directory of Open Access Journals) (submittedVersion, cc-by-sa)
- Institutional Research Information System (Università degli Studi di Trento) (submittedVersion, cc-by)
- T-Stór (Teagasc) (submittedVersion, cc-by-nc-sa)
- Lenus, The Irish Health Repository (Dr Steevens Hospital Library) (submittedVersion)
- Funders
- Joint Programming Initiative A healthy diet for a healthy life
- European Commission (HORIZON2020, 818368)
- Topics
- Life Sciences › Agricultural and Biological Sciences › Food Science › Probiotics and Fermented Foods
- Life Sciences › Biochemistry, Genetics and Molecular Biology › Molecular Biology › Gut microbiota and health
- Life Sciences › Biochemistry, Genetics and Molecular Biology › Molecular Biology › Genomics and Phylogenetic Studies
- Keywords
- lactic acid bacteria, gut microbiota, fermented foods, probiotics, metagenome-assembled genomes, Streptococcus thermophilus, Lactococcus lactis, human gut metagenome
- MeSH terms
- Gastrointestinal Microbiome, Fermented Foods, Animals, Food Microbiology, Humans, Life Style, Primates, Lactococcus lactis, Probiotics, Databases, Genetic, Streptococcus thermophilus, Metagenome, Lactobacillales
About these checks
Registry, retraction, Cites and statistics results are computed, not judged, with one exception: a printed reference that no index lists is read once by a model before it counts as a citation error. Claims are extracted by a model and kept only when their quote appears verbatim in the text; each cited source is then checked, with a model’s help, for whether it says what the claim relies on. Those verdicts can be wrong — read the claim’s quote and the cited source before relying on one.
Statistics and arithmetic are recomputed, not judged.
Confidence bands are shown only for fields calibrated on our annotated test set. None is calibrated yet, so no band is shown.
What counts as a claim ›How we measure confidence ›How we check this ›
Are you an author, or do you see a problem with this page? Request a review
