Student or educator? Sign up with your school email and get 6 months of Pro free.
CoChat

The DOI matches its Crossref record; 126 of the 126 references it cites were found in a registry or an index.

Printable microscale interfaces for long-term peripheral nerve mapping and precision control

Open access

Published version of a preprint

Abstract

The nascent field of bioelectronic medicine seeks to decode and modulate peripheral nervous system signals to obtain therapeutic control of targeted end organs and effectors. Current approaches rely heavily on electrode-based devices, but size scalability, material and microfabrication challenges, limited surgical accessibility, and the biomechanically dynamic implantation environment are significant impediments to developing and deploying peripheral interfacing technologies. Here, we present a microscale implantable device – the nanoclip – for chronic interfacing with fine peripheral nerves in small animal models that begins to meet these constraints. We demonstrate the capability to make stable, high signal-to-noise ratio recordings of behaviorally-linked nerve activity over multi-week timescales. In addition, we show that multi-channel, current-steering-based stimulation within the confines of the small device can achieve multi-dimensional control of a small nerve. These results highlight the potential of new microscale design and fabrication techniques for realizing viable devices for long-term peripheral interfacing.

Overview

The claims and statistics of this paper haven’t been checked yet.

Free: it reads the open-access text and checks the first 5 claims that cite a source we can check. Create a free account to check every claim.

A few free checks a day · papers already verified open instantly · results are public

Integrity signals

Registry

Crossref · 10.1038/s41467-020-18032-4

Cites

126 of 126 references verified0 citation errors · 0 not checkable

Statistics

Figures

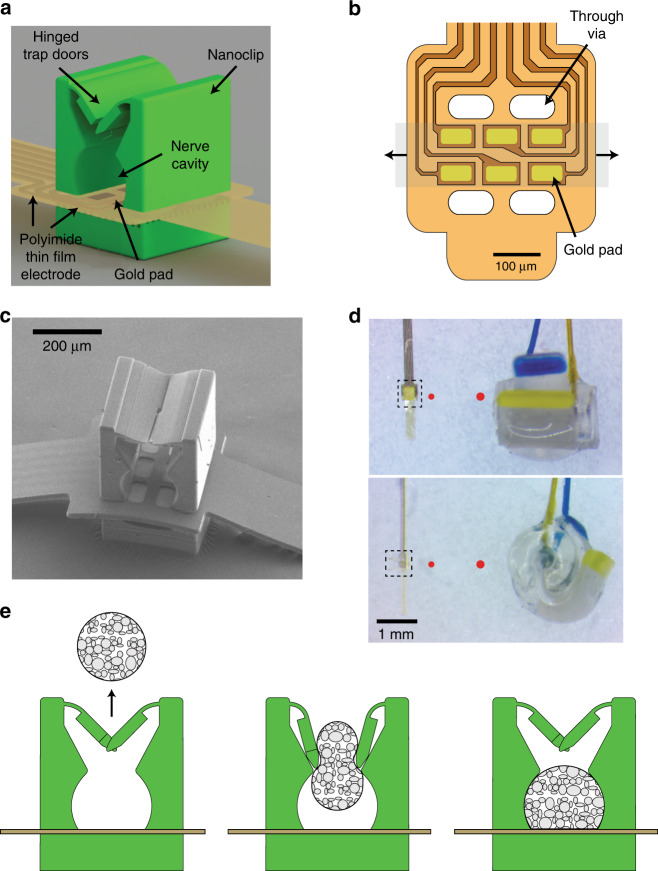
Fig. 1 Thin-film-integrated nanoclip nerve interface overview. a Rendering of a thin-film-integrated nanoclip nerve interface showing key components. The nanoclip was fabricated directly on the thin-film electrode via rDLW29 and consists of two interlocking trap doors with elastically deformable hinges, a nerve retention cavity, and a rigid base. b Diagram of the polyimide thin-film electrode array used in all experiments. Six gold electrode pads (45 × 80 µm each) were located inside the nerve cavity (in (a)) such that they were in contact with the epineurium of the retained nerve. The thin-film through-vias allow for the mechanical integration of the nanoclip top and base (see Supplementary Fig. 2). The shaded gray region shows the location of a retained nerve; the arrows indicate the nerve axis. c SEM micrograph of the nanoclip nerve interface. d Micrograph of the nanoclip (left) and a Cortec silicone nerve cuff (right) sized for 150 and 200 µm nerves, respectively. Top image taken from overhead view; bottom shows the same devices in profile. Dashed bounding boxes highlight the printed anchor and approximate the region shown in (c). For comparison, the red circles show the diameter of the nerve for which each device is designed (i.e., left: 150 µm; right: 200 µm). e Schematic of implantation process: (left) the nanoclip is advanced toward an isolated nerve; (center) the nanoclip contacts the nerve resulting in elastic deformation of the trap doors and subsequent entry of the nerve into the central retention cavity; (right) as the nerve fills the cavity and contacts the electrode pads, the doors close behind the nerve to secure the nanoclip.
Fig. 1 Thin-film-integrated nanoclip nerve interface overview. a Rendering of a thin-film-integrated nanoclip nerve interface showing key components. The nanoclip was fabricated directly on the thin-film electrode via rDLW29 and consists of two interlocking trap doors with elastically deformable hinges, a nerve retention cavity, and a rigid base. b Diagram of the polyimide thin-film electrode array used in all experiments. Six gold electrode pads (45 × 80 µm each) were located inside the nerve cavity (in (a)) such that they were in contact with the epineurium of the retained nerve. The thin-film through-vias allow for the mechanical integration of the nanoclip top and base (see Supplementary Fig. 2). The shaded gray region shows the location of a retained nerve; the arrows indicate the nerve axis. c SEM micrograph of the nanoclip nerve interface. d Micrograph of the nanoclip (left) and a Cortec silicone nerve cuff (right) sized for 150 and 200 µm nerves, respectively. Top image taken from overhead view; bottom shows the same devices in profile. Dashed bounding boxes highlight the printed anchor and approximate the region shown in (c). For comparison, the red circles show the diameter of the nerve for which each device is designed (i.e., left: 150 µm; right: 200 µm). e Schematic of implantation process: (left) the nanoclip is advanced toward an isolated nerve; (center) the nanoclip contacts the nerve resulting in elastic deformation of the trap doors and subsequent entry of the nerve into the central retention cavity; (right) as the nerve fills the cavity and contacts the electrode pads, the doors close behind the nerve to secure the nanoclip.CC BY · PubMed Central
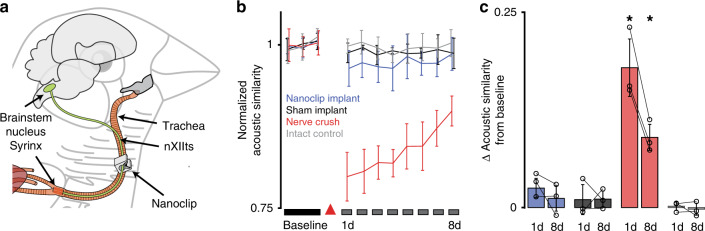
Fig. 2 Nanoclip nerve interface chronic implantation and functional safety. a Diagram of the nanoclip interface implanted on the nXIIts nerve of the zebra finch. b Functional assessment of nXIIts following bilateral nanoclip implant (blue), sham implant (black), nerve crush (red), or intact (gray) quantified as the acoustic similarity of baseline to post-manipulation song structure (see “Methods”). Line and error bars denote mean ± Std across n = 3 birds per condition. Red triangle marks day of surgery. c Summary statistics showing the difference in acoustic similarity between baseline song and songs produced on days 1 and 8 post manipulation. Colors denote experimental conditions as in (b). Each data point represents the mean across all motifs from a single bird. Bars and error bars denote mean ± Std across n = 3 birds per condition. Two-tailed paired t-test, day 1: P = 0.02; day 8: P = 0.016. *P < 0.05. Source data are provided as a Source Data File.
Fig. 2 Nanoclip nerve interface chronic implantation and functional safety. a Diagram of the nanoclip interface implanted on the nXIIts nerve of the zebra finch. b Functional assessment of nXIIts following bilateral nanoclip implant (blue), sham implant (black), nerve crush (red), or intact (gray) quantified as the acoustic similarity of baseline to post-manipulation song structure (see “Methods”). Line and error bars denote mean ± Std across n = 3 birds per condition. Red triangle marks day of surgery. c Summary statistics showing the difference in acoustic similarity between baseline song and songs produced on days 1 and 8 post manipulation. Colors denote experimental conditions as in (b). Each data point represents the mean across all motifs from a single bird. Bars and error bars denote mean ± Std across n = 3 birds per condition. Two-tailed paired t-test, day 1: P = 0.02; day 8: P = 0.016. *P < 0.05. Source data are provided as a Source Data File.CC BY · PubMed Central
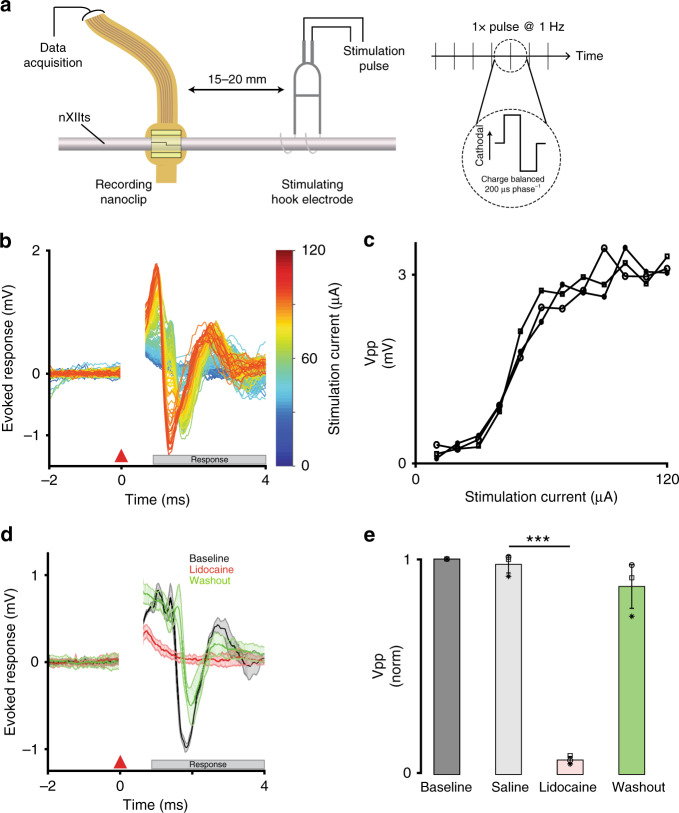
Fig. 3 Nanoclip-anchored thin-film arrays produce high-quality electroneurograms in acute preparations. a Schema for acute recording of evoked compound action potentials. (Left) Current-controlled stimulation was delivered via bipolar silver hook electrodes; evoked responses were recorded by a nanoclip interface implanted 15–20 mm rostrally. (Right) Biphasic, cathodal-leading stimulating pulses, 200 μs phase−1 at 10–120 μA, were delivered at 1 Hz for 16–24 trials. b Example of graded evoked response to increasing stimulation intensities. Stimulation applied at t = 0 ms; stimulation artifact appears t = 0–0.5 ms; evoked response follows. c Evoked response peak-to-peak voltage (Vpp) showed an expected sigmoidal relationship with stimulation intensity. Each data point indicates the mean across trials within an animal (n = 3 birds; 16–24 trials each per stimulation intensity). Symbols identify individual birds. d Example of stimulation evoked responses recorded before, during, and after local lidocaine application. Each condition shows mean ± SEM (shaded) for n = 16 trials; all responses evoked at 64 μA. e Evoked response peak-to-peak voltage for different experimental conditions. Response amplitudes were normalized to baseline condition to facilitate comparison across n = 3 animals. Each data point indicates the mean across 16 trials within an animal; symbols identify individual birds. Bars and error bars denote mean ± SEM across n = 3 birds per condition. Repeated-measures ANOVA, P = 0.003; Dunnett’s test P = 6 × 10⁻⁶. ***P < 0.001. Source data are provided as a Source Data File.
Fig. 3 Nanoclip-anchored thin-film arrays produce high-quality electroneurograms in acute preparations. a Schema for acute recording of evoked compound action potentials. (Left) Current-controlled stimulation was delivered via bipolar silver hook electrodes; evoked responses were recorded by a nanoclip interface implanted 15–20 mm rostrally. (Right) Biphasic, cathodal-leading stimulating pulses, 200 μs phase−1 at 10–120 μA, were delivered at 1 Hz for 16–24 trials. b Example of graded evoked response to increasing stimulation intensities. Stimulation applied at t = 0 ms; stimulation artifact appears t = 0–0.5 ms; evoked response follows. c Evoked response peak-to-peak voltage (Vpp) showed an expected sigmoidal relationship with stimulation intensity. Each data point indicates the mean across trials within an animal (n = 3 birds; 16–24 trials each per stimulation intensity). Symbols identify individual birds. d Example of stimulation evoked responses recorded before, during, and after local lidocaine application. Each condition shows mean ± SEM (shaded) for n = 16 trials; all responses evoked at 64 μA. e Evoked response peak-to-peak voltage for different experimental conditions. Response amplitudes were normalized to baseline condition to facilitate comparison across n = 3 animals. Each data point indicates the mean across 16 trials within an animal; symbols identify individual birds. Bars and error bars denote mean ± SEM across n = 3 birds per condition. Repeated-measures ANOVA, P = 0.003; Dunnett’s test P = 6 × 10⁻⁶. ***P < 0.001. Source data are provided as a Source Data File.CC BY · PubMed Central
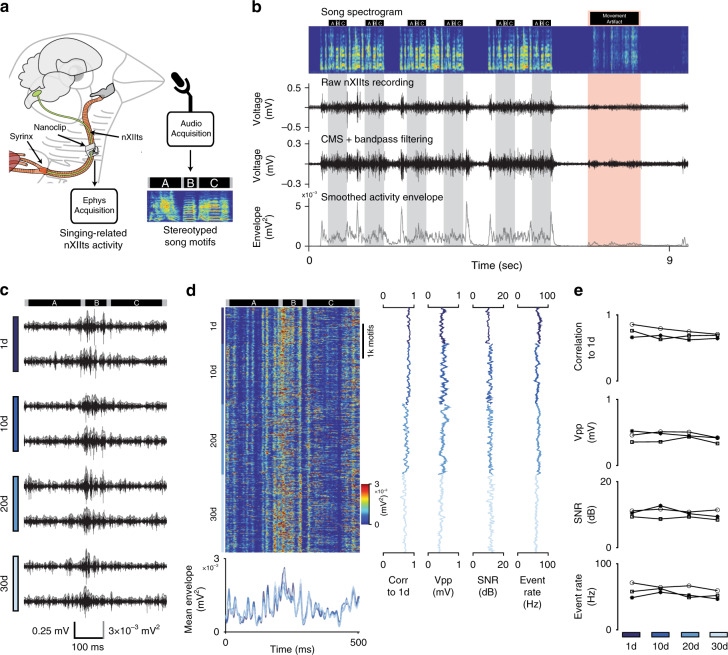
Fig. 4 Long-term stable recordings with minimal degradation over more than 4 weeks. a Schema for chronic recording of nXIIts activity in the singing bird. A nanoclip was implanted on the right-side nXIIts; song-triggered acquisition software captured both vocalization and concurrent nXIIts activity. Example song motif spectrogram from bird shown in (b–d); black bars above the spectrogram indicate the beginning and end of each syllable in the motif (“A,” “B,” and “C”). b Representative example of chronic nXIIts recording aligned to song. Top row: spectrogram of bird’s song containing three song bouts, each with two repeated motifs. Black bars above the spectrogram indicate song syllable boundaries; gray bands denote song motifs. Red band identifies movement-related noise and associated motion artifact in the electrophysiology recording. Second row: unprocessed nXIIts activity. Third row: nXIIts activity (from second row) after common-mode subtraction (CMS) and filtering. Bottom row: smoothed nXIIts activity envelope. c Representative nXIIts recordings from the bird are shown in (b) on days 1, 10, 20, and 30 post implant. Gray line shows the smoothed activity envelope for each recording. Dark bars at top indicate the recording alignment to syllables; bars at bottom indicate time, voltage, and signal envelope scale. d Stability of chronic recordings from the bird appearing in (b, c) over 30 days. Left-top: song-aligned nXIIts activity envelopes for motifs produced on days 1, 10, 20, and 30 post implant. Left-bottom: mean song-aligned activity envelope (over ten trials) recorded on days 1, 10, 20, and 30 post implant. Line colors indicate recording day. Middle left: running correlation between the song-aligned nXIIts activity envelope and the mean day 1 activity envelope. Middle: running peak-to-peak voltage during singing. Middle right: running SNR of recordings during singing. Far-right: Running estimated event rates during singing. e Summary data of chronic recordings over 30 days in n = 3 birds; symbols identify individual birds. Top: mean daily trial-by-trial Pearson’s correlation to the average activity pattern on the 1st day of singing. Middle-top: mean daily peak-to-peak voltage. Middle-bottom: mean daily SNR of nXIIts recordings. Bottom: mean daily event rates. Source data are provided as a Source Data File.
Fig. 4 Long-term stable recordings with minimal degradation over more than 4 weeks. a Schema for chronic recording of nXIIts activity in the singing bird. A nanoclip was implanted on the right-side nXIIts; song-triggered acquisition software captured both vocalization and concurrent nXIIts activity. Example song motif spectrogram from bird shown in (b–d); black bars above the spectrogram indicate the beginning and end of each syllable in the motif (“A,” “B,” and “C”). b Representative example of chronic nXIIts recording aligned to song. Top row: spectrogram of bird’s song containing three song bouts, each with two repeated motifs. Black bars above the spectrogram indicate song syllable boundaries; gray bands denote song motifs. Red band identifies movement-related noise and associated motion artifact in the electrophysiology recording. Second row: unprocessed nXIIts activity. Third row: nXIIts activity (from second row) after common-mode subtraction (CMS) and filtering. Bottom row: smoothed nXIIts activity envelope. c Representative nXIIts recordings from the bird are shown in (b) on days 1, 10, 20, and 30 post implant. Gray line shows the smoothed activity envelope for each recording. Dark bars at top indicate the recording alignment to syllables; bars at bottom indicate time, voltage, and signal envelope scale. d Stability of chronic recordings from the bird appearing in (b, c) over 30 days. Left-top: song-aligned nXIIts activity envelopes for motifs produced on days 1, 10, 20, and 30 post implant. Left-bottom: mean song-aligned activity envelope (over ten trials) recorded on days 1, 10, 20, and 30 post implant. Line colors indicate recording day. Middle left: running correlation between the song-aligned nXIIts activity envelope and the mean day 1 activity envelope. Middle: running peak-to-peak voltage during singing. Middle right: running SNR of recordings during singing. Far-right: Running estimated event rates during singing. e Summary data of chronic recordings over 30 days in n = 3 birds; symbols identify individual birds. Top: mean daily trial-by-trial Pearson’s correlation to the average activity pattern on the 1st day of singing. Middle-top: mean daily peak-to-peak voltage. Middle-bottom: mean daily SNR of nXIIts recordings. Bottom: mean daily event rates. Source data are provided as a Source Data File.CC BY · PubMed Central
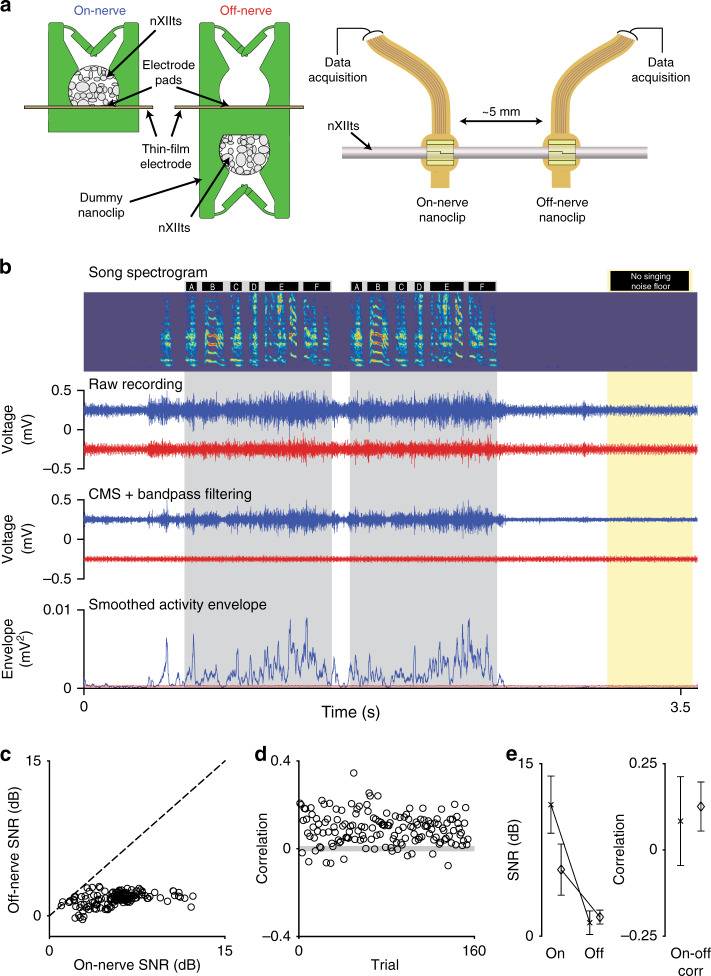
Fig. 5 Experiments addressing the neuronal origin of recorded signals. a Schema for simultaneous two-nanoclip chronic recordings. (Left) On-nerve recordings were made with the standard nanoclip design (used in all other experiments) in which the implanted nerve rests within the cavity and in contact with the electrode pads. Off-nerve recordings were made using a modified device with a second “dummy” nanoclip on the underside of the interface, keeping the electrode pads out of contact with the nerve and able to capture nonneuronal signals. (Right) nXIIt activity was recorded via an on-nerve nanoclip; control recordings were made via an off-nerve nanoclip interface placed ~5 mm caudally. b Representative example of simultaneous on-nerve and off-nerve chronic recordings. Top row: spectrogram of bird’s song containing two repeated song motifs. Black bars above the spectrogram indicate syllable boundaries; gray bands denote song motifs. Yellow band identifies song and artifact-free section of the recording from which the noise floor was estimated for SNR. Second row: unprocessed signals from on-nerve (blue) and off-nerve (red) interfaces. Third row: on-nerve (blue) and off-nerve (red) signals (from second row) after CMS and filtering. Bottom row: smoothed envelope for on-nerve (blue) and off-nerve (red) signals. c Trial-by-trial comparison of SNR for on-nerve and off-nerve signals for the bird is shown in (b). Each circle represents an individual trial; dashed line indicates unity. d Trial-by-trial Pearson correlations between the on-nerve and off-nerve envelops for the bird are shown in (b). Each circle represents an individual trial; the gray-shaded box indicates the 95% CI for zero-correlation by bootstrap. e Summary of neuronal and nonneuronal chronic recordings from the nXIIts in two birds. (Left) SNR of on- and off-nerve signals. (Right) Correlation of singing-related signal envelopes for on- and off-nerve signals. For each plot, symbols indicate the mean across motifs for each animal; error bars indicate Std (n = 154 and 56 motifs, respectively). Source data are provided as a Source Data File.
Fig. 5 Experiments addressing the neuronal origin of recorded signals. a Schema for simultaneous two-nanoclip chronic recordings. (Left) On-nerve recordings were made with the standard nanoclip design (used in all other experiments) in which the implanted nerve rests within the cavity and in contact with the electrode pads. Off-nerve recordings were made using a modified device with a second “dummy” nanoclip on the underside of the interface, keeping the electrode pads out of contact with the nerve and able to capture nonneuronal signals. (Right) nXIIt activity was recorded via an on-nerve nanoclip; control recordings were made via an off-nerve nanoclip interface placed ~5 mm caudally. b Representative example of simultaneous on-nerve and off-nerve chronic recordings. Top row: spectrogram of bird’s song containing two repeated song motifs. Black bars above the spectrogram indicate syllable boundaries; gray bands denote song motifs. Yellow band identifies song and artifact-free section of the recording from which the noise floor was estimated for SNR. Second row: unprocessed signals from on-nerve (blue) and off-nerve (red) interfaces. Third row: on-nerve (blue) and off-nerve (red) signals (from second row) after CMS and filtering. Bottom row: smoothed envelope for on-nerve (blue) and off-nerve (red) signals. c Trial-by-trial comparison of SNR for on-nerve and off-nerve signals for the bird is shown in (b). Each circle represents an individual trial; dashed line indicates unity. d Trial-by-trial Pearson correlations between the on-nerve and off-nerve envelops for the bird are shown in (b). Each circle represents an individual trial; the gray-shaded box indicates the 95% CI for zero-correlation by bootstrap. e Summary of neuronal and nonneuronal chronic recordings from the nXIIts in two birds. (Left) SNR of on- and off-nerve signals. (Right) Correlation of singing-related signal envelopes for on- and off-nerve signals. For each plot, symbols indicate the mean across motifs for each animal; error bars indicate Std (n = 154 and 56 motifs, respectively). Source data are provided as a Source Data File.CC BY · PubMed Central
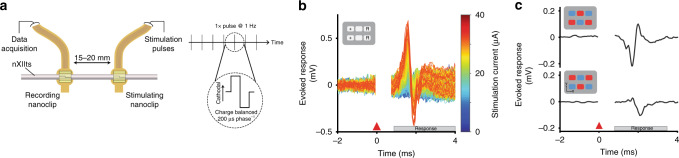
Fig. 6 Nanoclip-anchored thin-film arrays enable low-threshold bulk and multichannel nerve stimulation. a Schema for acute stimulation of evoked compound action potentials. (Left) Current-controlled stimulation was delivered via a rostral nanoclip interface; evoked responses were recorded by a second nanoclip interface placed 15–20 mm caudally on the same nerve. (Right) Biphasic, cathodal-leading stimulating pulses, 200 μs phase−1 at 5–40 μA, were delivered at 1 Hz. b Example of graded evoked response to increasing stimulation intensities. Stimulation applied at t = 0 ms; stimulation artifact appears t = 0–0.5 ms; evoked response follows. Inset shows stimulation electrode configuration—“+” denotes source of cathodal first phase; “R” denotes electrodes for the current return path. c Evoked compound responses show that spatially distinct patterns of stimulation can produce a high degree of modulatory specificity. Inset shows the location of electrodes mediating stimulation pulses with cathodal (red) or anodal (blue) leading phases.
Fig. 6 Nanoclip-anchored thin-film arrays enable low-threshold bulk and multichannel nerve stimulation. a Schema for acute stimulation of evoked compound action potentials. (Left) Current-controlled stimulation was delivered via a rostral nanoclip interface; evoked responses were recorded by a second nanoclip interface placed 15–20 mm caudally on the same nerve. (Right) Biphasic, cathodal-leading stimulating pulses, 200 μs phase−1 at 5–40 μA, were delivered at 1 Hz. b Example of graded evoked response to increasing stimulation intensities. Stimulation applied at t = 0 ms; stimulation artifact appears t = 0–0.5 ms; evoked response follows. Inset shows stimulation electrode configuration—“+” denotes source of cathodal first phase; “R” denotes electrodes for the current return path. c Evoked compound responses show that spatially distinct patterns of stimulation can produce a high degree of modulatory specificity. Inset shows the location of electrodes mediating stimulation pulses with cathodal (red) or anodal (blue) leading phases.CC BY · PubMed Central
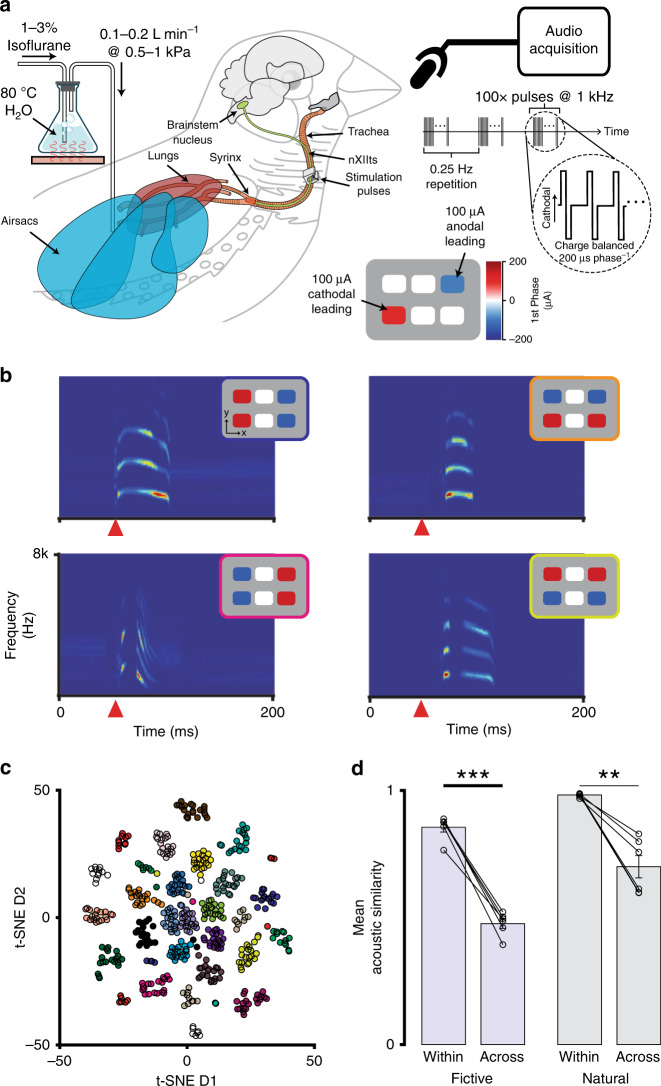
Fig. 7 Multichannel stimulation in a small volume can achieve functional modulatory specificity. a In vivo experimental setup for current-steering-evoked fictive singing. The nanoclip was implanted on the right-side nXIIts of an anesthetized adult male zebra finch, and an air cannula was placed in the abdominal air sac (see “Methods”). The respiratory system was pressurized by flowing warmed and humidified (35 C; 80%) isoflurane dissolved in oxygen through the cannula (0.1–0.2 L min−1 at 0.5–1.5 kPa). Multichannel stimulation (100 biphasic current pulses at 1 kHz, 200 μs phase−1) with unique spatial patterns was applied to the nXIIts with the nanoclip interface, eliciting audible vocalizations that were recorded via a microphone. b Representative examples of current-steering-elicited fictive vocalizations. For each pairing, the inset (upper right of each spectrogram) identifies the stimulation pattern that produced the vocalization shown in the spectrogram. Each spectrogram depicts the vocalization from a single trial; the orange triangle marks the onset of stimulation. c Two-dimensional t-SNE embedding of high-dimensional representations of fictively produced vocalizations (i.e., spectrograms) from one experiment testing 24 distinct current-steering stimulation patterns. Data points correspond to individual stimulation trials; colors denote current-steering patterns (see Supplementary Fig. 7 for pattern definitions). d (Left) Mean acoustic similarity between fictive vocalizations within and across multichannel stimulation patterns for n = 6 birds. (Right) Mean acoustic similarity between natural vocalizations within and across song syllable types for n = 6 birds. In each, data points show mean across vocalizations within a bird. Bars show mean across all birds in each experiment; error bars indicate sem. Two-tailed, paired t-test, within: P = 3.5 × 10⁻⁵; across: P = 0.0016. **P < 0.01; ***P < 0.001 Source data are provided as a Source Data File.
Fig. 7 Multichannel stimulation in a small volume can achieve functional modulatory specificity. a In vivo experimental setup for current-steering-evoked fictive singing. The nanoclip was implanted on the right-side nXIIts of an anesthetized adult male zebra finch, and an air cannula was placed in the abdominal air sac (see “Methods”). The respiratory system was pressurized by flowing warmed and humidified (35 C; 80%) isoflurane dissolved in oxygen through the cannula (0.1–0.2 L min−1 at 0.5–1.5 kPa). Multichannel stimulation (100 biphasic current pulses at 1 kHz, 200 μs phase−1) with unique spatial patterns was applied to the nXIIts with the nanoclip interface, eliciting audible vocalizations that were recorded via a microphone. b Representative examples of current-steering-elicited fictive vocalizations. For each pairing, the inset (upper right of each spectrogram) identifies the stimulation pattern that produced the vocalization shown in the spectrogram. Each spectrogram depicts the vocalization from a single trial; the orange triangle marks the onset of stimulation. c Two-dimensional t-SNE embedding of high-dimensional representations of fictively produced vocalizations (i.e., spectrograms) from one experiment testing 24 distinct current-steering stimulation patterns. Data points correspond to individual stimulation trials; colors denote current-steering patterns (see Supplementary Fig. 7 for pattern definitions). d (Left) Mean acoustic similarity between fictive vocalizations within and across multichannel stimulation patterns for n = 6 birds. (Right) Mean acoustic similarity between natural vocalizations within and across song syllable types for n = 6 birds. In each, data points show mean across vocalizations within a bird. Bars show mean across all birds in each experiment; error bars indicate sem. Two-tailed, paired t-test, within: P = 3.5 × 10⁻⁵; across: P = 0.0016. **P < 0.01; ***P < 0.001 Source data are provided as a Source Data File.CC BY · PubMed Central

Verification

Claims the paper makes

The claims and statistics of this paper haven’t been checked yet.

Free: it reads the open-access text and checks the first 5 claims that cite a source we can check. Create a free account to check every claim.

A few free checks a day · papers already verified open instantly · results are public

Claims other papers make about this one

Each is checked against this paper’s own text: does it say what the citing paper says it does?

Self-check

Percentages, sums and reported differences re-computed from the paper’s own numbers.

The self-check needs the paper’s full text.

Citations

Cites

Show all 126 references

Research works printed but not linked: 1

  1. Grill, W. M. & Mortimer, J. T. Neural and connective tissue response to long-term implantation of multiple contact nerve cuff electrodes. J. Biomed. Mater. Res. 50, 215–226 (2000). · doi:10.1002/(sici)1097-4636(200005)50:2<215::aid-jbm17>3.0.co;2-a

Cited by

See all 39

Metadata

Authors
Otchy, T. M., Michas, C., Lee, B., Gopalan, K., Nerurkar, V., Gleick, J., Semu, D., Darkwa, L., Holinski, B. J., Chew, D. J., White, A. E., & Gardner, T. J.
Affiliations
  • Boston University (US)
  • GlaxoSmithKline (United Kingdom) (GB)
Corresponding author
  • Otchy, Timothy M.
  • Gardner, Timothy J.
Venue
Nature Communications
Published
2020-08-21
Volume
11
Issue
1
Pages
4191-4191
ISSN
2041-1723 (ISSN-L)
OpenAlex
W3080522122
Cited by
35
References
126
Citations by year
2026: 1 · 2025: 8 · 2024: 4 · 2023: 6 · 2022: 5 · 2021: 9 · 2020: 2
FWCI
2.52
Type
journal article
Language
en
Open access
Licence
Locations
  • Nature Communications (publishedVersion, cc-by)
  • bioRxiv (Cold Spring Harbor Laboratory) (acceptedVersion, cc-by)
  • PubMed Central (publishedVersion, cc-by)
  • PubMed (publishedVersion)
  • RePEc: Research Papers in Economics (submittedVersion)
  • DOAJ (DOAJ: Directory of Open Access Journals) (submittedVersion, cc-by-sa)
  • OpenBU (Boston University) (submittedVersion, cc-by)
Funders
  • GlaxoSmithKline (NA)
  • U.S. Department of Health & Human Services | NIH | National Institute of Neurological Disorders and Stroke (R01NS089679, R01NS104925)
Topics
  • Life Sciences › Neuroscience › Cellular and Molecular Neuroscience › Neuroscience and Neural Engineering
  • Life Sciences › Neuroscience › Neurology › Vagus Nerve Stimulation Research
  • Physical Sciences › Engineering › Electrical and Electronic Engineering › Analog and Mixed-Signal Circuit Design
Keywords
bioelectronic medicine, peripheral nerve recording, multichannel stimulation, long-term neural recording, small animal models, peripheral nervous system, microfabrication
MeSH terms
Animals, Biomedical Engineering, Electrodes, Implanted, Evoked Potentials, Male, Microelectrodes, Peripheral Nerves, Models, Animal, Finches, Microtechnology, Signal-To-Noise Ratio, Printing, Three-Dimensional

About these checks

Registry, retraction, Cites and statistics results are computed, not judged, with one exception: a printed reference that no index lists is read once by a model before it counts as a citation error. Claims are extracted by a model and kept only when their quote appears verbatim in the text; each cited source is then checked, with a model’s help, for whether it says what the claim relies on. Those verdicts can be wrong — read the claim’s quote and the cited source before relying on one.

Statistics and arithmetic are recomputed, not judged.

Confidence bands are shown only for fields calibrated on our annotated test set. None is calibrated yet, so no band is shown.

What counts as a claim ›How we measure confidence ›How we check this ›

Are you an author, or do you see a problem with this page? Request a review

How to cite

Cite CoChat for the checks on this page, and the paper for its own findings.

This page
CoChat. (2026). Citation check: Printable microscale interfaces for long-term peripheral nerve mapping and precision control. https://app.cochat.ai/papers/10.1038/s41467-020-18032-4
The paper
Otchy, T. M., Michas, C., Lee, B., Gopalan, K., Nerurkar, V., Gleick, J., Semu, D., Darkwa, L., Holinski, B. J., Chew, D. J., White, A. E., & Gardner, T. J. (2020). Printable microscale interfaces for long-term peripheral nerve mapping and precision control. Nature Communications. https://doi.org/10.1038/s41467-020-18032-4

Data sources

Bibliographic data: Semantic Scholar, OpenAlex, Crossref.

Contains information from the Semantic Scholar Academic Graph Datasets, made available under the ODC Attribution License (ODC-BY 1.0).

Semantic Scholar’s data is described in: Kinney, R., et al. (2023). The Semantic Scholar Open Data Platform. arXiv:2301.10140.