

Net decrease in spine-surface GluA1-containing AMPA receptors after post-learning sleep in the adult mouse cortex
Open accessThe DOI matches its Crossref record; 70 of the 70 references it cites were found in a registry or an index.
Abstract
The mechanisms by which sleep benefits learning and memory remain unclear. Sleep may further strengthen the synapses potentiated by learning or promote broad synaptic weakening while protecting the newly potentiated synapses. We tested these ideas by combining a motor task whose consolidation is sleep-dependent, a marker of synaptic AMPA receptor plasticity, and repeated two-photon imaging to track hundreds of spines in vivo with single spine resolution. In mouse motor cortex, sleep leads to an overall net decrease in spine-surface GluA1-containing AMPA receptors, both before and after learning. Molecular changes in single spines during post-learning sleep are correlated with changes in performance after sleep. The spines in which learning leads to the largest increase in GluA1 expression have a relative advantage after post-learning sleep compared to sleep deprivation, because sleep weakens all remaining spines. These results are obtained in adult mice, showing that sleep-dependent synaptic down-selection also benefits the mature brain.
Overview
The claims and statistics of this paper haven’t been checked yet.
Free: it reads the open-access text and checks the first 5 claims that cite a source we can check. Create a free account to check every claim.
Integrity signals
Registry
Cites
Statistics
Figures
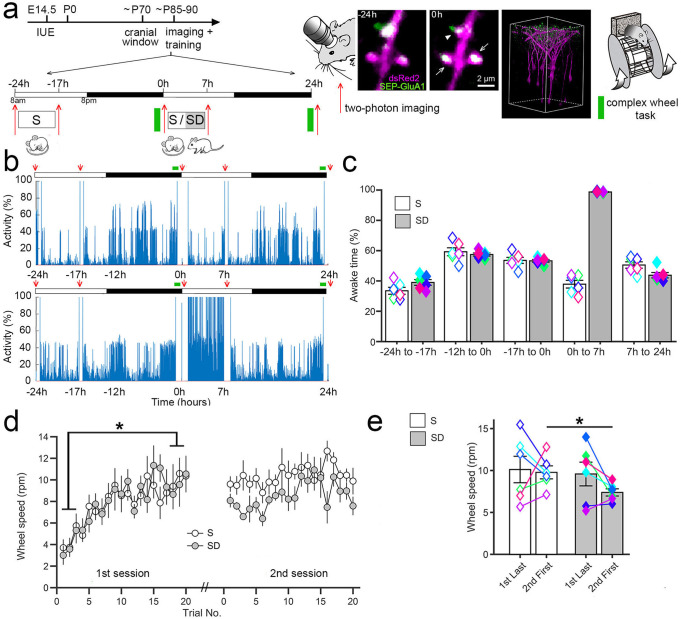
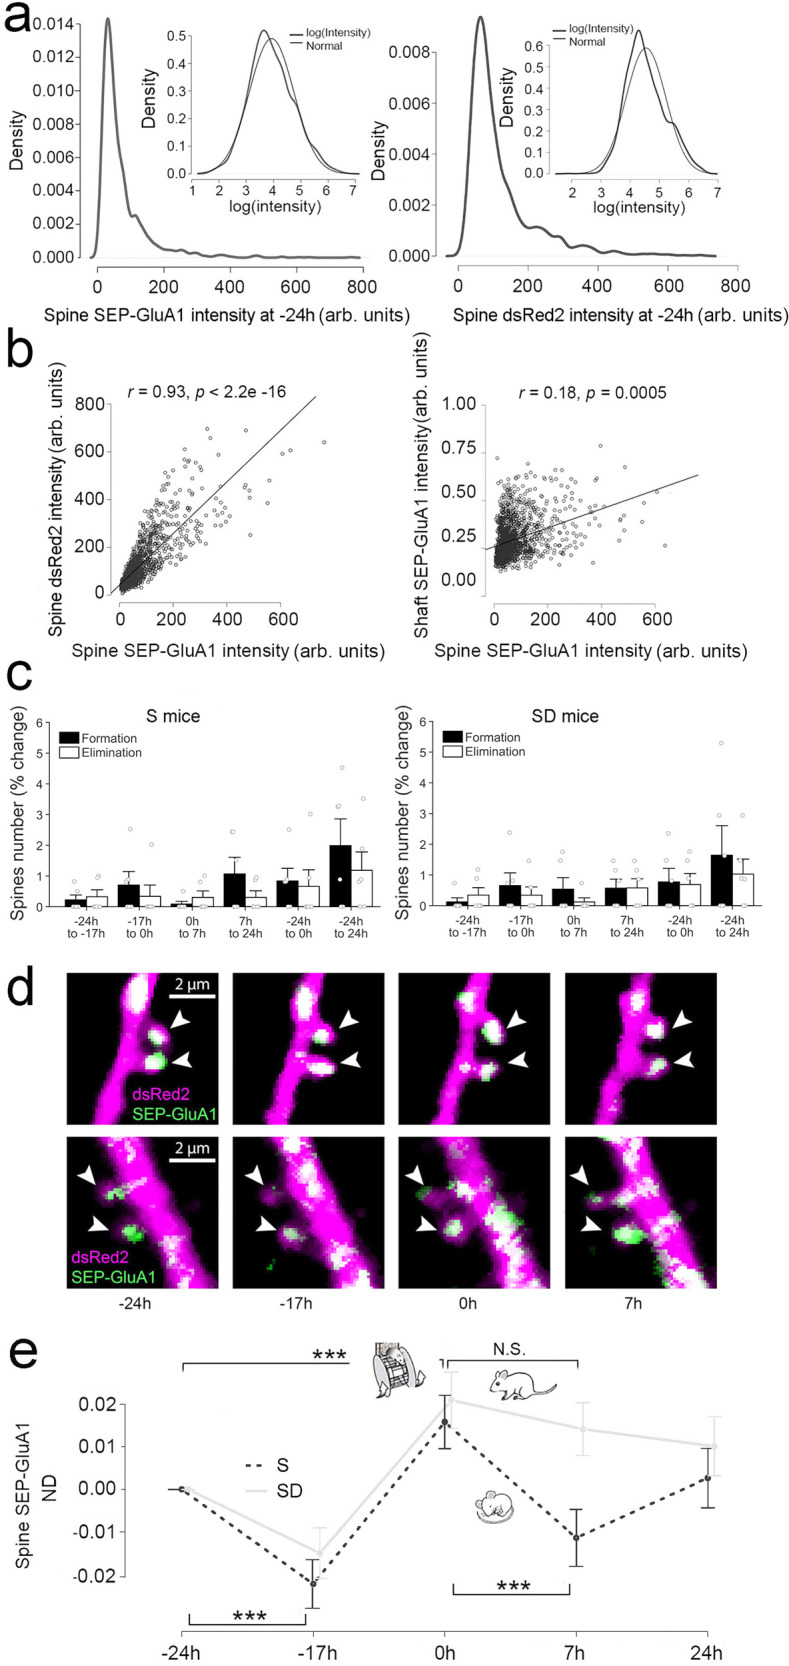
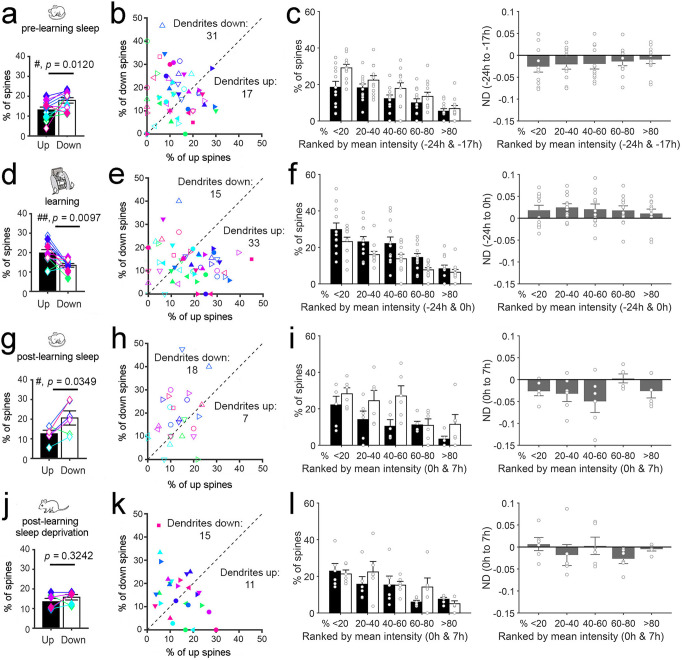
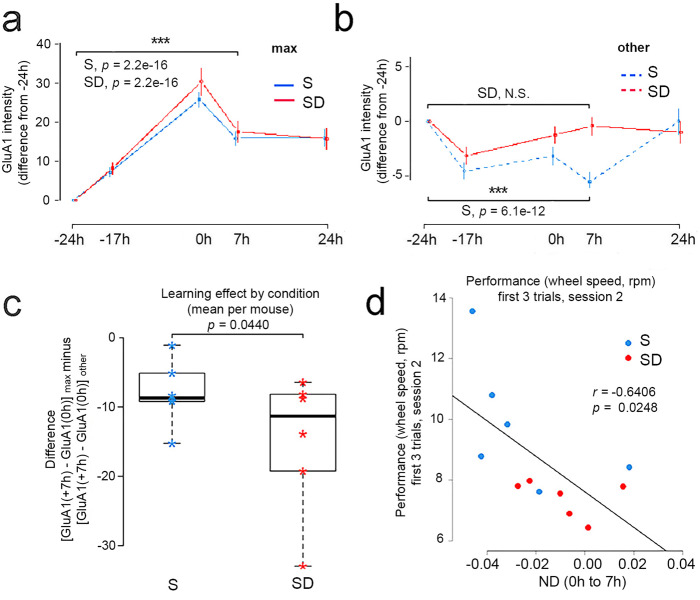
Verification
Claims the paper makes
The claims and statistics of this paper haven’t been checked yet.
Free: it reads the open-access text and checks the first 5 claims that cite a source we can check. Create a free account to check every claim.
Claims other papers make about this one
Each is checked against this paper’s own text: does it say what the citing paper says it does?
The source backs part of the claim, not all of it — or backs it for a different population, condition or comparison.
In the citing paper
“Spine-surface expression of GluA1 as well as average spine size, but not spine density, increased after training, and this increase was globally reduced during subsequent sleep, but not when the animals remained awake in the post-training interval.”
From Sleep—A brain-state serving systems memory consolidation (2023) · cites this paper as [165]
Experimental — accuracy not yet measuredThe source backs part of the claim, not all of it — or backs it for a different population, condition or comparison.
In the citing paper
“Interestingly, beyond evidencing the co-occurrence of differential synaptic scaling during sleep at global and local levels, the findings overall point to a compartmentalized response in this regulation.”
From Sleep—A brain-state serving systems memory consolidation (2023) · cites this paper as [165]
Experimental — accuracy not yet measuredThe source backs part of the claim, not all of it — or backs it for a different population, condition or comparison.
In the citing paper
“(D)Synaptic AMPA receptor density increases during learning and is globally reduced during subsequent sleep.”
From Sleep—A brain-state serving systems memory consolidation (2023) · cites this paper as [165]
Experimental — accuracy not yet measuredThe source backs part of the claim, not all of it — or backs it for a different population, condition or comparison.
In the citing paper
“Downscaling includes the synapses that were upscaled during learning, although to a lesser extent.165”
From Sleep—A brain-state serving systems memory consolidation (2023) · cites this paper as [165]
Experimental — accuracy not yet measuredThe cited source says what the claim attributes to it.
In the citing paper
“Importantly, this comparison revealed that the max spines-although also undergoing some downscaling-kept a relatively higher GLuA1 expression after sleep than after a post-training period of wakefulness.”
From Sleep—A brain-state serving systems memory consolidation (2023) · cites this paper as [165]
1 more claim about this paper
Create a free account to see every claim other papers make about this one.
Self-check
Percentages, sums and reported differences re-computed from the paper’s own numbers.
The self-check needs the paper’s full text.
Citations
Cites
Fitting Linear Mixed-Effects Models Using lme4
Bates, D., Mächler, M., Bolker, B., & Walker, S. (2015) · Journal of Statistical Software · doi:10.18637/jss.v067.i01 · Cited by 86,835
Fiji: an open-source platform for biological-image analysis
Schindelin, J., Arganda-Carreras, I., Frise, E., Kaynig, V., Longair, M., Pietzsch, T., Preibisch, S., Rueden, C., Saalfeld, S., Schmid, B., et al. (2012) · Nature Methods · doi:10.1038/nmeth.2019 · Cited by 66,890
Random-Effects Models for Longitudinal Data
Laird, N. M., & Ware, J. H. (1982) · Biometrics · doi:10.2307/2529876 · Cited by 8,923
Rasch, B., & Born, J. (2013) · Physiological Reviews · doi:10.1152/physrev.00032.2012 · Cited by 2,783
Visualizing secretion and synaptic transmission with pH-sensitive green fluorescent proteins
Miesenböck, G., De Angelis, D. A., & Rothman, J. E. (1998) · Nature · doi:10.1038/28190 · Cited by 2,563
Tononi, G., & Cirelli, C. (2014) · Neuron · doi:10.1016/j.neuron.2013.12.025 · Cited by 2,356
Self-citationNeurocognitive consequences of sleep deprivation
Goel, N., Rao, H., Durmer, J., & Dinges, D. (2009) · Seminars in Neurology · doi:10.1055/s-0029-1237117 · Cited by 2,154
Sleep function and synaptic homeostasis
Tononi, G., & Cirelli, C. (2006) · Sleep Medicine Reviews · doi:10.1016/j.smrv.2005.05.002 · Cited by 2,151
Self-citationExperience-dependent structural synaptic plasticity in the mammalian brain
Holtmaat, A., & Svoboda, K. (2009) · Nature Reviews Neuroscience · doi:10.1038/nrn2699 · Cited by 1,934
Bretz, F., Hothorn, T., & Westfall, P. (2016) · doi:10.1201/9781420010909 · Cited by 1,233
Cited by
Sleep—A brain-state serving systems memory consolidation
Brodt, S., Inostroza, M., Niethard, N., & Born, J. (2023) · Neuron · doi:10.1016/j.neuron.2023.03.005 · Cited by 343
Neural consequences of chronic sleep disruption
Zamore, Z. H., & Veasey, S. C. (2022) · Trends in Neurosciences · doi:10.1016/j.tins.2022.05.007 · Cited by 117
Salehinejad, M. A., Ghanavati, E., Reinders, J., Hengstler, J. G., Kuo, M.-F., & Nitsche, M. A. (2022) · eLife · doi:10.7554/elife.69308 · Cited by 94
“Sleep, on the other hand, desaturates synapses that have been potentiated during wakefulness in mice (Vyazovskiy et al., 2008; Miyamoto et al., 2021) resulting in a renewed capacity for encoding new information.”
BackgroundVisualizing synaptic plasticity in vivo by large-scale imaging of endogenous AMPA receptors
Graves, A. R., Roth, R. H., Tan, H. L., Zhu, Q., Bygrave, A. M., Lopez-Ortega, E., Hong, I., Spiegel, A. C., Johnson, R. C., Vogelstein, J. T., et al. (2021) · eLife · doi:10.7554/elife.66809 · Cited by 84
Cortico-basal ganglia plasticity in motor learning
Roth, R. H., & Ding, J. (2024) · Neuron · doi:10.1016/j.neuron.2024.06.014 · Cited by 85
“…motor cortex no 50 Yang et al., 51 Hayashi-Takagi et al., 52 and Yang et al. 53 Complex wheel freely moving McKenzie et al. 54 and Miyamoto et al. 55 Split treadmill freely moving Darmohray et al. 56 Head-fixed locomotion head-fixed Yang et al., 53 Adler et al., 57 Cichon and Gan, 58 and Ma et al.…”
Metadata
- Authors
- Miyamoto, D., Marshall, W., Tononi, G., & Cirelli, C.
- Affiliations
- University of Wisconsin–Madison (US)
- Corresponding author
- Tononi, Giulio
- Cirelli, Chiara
- Venue
- Nature Communications
- Published
- 2021-05-17
- Volume
- 12
- Issue
- 1
- Pages
- 2881-2881
- ISSN
- 2041-1723 (ISSN-L)
- PMC
- PMC8129120
- OpenAlex
- W3162277611
- Cited by
- 60
- References
- 70
- Citations by year
- 2026: 5 · 2025: 14 · 2024: 17 · 2023: 8 · 2022: 12 · 2021: 4
- FWCI
- 5.39
- Type
- journal article
- Language
- en
- Open access
- gold
- doi.org
- Licence
- cc-by
- creativecommons.org/licenses/by/4.0 (tdm)
- creativecommons.org/licenses/by/4.0 (vor)
- Locations
- Nature Communications (publishedVersion, cc-by)
- PubMed Central (publishedVersion, cc-by)
- PubMed (publishedVersion)
- RePEc: Research Papers in Economics (submittedVersion)
- DOAJ (DOAJ: Directory of Open Access Journals) (submittedVersion, cc-by-sa)
- Funders
- U.S. Department of Health & Human Services | NIH | National Institute of Mental Health (1R01MH091326, 1R01MH099231)
- U.S. Department of Health & Human Services | NIH | NIH Office of the Director (DP 1OD579)
- U.S. Department of Health & Human Services | NIH | National Institute of Neurological Disorders and Stroke (1P01NS083514)
- U.S. Department of Defense (W911NF1910280)
- Human Frontier Science Program (LT000009/2017)
- Japan-US Brain Research Cooperation Program grant (DM).
- Topics
- Life Sciences › Neuroscience › Cognitive Neuroscience › Sleep and Wakefulness Research
- Life Sciences › Neuroscience › Cellular and Molecular Neuroscience › Neuroscience and Neuropharmacology Research
- Life Sciences › Neuroscience › Cognitive Neuroscience › Memory and Neural Mechanisms
- Keywords
- dendritic spines, sleep deprivation, motor learning, memory consolidation, motor cortex
- MeSH terms
- Animals, Female, Learning, Male, Memory, Mice, Inbred C57BL, Models, Neurological, Motor Activity, Motor Cortex, Sleep, Sleep Deprivation, Synapses, Receptors, AMPA, Dendritic Spines, Mice
About these checks
Registry, retraction, Cites and statistics results are computed, not judged, with one exception: a printed reference that no index lists is read once by a model before it counts as a citation error. Claims are extracted by a model and kept only when their quote appears verbatim in the text; each cited source is then checked, with a model’s help, for whether it says what the claim relies on. Those verdicts can be wrong — read the claim’s quote and the cited source before relying on one.
Statistics and arithmetic are recomputed, not judged.
Confidence bands are shown only for fields calibrated on our annotated test set. None is calibrated yet, so no band is shown.
What counts as a claim ›How we measure confidence ›How we check this ›
Are you an author, or do you see a problem with this page? Request a review
How to cite
Cite CoChat for the checks on this page, and the paper for its own findings.
- This page
- CoChat. (2026). Citation check: Net decrease in spine-surface GluA1-containing AMPA receptors after post-learning sleep in the adult mouse cortex. https://app.cochat.ai/papers/10.1038/s41467-021-23156-2
- The paper
- Miyamoto, D., Marshall, W., Tononi, G., & Cirelli, C. (2021). Net decrease in spine-surface GluA1-containing AMPA receptors after post-learning sleep in the adult mouse cortex. Nature Communications. https://doi.org/10.1038/s41467-021-23156-2
Data sources
Bibliographic data: Semantic Scholar, OpenAlex, Crossref.
Contains information from the Semantic Scholar Academic Graph Datasets, made available under the ODC Attribution License (ODC-BY 1.0).
Semantic Scholar’s data is described in: Kinney, R., et al. (2023). The Semantic Scholar Open Data Platform. arXiv:2301.10140.
