

The DOI matches its Crossref record; 82 of the 82 references it cites were found in a registry or an index.
Multimodal analysis of cell-free DNA whole-genome sequencing for pediatric cancers with low mutational burden
Open accessAbstract
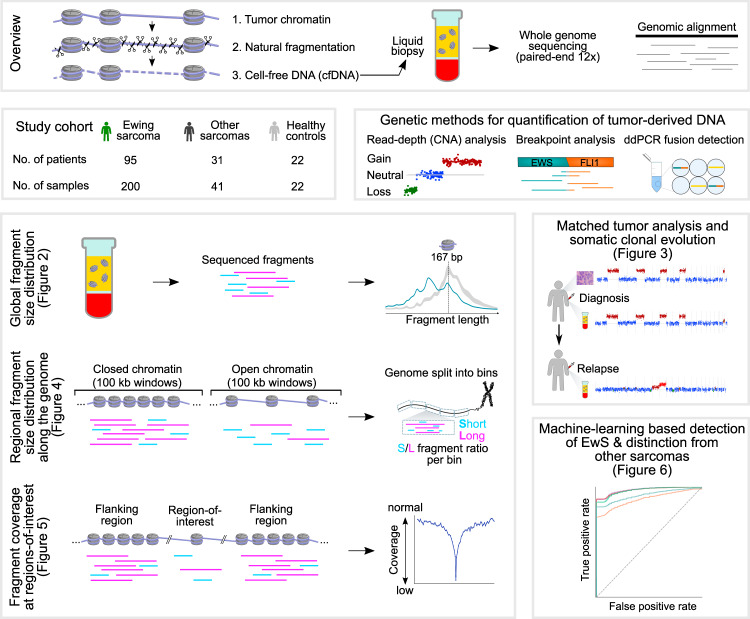
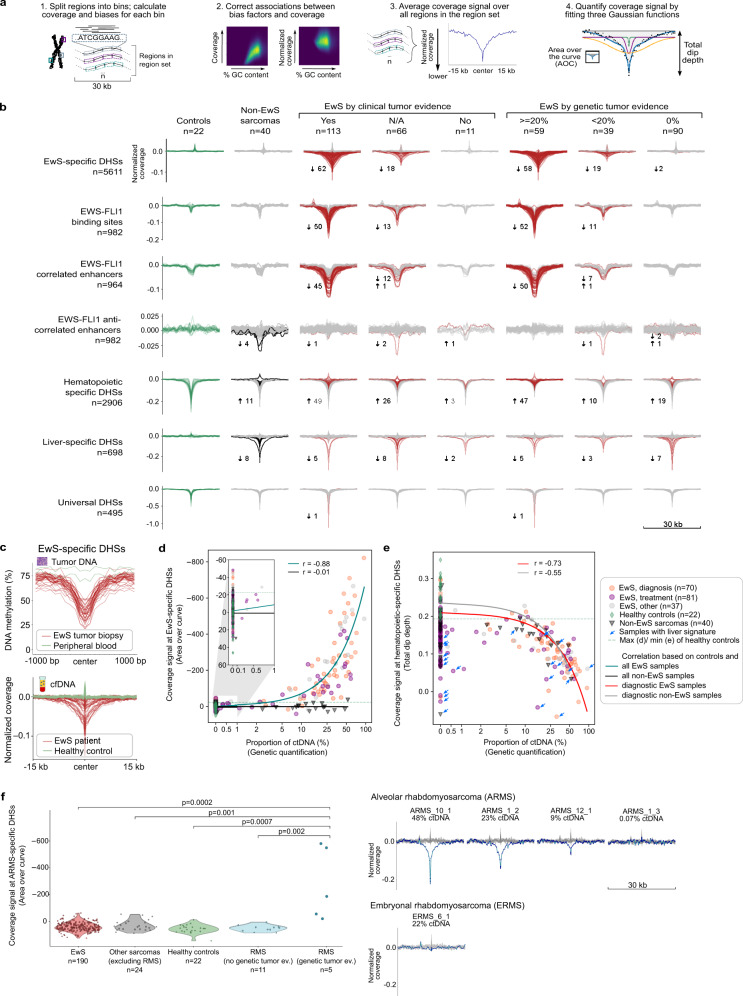
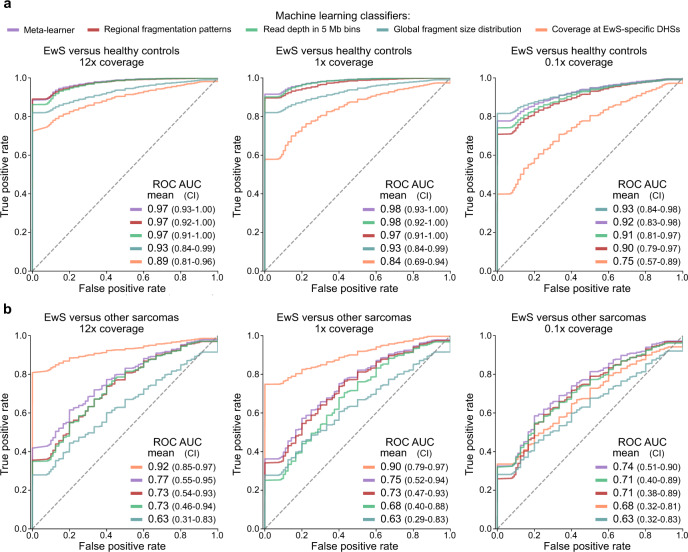
Sequencing of cell-free DNA in the blood of cancer patients (liquid biopsy) provides attractive opportunities for early diagnosis, assessment of treatment response, and minimally invasive disease monitoring. To unlock liquid biopsy analysis for pediatric tumors with few genetic aberrations, we introduce an integrated genetic/epigenetic analysis method and demonstrate its utility on 241 deep whole-genome sequencing profiles of 95 patients with Ewing sarcoma and 31 patients with other pediatric sarcomas. Our method achieves sensitive detection and classification of circulating tumor DNA in peripheral blood independent of any genetic alterations. Moreover, we benchmark different metrics for cell-free DNA fragmentation analysis, and we introduce the LIQUORICE algorithm for detecting circulating tumor DNA based on cancer-specific chromatin signatures. Finally, we combine several fragmentation-based metrics into an integrated machine learning classifier for liquid biopsy analysis that exploits widespread epigenetic deregulation and is tailored to cancers with low mutation rates. Clinical associations highlight the potential value of cfDNA fragmentation patterns as prognostic biomarkers in Ewing sarcoma. In summary, our study provides a comprehensive analysis of circulating tumor DNA beyond recurrent genetic aberrations, and it renders the benefits of liquid biopsy more readily accessible for childhood cancers.
Overview
The claims and statistics of this paper haven’t been checked yet.
Run the check — free, no account needed. It reads the open-access text and checks the sources it cites.
Integrity signals
Registry
Cites
Statistics
Figures
Verification
Claims the paper makes
The claims and statistics of this paper haven’t been checked yet.
Run the check — free, no account needed. It reads the open-access text and checks the sources it cites.
Claims other papers make about this one
Each is checked against this paper’s own text: does it say what the citing paper says it does?
The source backs part of the claim, not all of it — or backs it for a different population, condition or comparison.
In the citing paper
“Nevertheless, the application of WGS in longitudinal MRD detection remains challenging due to its relatively high sequencing cost and lower sensitivity, compared to NGS-based ctDNA panel detection.”
From Tumor-informed deep sequencing of ctDNA detects minimal residual disease and predicts relapse in osteosarcoma (2024) · cites this paper as [17]
Experimental — accuracy not yet measured
Self-check
Percentages, sums and reported differences re-computed from the paper’s own numbers.
The self-check needs the paper’s full text.
Citations
Cites
Scikit-learn: Machine Learning in Python
Pedregosa, F., Varoquaux, G., Gramfort, A., Michel, V., Thirion, B., Grisel, O., Blondel, M., Müller, A., Nothman, J., Louppe, G., et al. (2012) · arXiv · doi:10.48550/arxiv.1201.0490 · Cited by 71,016
fastp: an ultra-fast all-in-one FASTQ preprocessor
Chen, S., Zhou, Y., Chen, Y., & Gu, J. (2018) · Bioinformatics · doi:10.1093/bioinformatics/bty560 · Cited by 29,721
Robinson, J. T., Thorvaldsdóttir, H., Winckler, W., Guttman, M., Lander, E. S., Getz, G., & Mesirov, J. P. (2011) · Nature Biotechnology · doi:10.1038/nbt.1754 · Cited by 15,390
A method for the solution of certain non-linear problems in least squares
Levenberg, K. (1944) · Quarterly of Applied Mathematics · doi:10.1090/qam/10666 · Cited by 12,753
<tt>BLAT</tt> —The <tt>BLAST</tt> -Like Alignment Tool
Kent, W. J. (2002) · Genome Research · doi:10.1101/gr.229202 · Cited by 8,480
deepTools2: a next generation web server for deep-sequencing data analysis
Ramírez, F., Ryan, D. P., Grüning, B., Bhardwaj, V., Kilpert, F., Richter, A. S., Heyne, S., Dündar, F., & Manke, T. (2016) · Nucleic Acids Research · doi:10.1093/nar/gkw257 · Cited by 8,096
Detection of Circulating Tumor DNA in Early- and Late-Stage Human Malignancies
Bettegowda, C., Sausen, M., Leary, R. J., Kinde, I., Wang, Y., Agrawal, N., Bartlett, B. R., Wang, H., Luber, B., Alani, R. M., et al. (2014) · Science Translational Medicine · doi:10.1126/scitranslmed.3007094 · Cited by 5,067
Liquid biopsies come of age: Towards implementation of circulating tumour DNA
Wan, J. C. M., Massie, C., Garcia-Corbacho, J., Mouliere, F., Brenton, J. D., Caldas, C., Pacey, S., Baird, R., & Rosenfeld, N. (2017) · Nature Reviews Cancer · doi:10.1038/nrc.2017.7 · Cited by 2,809
Detection and localization of surgically resectable cancers with a multi-analyte blood test
Cohen, J. D., Li, L., Wang, Y., Thoburn, C., Afsari, B., Danilova, L., Douville, C., Javed, A. A., Wong, F., Mattox, A., et al. (2018) · Science · doi:10.1126/science.aar3247 · Cited by 2,783
Analysis of Circulating Tumor DNA to Monitor Metastatic Breast Cancer
Dawson, S.-J., Tsui, D. W. Y., Murtaza, M., Biggs, H., Rueda, O. M., Chin, S.-F., Dunning, M. J., Gale, D., Forshew, T., Mahler-Araujo, B., et al. (2013) · New England Journal of Medicine · doi:10.1056/nejmoa1213261 · Cited by 2,207
Integrating liquid biopsies into the management of cancer
Siravegna, G., Marsoni, S., Siena, S., & Bardelli, A. (2017) · Nature Reviews Clinical Oncology · doi:10.1038/nrclinonc.2017.14 · Cited by 1,985
Phylogenetic ctDNA analysis depicts early-stage lung cancer evolution
Abbosh, C., Birkbak, N. J., Wilson, G. A., Jamal‐Hanjani, M., Constantin, T. P., Salari, R., Quesne, J. P. C. L., Moore, D. A., Veeriah, S., Rosenthal, R., et al. (2017) · Nature · doi:10.1038/nature22364 · Cited by 1,900
The ENCODE Blacklist: Identification of Problematic Regions of the Genome
Amemiya, H. M., Kundaje, A., & Boyle, A. P. (2019) · Scientific Reports · doi:10.1038/s41598-019-45839-z · Cited by 1,831
The landscape of genomic alterations across childhood cancers
ICGC PedBrain-Seq Project, Gröbner, S. N., ICGC MMML-Seq Project, Worst, B. C., Weischenfeldt, J., Buchhalter, I., Kleinheinz, K., Rudneva, V. A., Johann, P. D., Balasubramanian, G. P., et al. (2018) · Nature · doi:10.1038/nature25480 · Cited by 1,572
Self-citationCurrent and future perspectives of liquid biopsies in genomics-driven oncology
Heitzer, E., Haque, I. S., Roberts, C. E. S., & Speicher, M. R. (2019) · Nature Reviews Genetics · doi:10.1038/s41576-018-0071-5 · Cited by 1,557
Cell-free DNA Comprises an In Vivo Nucleosome Footprint that Informs Its Tissues-Of-Origin
Snyder, M. W., Kircher, M., Hill, A. J., Daza, R. M., & Shendure, J. (2016) · Cell · doi:10.1016/j.cell.2015.11.050 · Cited by 1,492
Genome-wide cell-free DNA fragmentation in patients with cancer
Cristiano, S., Leal, A., Phallen, J., Fiksel, J., Adleff, V., Bruhm, D. C., Jensen, S. Ø., Medina, J. E., Hruban, C., White, J. R., et al. (2019) · Nature · doi:10.1038/s41586-019-1272-6 · Cited by 1,476
Direct detection of early-stage cancers using circulating tumor DNA
Phallen, J. A., Sausen, M., Adleff, V., Leal, A., Hruban, C., White, J. R., Anagnostou, V., Fiksel, J., Cristiano, S., Papp, E., et al. (2017) · Science Translational Medicine · doi:10.1126/scitranslmed.aan2415 · Cited by 1,149
The whole-genome landscape of medulloblastoma subtypes
Northcott, P. A., Buchhalter, I., Morrissy, A. S., Hovestadt, V., Weischenfeldt, J., Ehrenberger, T., Gröbner, S., Segura-Wang, M., Zichner, T., Rudneva, V. A., et al. (2017) · Nature · doi:10.1038/nature22973 · Cited by 1,112
Enhanced detection of circulating tumor DNA by fragment size analysis
Mouliere, F. C., Chandrananda, D., Piskorz, A., Moore, E. K., Morris, J., Ahlborn, L. B., Mair, R. J., Goranova, T., Marass, F., Heider, K., et al. (2018) · Science Translational Medicine · doi:10.1126/scitranslmed.aat4921 · Cited by 1,095
Scalable whole-exome sequencing of cell-free DNA reveals high concordance with metastatic tumors
Adalsteinsson, V. A., Ha, G., Freeman, S. S., Choudhury, A. D., Stover, D. G., Parsons, H. A., Gydush, G., Reed, S. C., Rotem, D., Rhoades, J., et al. (2017) · Nature Communications · doi:10.1038/s41467-017-00965-y · Cited by 1,071
The evolutionary history of 2,658 cancers
Gerstung, M., Jolly, C., Leshchiner, I., Dentro, S. C., Gonzalez, S., Rosebrock, D., Mitchell, T. J., Rubanova, Y., Anur, P., Yu, K., et al. (2020) · Nature · doi:10.1038/s41586-019-1907-7 · Cited by 1,057
Moss, J., Magenheim, J., Neiman, D., Zemmour, H., Loyfer, N., Korach, A., Samet, Y., Maoz, M., Druid, H., Arner, P., et al. (2018) · Nature Communications · doi:10.1038/s41467-018-07466-6 · Cited by 1,004
Application of Cell-free DNA Analysis to Cancer Treatment
Corcoran, R. B., & Chabner, B. A. (2018) · New England Journal of Medicine · doi:10.1056/nejmra1706174 · Cited by 980
Summarizing and correcting the GC content bias in high-throughput sequencing
Benjamini, Y., & Speed, T. P. (2012) · Nucleic Acids Research · doi:10.1093/nar/gks001 · Cited by 913
Pan-cancer genome and transcriptome analyses of 1,699 paediatric leukaemias and solid tumours
Ma, X., Liu, Y., Liu, Y., Alexandrov, L. B., Edmonson, M. N., Gawad, C., Zhou, X., Li, Y., Rusch, M. C., Easton, J., et al. (2018) · Nature · doi:10.1038/nature25795 · Cited by 901
SAMBLASTER : fast duplicate marking and structural variant read extraction
Faust, G. G., & Hall, I. M. (2014) · Bioinformatics · doi:10.1093/bioinformatics/btu314 · Cited by 880
Grünewald, T. G. P., Cidre-Aranaz, F., Surdez, D., Tomazou, E. M., de Álava, E., Kovar, H., Sorensen, P. H., Delattre, O., & Dirksen, U. (2018) · Nature Reviews Disease Primers · doi:10.1038/s41572-018-0003-x · Cited by 873
Self-citationSun, K., Jiang, P., Chan, K. C. A., Wong, J., Cheng, Y. K. Y., Liang, R. H. S., Chan, W., Ma, E. S. K., Chan, S. L., Cheng, S. H., et al. (2015) · Proceedings of the National Academy of Sciences · doi:10.1073/pnas.1508736112 · Cited by 789
Ewing Sarcoma: Current Management and Future Approaches Through Collaboration
Gaspar, N., Hawkins, D. S., Dirksen, U., Lewis, I. J., Ferrari, S., Deley, M. L., Kovar, H., Grimer, R. J., Whelan, J., Claude, L., et al. (2015) · Journal of Clinical Oncology · doi:10.1200/jco.2014.59.5256 · Cited by 757
Self-citationShern, J. F., Chen, L., Chmielecki, J., Wei, J. S., Patidar, R., Rosenberg, M. W., Ambrogio, L., Auclair, D., Wang, J., Song, Y. K., et al. (2014) · Cancer Discovery · doi:10.1158/2159-8290.cd-13-0639 · Cited by 753
Fragment Length of Circulating Tumor DNA
Underhill, H. R., Kitzman, J. O., Hellwig, S., Welker, N. C., Daza, R. M., Baker, D. N., Gligorich, K. M., Rostomily, R., Bronner, M. P., & Shendure, J. (2016) · PLoS Genetics · doi:10.1371/journal.pgen.1006162 · Cited by 675
Circulating tumor DNA and liquid biopsy in oncology
Cescon, D. W., Bratman, S. V., Chan, S. M., & Siu, L. L. (2020) · Nature Cancer · doi:10.1038/s43018-020-0043-5 · Cited by 600
Tirode, F., Surdez, D., Ma, X., Parker, M. D., Deley, M. L., Bahrami, A., Zhang, Z., Lapouble, E., Grossetête, S., Rusch, M., et al. (2014) · Cancer Discovery · doi:10.1158/2159-8290.cd-14-0622 · Cited by 594
Self-citationThe Genomic Landscape of Pediatric Ewing Sarcoma
Crompton, B. D., Stewart, C., Taylor-Weiner, A. N., Alexe, G., Kurek, K. C., Calicchio, M. L., Kieżun, A., Carter, S. L., Shukla, S. A., Mehta, S. S., et al. (2014) · Cancer Discovery · doi:10.1158/2159-8290.cd-13-1037 · Cited by 592
Neuroblastoma is composed of two super-enhancer-associated differentiation states
van Groningen, T., Köster, J., Valentijn, L. J., Zwijnenburg, D. A., Akogul, N., Hasselt, N. E., Broekmans, M. E. C., Haneveld, F., Nowakowska, N. E., Bras, J., et al. (2017) · Nature Genetics · doi:10.1038/ng.3899 · Cited by 556
Parikh, A. R., Leshchiner, I., Elagina, L., Goyal, L., Levovitz, C., Siravegna, G., Livitz, D., Rhrissorrakrai, K., Martin, E. E., Van Seventer, E. E., et al. (2019) · Nature Medicine · doi:10.1038/s41591-019-0561-9 · Cited by 518
Heterogeneity of neuroblastoma cell identity defined by transcriptional circuitries
Boeva, V., Louis‐Brennetot, C., Peltier, A., Durand, S., Pierre‐Eugène, C., Raynal, V., Etchevers, H., Thomas, S., Lermine, A., Daudigeos‐Dubus, E., et al. (2017) · Nature Genetics · doi:10.1038/ng.3921 · Cited by 516
Self-citationFast Computation and Applications of Genome Mappability
Derrien, T., Estellé, J., Marco‐Sola, S., Knowles, D. G., Raineri, E., Guigó, R., & Ribeca, P. (2012) · PLoS ONE · doi:10.1371/journal.pone.0030377 · Cited by 493
Cancer-Specific Retargeting of BAF Complexes by a Prion-like Domain
Boulay, G., Sandoval, G. J., Riggi, N., Iyer, S., Buisson, R., Naigles, B., Awad, M. E., Rengarajan, S., Volorio, A., McBride, M. J., et al. (2017) · Cell · doi:10.1016/j.cell.2017.07.036 · Cited by 487
Riggi, N., Knoechel, B., Gillespie, S. M., Rheinbay, E., Boulay, G., Suvà, M. L., Rossetti, N. E., Boonseng, W. E., Oksuz, O., Cook, E., et al. (2014) · Cancer Cell · doi:10.1016/j.ccell.2014.10.004 · Cited by 466
LOLA: enrichment analysis for genomic region sets and regulatory elements in R and Bioconductor
Sheffield, N. C., & Bock, C. (2015) · Bioinformatics · doi:10.1093/bioinformatics/btv612 · Cited by 456
Self-citationChan, K. C. A., Jiang, P., Chan, C. W. M., Sun, K., Wong, J., Hui, E. P., Chan, S. L., Chan, W. C., Hui, D. S. C., Ng, S. S. M., et al. (2013) · Proceedings of the National Academy of Sciences · doi:10.1073/pnas.1313995110 · Cited by 446
The Genomic Landscape of the Ewing Sarcoma Family of Tumors Reveals Recurrent STAG2 Mutation
Brohl, A. S., Solomon, D. A., Chang, W., Wang, J., Song, Y., Sindiri, S., Patidar, R., Hurd, L., Chen, L., Shern, J. F., et al. (2014) · PLoS Genetics · doi:10.1371/journal.pgen.1004475 · Cited by 440
Inferring expressed genes by whole-genome sequencing of plasma DNA
Ulz, P., Thallinger, G., Auer, M., Graf, R., Kashofer, K., Jahn, S. W., Abete, L., Pristauz, G., Petru, E., Geigl, J. B., et al. (2016) · Nature Genetics · doi:10.1038/ng.3648 · Cited by 438
Genome-wide cell-free DNA mutational integration enables ultra-sensitive cancer monitoring
Zviran, A., Schulman, R. C., Shah, M. J., Hill, S. T., Deochand, S. D., Khamnei, C. C., Maloney, D., Patel, K., Liao, W., Widman, A. J., et al. (2020) · Nature Medicine · doi:10.1038/s41591-020-0915-3 · Cited by 431
van der Pol, Y., & Mouliere, F. C. (2019) · Cancer Cell · doi:10.1016/j.ccell.2019.09.003 · Cited by 333
Index and biological spectrum of human DNase I hypersensitive sites
Meuleman, W., Muratov, A., Rynes, E., Halow, J., Lee, K., Bates, D., Diegel, M., Dunn, D., Neri, F., Teodosiadis, A., et al. (2020) · Nature · doi:10.1038/s41586-020-2559-3 · Cited by 331
PAX3–FOXO1 Establishes Myogenic Super Enhancers and Confers BET Bromodomain Vulnerability
Gryder, B. E., Yohe, M. E., Chou, H.-C., Zhang, X., Marques, J. G., Wachtel, M., Schaefer, B. W., Sen, N., Song, Y., Gualtieri, A., et al. (2017) · Cancer Discovery · doi:10.1158/2159-8290.cd-16-1297 · Cited by 317
The Long and Short of Circulating Cell-Free DNA and the Ins and Outs of Molecular Diagnostics
Jiang, P., & Lo, Y. M. D. (2016) · Trends in Genetics · doi:10.1016/j.tig.2016.03.009 · Cited by 316
Larson, J. D., Kasper, L. H., Paugh, B. S., Jin, H., Wu, G., Kwon, C.-H., Fan, Y., Shaw, T. I., Silveira, A. B., Qu, C., et al. (2018) · Cancer Cell · doi:10.1016/j.ccell.2018.11.015 · Cited by 312
Ulz, P., Perakis, S. O., Zhou, Q. X., Moser, T., Belic, J., Lazzeri, I., Wölfler, A., Zebisch, A., Gerger, A., Pristauz, G., et al. (2019) · Nature Communications · doi:10.1038/s41467-019-12714-4 · Cited by 264
Self-citationDNA methylation heterogeneity defines a disease spectrum in Ewing sarcoma
Sheffield, N. C., Pierron, G., Klughammer, J., Datlinger, P., Schönegger, A., Schuster, M. K., Hadler, J., Surdez, D., Guillemot, D., Lapouble, E., et al. (2017) · Nature Medicine · doi:10.1038/nm.4273 · Cited by 258
Self-citationTomazou, E. M., Sheffield, N. C., Schmidl, C., Schuster, M. K., Schönegger, A., Datlinger, P., Kubicek, S., Bock, C., & Kovar, H. (2015) · Cell Reports · doi:10.1016/j.celrep.2015.01.042 · Cited by 256
Self-citationSun, K., Jiang, P., Cheng, S. H., Cheng, T. H. T., Wong, J., Wong, V. W., Ng, S. S. M., Ma, B. B. Y., Leung, T. Y., Chan, S. L., et al. (2019) · Genome Research · doi:10.1101/gr.242719.118 · Cited by 254
Non-random fragmentation patterns in circulating cell-free DNA reflect epigenetic regulation
Ivanov, M. V., Baranova, A. V., Butler, T. M., Spellman, P. T., & Mileyko, V. (2015) · BMC Genomics · doi:10.1186/1471-2164-16-s13-s1 · Cited by 221
Applications of liquid biopsies for cancer
Mattox, A. K., Bettegowda, C., Zhou, S., Papadopoulos, N., Kinzler, K. W., & Vogelstein, B. (2019) · Science Translational Medicine · doi:10.1126/scitranslmed.aay1984 · Cited by 196
Establishment of tumor‐specific copy number alterations from plasma DNA of patients with cancer
Heitzer, E., Auer, M., Hoffmann, E. M., Pichler, M., Gasch, C., Ulz, P., Lax, S., Waldispuehl‐Geigl, J., Mauermann, O., Mohan, S., et al. (2013) · International Journal of Cancer · doi:10.1002/ijc.28030 · Cited by 176
The SS18-SSX Oncoprotein Hijacks KDM2B-PRC1.1 to Drive Synovial Sarcoma
Banito, A., Li, X., Laporte, A. N., Roe, J., Sánchez-Vega, F., Huang, C., Dancsok, A. R., Hatzi, K., Chen, C.-C., Tschaharganeh, D. F., et al. (2018) · Cancer Cell · doi:10.1016/j.ccell.2018.01.018 · Cited by 158
Chicard, M., Daage, L. C., Clément, N., Danzon, A., Bohec, M., Bernard, V., Baulande, S., Bellini, A., Deveau, P., Pierron, G., et al. (2017) · Clinical Cancer Research · doi:10.1158/1078-0432.ccr-17-1586 · Cited by 150
Self-citationShulman, D. S., Klega, K., Imamovic-Tuco, A., Clapp, A., Nag, A., Thorner, A. R., Van Allen, E., Ha, G., Lessnick, S. L., Gorlick, R., et al. (2018) · British Journal of Cancer · doi:10.1038/s41416-018-0212-9 · Cited by 149
Klega, K. S., Imamović, A., Ha, G., Clapp, A. N., Meyer, S. C., Ward, A., Clinton, C., Nag, A., Allen, E. M. V., Mullen, E. A., et al. (2018) · JCO Precision Oncology · doi:10.1200/po.17.00285 · Cited by 142
Roy, N. V., Linden, M. V. D., Menten, B., Dheedene, A., Vandeputte, C., Dorpe, J. V., Laureys, G., Renard, M., Sante, T., Lammens, T., et al. (2017) · Clinical Cancer Research · doi:10.1158/1078-0432.ccr-17-0675 · Cited by 128
Ferrari, S., Hall, K. S., Luksch, R., Tienghi, A., Wiebe, T., Fagioli, F., Alvegård, T. A., del Prever, A. B., Tamburini, A., Alberghini, M., et al. (2010) · Annals of Oncology · doi:10.1093/annonc/mdq573 · Cited by 126
Synthetic lethality between the cohesin subunits STAG1 and STAG2 in diverse cancer contexts
van der Lelij, P., Lieb, S., Jude, J., Wutz, G., Santos, C. P., Falkenberg, K. J., Schlattl, A., Ban, J., Schwentner, R., Hoffmann, T., et al. (2017) · eLife · doi:10.7554/elife.26980 · Cited by 124
Visvanathan, K., Fackler, M. J., Zhang, Z., Bujanda, Z. A. L., Jeter, S. C., Sokoll, L. J., Garrett-Mayer, E. S., Cope, L., Umbricht, C. B., Euhus, D., et al. (2017) · Journal of Clinical Oncology · doi:10.1200/jco.2015.66.2080 · Cited by 103
Genomic EWSR1 Fusion Sequence as Highly Sensitive and Dynamic Plasma Tumor Marker in Ewing Sarcoma
Krumbholz, M., Hellberg, J., Steif, B., Bäuerle, T., Gillmann, C., Fritscher, T., Agaimy, A., Frey, B., Juengert, J., Wardelmann, E., et al. (2016) · Clinical Cancer Research · doi:10.1158/1078-0432.ccr-15-3028 · Cited by 100
Self-citationThirant, C., Ignacimouttou, C., Lopez, C. K., Diop, M. K., Mouël, L. L., Thiollier, C., Siret, A., Dessen, P., Aid, Z., Rivière, J., et al. (2017) · Cancer Cell · doi:10.1016/j.ccell.2017.02.006 · Cited by 93
Epigenetik erklärt Vielfalt von Krebs bei Kindern
(2017) · TumorDiagnostik & Therapie · doi:10.1055/s-0043-103387 · Cited by 93
Assessment of Pre-Analytical Sample Handling Conditions for Comprehensive Liquid Biopsy Analysis
Gerber, T., Taschner‐Mandl, S., Saloberger-Sindhöringer, L., Popitsch, N. P., Heitzer, E., Witt, V., Geyeregger, R., Hutter, C., Schwentner, R., Ambros, I. M., et al. (2020) · Journal of Molecular Diagnostics · doi:10.1016/j.jmoldx.2020.05.006 · Cited by 93
Self-citationErkek, S., Johann, P. D., Finetti, M. A., Drosos, Y., Chou, H.-C., Zapatka, M., Sturm, D., Jones, D., Korshunov, A., Ryzhova, M. V., et al. (2018) · Cancer Cell · doi:10.1016/j.ccell.2018.11.014 · Cited by 90
Analytical Biases Associated with GC-Content in Molecular Evolution
Romiguier, J., & Roux, C. (2017) · Frontiers in Genetics · doi:10.3389/fgene.2017.00016 · Cited by 87
Ewing‐like sarcoma: An emerging family of round cell sarcomas
Renzi, S., Anderson, N. D., Light, N. D., & Gupta, A. A. (2018) · Journal of Cellular Physiology · doi:10.1002/jcp.27558 · Cited by 82
Assessment of circulating tumor DNA in pediatric solid tumors: The promise of liquid biopsies
Abbou, S. D., Shulman, D. S., DuBois, S. G., & Crompton, B. D. (2019) · Pediatric Blood & Cancer · doi:10.1002/pbc.27595 · Cited by 72
Detection of circulating tumor DNA in patients with osteosarcoma
Barris, D. M., Weiner, S. B., Dubin, R. A., Fremed, M., Zhang, X., Piperdi, S., Zhang, W., Maqbool, S., Gill, J., Roth, M., et al. (2018) · Oncotarget · doi:10.18632/oncotarget.24268 · Cited by 63
Machado, I., Navarro, S., & Llombart‐Bosch, A. (2016) · PubMed · doi:10.14670/hh-11-792 · Cited by 62
Cheng, L., Pandya, P. H., Liu, E., Chandra, P., Wang, L., Murray, M. E., Carter, J., Ferguson, M. J., Saadatzadeh, M. R., Bijangi‐Vishehsaraei, K., et al. (2019) · BMC Medical Genomics · doi:10.1186/s12920-018-0456-5 · Cited by 55
Shukla, N. N., Patel, J. A., Magnan, H., Zehir, A., You, D., Tang, J., Meng, F., Samoila, A., Slotkin, E. K., Ambati, S. R., et al. (2017) · JCO Precision Oncology · doi:10.1200/po.16.00028 · Cited by 52
Jiménez, I., Chicard, M., Daage, L. C., Clément, N., Danzon, A., Lapouble, E., Pierron, G., Bohec, M., Baulande, S., Berrebi, D. D., et al. (2018) · International Journal of Cancer · doi:10.1002/ijc.31620 · Cited by 51
Self-citationCirculating cell-free tumor DNA analysis in pediatric cancers
Andersson, D., Fagman, H., Dalin, M. G., & Ståhlberg, A. (2019) · Molecular Aspects of Medicine · doi:10.1016/j.mam.2019.09.003 · Cited by 37
Eguchi‐Ishimae, M., Tezuka, M., Kokeguchi, T., Nagai, K., Moritani, K., Yonezawa, S., Tauchi, H., Tokuda, K., Ishida, Y., Ishii, E., et al. (2019) · Genes Chromosomes and Cancer · doi:10.1002/gcc.22734 · Cited by 30
MIRA: an R package for DNA methylation-based inference of regulatory activity
Lawson, J. T., Tomazou, E. M., Bock, C., & Sheffield, N. C. (2018) · Bioinformatics · doi:10.1093/bioinformatics/bty083 · Cited by 18
Self-citation
Research works printed but not linked: 1
- Li, H. Aligning sequence reads, clone sequences and assembly contigs with BWA-MEM. Preprint at https://arxiv.org/abs/1303.3997 (2013). · arXiv
Cited by
Sorted by citations
Swanson, K., Wu, E., Zhang, A., Alizadeh, A. A., & Zou, J. (2023) · Cell · doi:10.1016/j.cell.2023.01.035 · Cited by 597
The future of early cancer detection
Fitzgerald, R. C., Antoniou, A. C., Fruk, L., & Rosenfeld, N. (2022) · Nature Medicine · doi:10.1038/s41591-022-01746-x · Cited by 486
Circulating tumor DNA to monitor treatment response in solid tumors and advance precision oncology
Bartolomucci, A., de Nóbrega, M., Ferrier, S. T., Dickinson, K., Kaorey, N., Nadeau, A., Castillo, A., & Burnier, J. V. (2025) · npj Precision Oncology · doi:10.1038/s41698-025-00876-y · Cited by 301
Deep whole-genome ctDNA chronology of treatment-resistant prostate cancer
Herberts, C., Annala, M., Sipola, J., Ng, S. W. S., Chen, X. E., Nurminen, A., Korhonen, O. V., Munzur, A. D., Beja, K., Schönlau, E., et al. (2022) · Nature · doi:10.1038/s41586-022-04975-9 · Cited by 193
Bridging biological cfDNA features and machine learning approaches
Moser, T., Kühberger, S., Lazzeri, I., Vlachos, G., & Heitzer, E. (2023) · Trends in Genetics · doi:10.1016/j.tig.2023.01.004 · Cited by 133
Metadata
- Authors
- Peneder, P., Stütz, A. M., Surdez, D., Krumbholz, M., Semper, S., Chicard, M., Sheffield, N. C., Pierron, G., Lapouble, E., Tötzl, M., Ergüner, B., Barreca, D., Rendeiro, A. F., Agaimy, A., Boztug, H., Engstler, G., Dworzak, M., Bernkopf, M., Taschner-Mandl, S., Ambros, I. M., Myklebost, O., Marec-Bérard, P., Burchill, S. A., Brennan, B., Strauss, S. J., Whelan, J., Schleiermacher, G., Schaefer, C., Dirksen, U., Hutter, C., Boye, K., Ambros, P. F., Delattre, O., Metzler, M., Bock, C., & Tomazou, E. M.
- Affiliations
- St. Anna Children's Cancer Research Institute (AT)
- Inserm (FR)
- Universitätsklinikum Erlangen (DE)
- University of Virginia (US)
- Institut Curie (FR)
- Austrian Academy of Sciences (AT)
- St Anna Children's Hospital (AT)
- Oslo University Hospital (NO)
- St James's University Hospital (GB)
- Royal Manchester Children's Hospital (GB)
- University College Hospital (GB)
- Essen University Hospital (DE)
- Corresponding author
- Bock, Christoph
- Tomazou, Eleni M.
- ORCID
- Peneder, Peter
- Stütz, Adrian M.
- Surdez, Didier
- Krumbholz, Manuela
- Chicard, Mathieu
- Sheffield, Nathan C.
- Pierron, Gaelle
- Lapouble, Eve
- Tötzl, Marcus
- Ergüner, Bekir
- Barreca, Daniele
- Rendeiro, André F.
- Agaimy, Abbas
- Engstler, Gernot
- Dworzak, Michael
- Bernkopf, Marie
- Taschner-Mandl, Sabine
- Ambros, Inge M.
- Myklebost, Ola
- Burchill, Susan Ann
- Brennan, Bernadette
- Strauss, Sandra J.
- Whelan, Jeremy
- Schleiermacher, Gudrun
- Schaefer, Christiane
- Dirksen, Uta
- Hutter, Caroline
- Boye, Kjetil
- Ambros, Peter F.
- Delattre, Olivier
- Metzler, Markus
- Bock, Christoph
- Tomazou, Eleni M.
- Venue
- Nature Communications
- Published
- 2021-05-28
- Volume
- 12
- Issue
- 1
- Pages
- 3230-3230
- ISSN
- 2041-1723 (ISSN-L)
- PMC
- PMC8163828
- OpenAlex
- W3165287952
- Cited by
- 200
- References
- 82
- Citations by year
- 2026: 26 · 2025: 39 · 2024: 38 · 2023: 45 · 2022: 39 · 2021: 12
- FWCI
- 13.63
- Type
- journal article
- Language
- en
- Open access
- gold
- doi.org
- Locations
- Nature Communications (publishedVersion, cc-by)
- PubMed Central (publishedVersion, cc-by)
- PubMed (publishedVersion)
- White Rose Research Online (University of Leeds, The University of Sheffield, University of York) (acceptedVersion)
- Zurich Open Repository and Archive (University of Zurich) (acceptedVersion, cc-by)
- RePEc: Research Papers in Economics (submittedVersion)
- NORA - Norwegian Open Research Archives (submittedVersion, cc-by)
- DOAJ (DOAJ: Directory of Open Access Journals) (submittedVersion, cc-by-sa)
- UCL Discovery (University College London) (submittedVersion)
- Zurich Open Repository and Archive (University of Zurich) (submittedVersion, cc-by)
- Zurich Open Repository and Archive (University of Zurich)
- Funders
- Kreftforeningen
- European Commission (HORIZON2020, 602856)
- Vienna Science and Technology Fund (LS18-049)
- Austrian Science Fund (V 506, I 2798)
- Oesterreichische Nationalbank (17876)
- Ligue Contre le Cancer
- Deutsche Krebshilfe (#108128, 70112018, DKH 108128, 70113419)
- H2020 European Research Council (679146)
- Topics
- Life Sciences › Biochemistry, Genetics and Molecular Biology › Cancer Research › Cancer Genomics and Diagnostics
- Health Sciences › Medicine › Oncology › Sarcoma Diagnosis and Treatment
- Life Sciences › Biochemistry, Genetics and Molecular Biology › Genetics › Genomic variations and chromosomal abnormalities
- Keywords
- liquid biopsy, cell-free DNA, childhood cancer, Ewing sarcoma, pediatric sarcoma, low mutational burden, cfDNA fragmentation, chromatin signatures, epigenetic dysregulation, prognostic factors, machine learning classifiers
- MeSH terms
- Whole Genome Sequencing, Liquid Biopsy, Circulating Tumor DNA, Adolescent, Adult, Bone Neoplasms, Child, Child, Preschool, DNA Mutational Analysis, Female, Humans, Infant, Male, Middle Aged, Mutation, Sarcoma, Ewing, Biomarkers, Tumor, Case-Control Studies, Young Adult
About these checks
Registry, retraction, Cites and statistics results are computed, not judged, with one exception: a printed reference that no index lists is read once by a model before it counts as a citation error. Claims are extracted by a model and kept only when their quote appears verbatim in the text; each cited source is then checked, with a model’s help, for whether it says what the claim relies on. Those verdicts can be wrong — read the claim’s quote and the cited source before relying on one.
Statistics and arithmetic are recomputed, not judged.
Confidence bands are shown only for fields calibrated on our annotated test set. None is calibrated yet, so no band is shown.
What counts as a claim ›How we measure confidence ›How we check this ›
Are you an author, or do you see a problem with this page? Request a review
