

The DOI matches its Crossref record; 94 of the 97 references it cites were found in a registry or an index.
Promoter G-quadruplexes and transcription factors cooperate to shape the cell type-specific transcriptome
Open accessPublished version of a preprint
Abstract
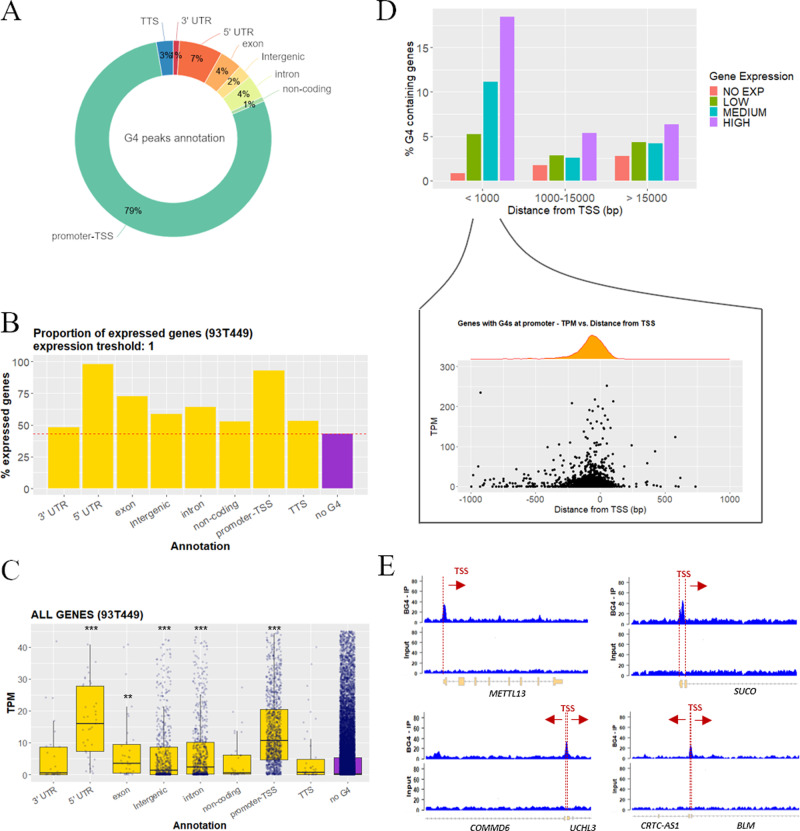
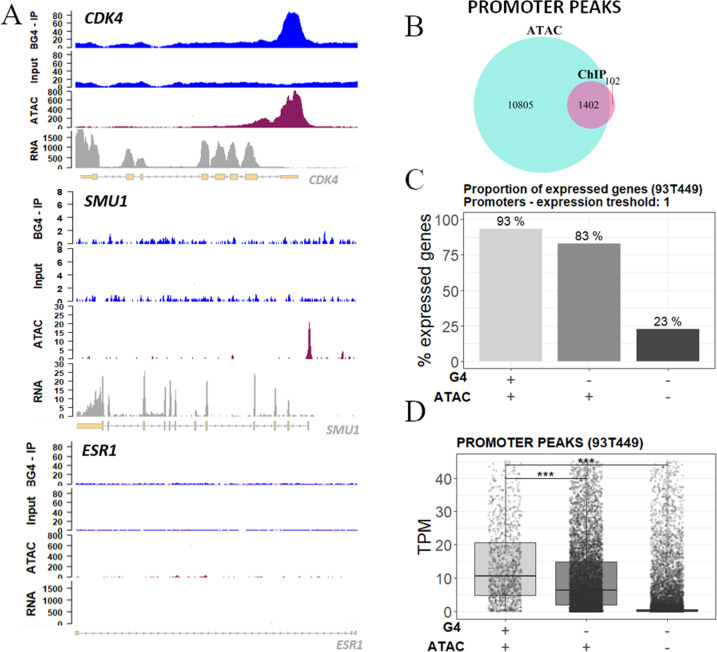
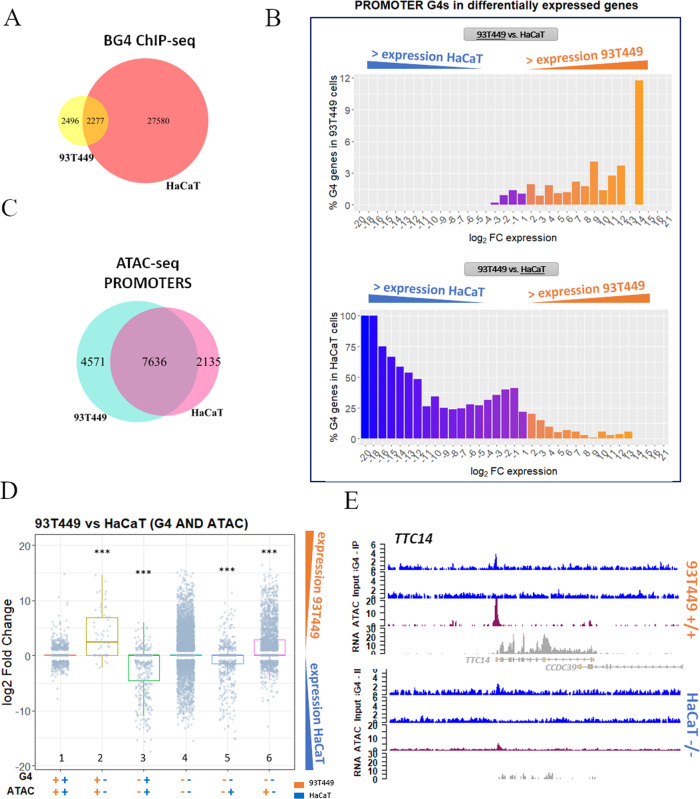
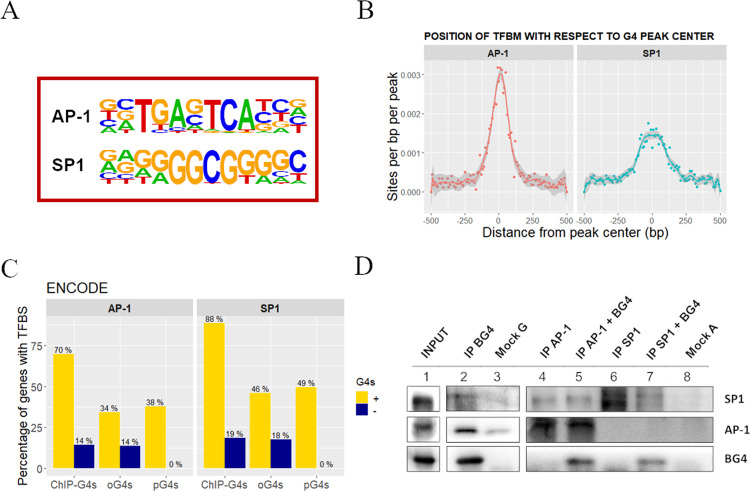
Cell identity is maintained by activation of cell-specific gene programs, regulated by epigenetic marks, transcription factors and chromatin organization. DNA G-quadruplex (G4)-folded regions in cells were reported to be associated with either increased or decreased transcriptional activity. By G4-ChIP-seq/RNA-seq analysis on liposarcoma cells we confirmed that G4s in promoters are invariably associated with high transcription levels in open chromatin. Comparing G4 presence, location and transcript levels in liposarcoma cells to available data on keratinocytes, we showed that the same promoter sequences of the same genes in the two cell lines had different G4-folding state: high transcript levels consistently associated with G4-folding. Transcription factors AP-1 and SP1, whose binding sites were the most significantly represented in G4-folded sequences, coimmunoprecipitated with their G4-folded promoters. Thus, G4s and their associated transcription factors cooperate to determine cell-specific transcriptional programs, making G4s to strongly emerge as new epigenetic regulators of the transcription machinery.
Overview
The claims and statistics of this paper haven’t been checked yet.
Run the check — free, no account needed. It reads the open-access text and checks the sources it cites.
Integrity signals
Registry
Cites
Statistics
Figures
Verification
Claims the paper makes
The claims and statistics of this paper haven’t been checked yet.
Run the check — free, no account needed. It reads the open-access text and checks the sources it cites.
Claims other papers make about this one
Each is checked against this paper’s own text: does it say what the citing paper says it does?
The source backs part of the claim, not all of it — or backs it for a different population, condition or comparison.
In the citing paper
“However, G4s hold various regulatory functions in transcription and translation (20)”
From G-quadruplex-mediated genomic instability drives SNVs in cancer (2024) · cites this paper as [20]
Experimental — accuracy not yet measured
Self-check
Percentages, sums and reported differences re-computed from the paper’s own numbers.
The self-check needs the paper’s full text.
Citations
Cites
Hallmarks of Cancer: The Next Generation
Hanahan, D., & Weinberg, R. A. (2011) · Cell · doi:10.1016/j.cell.2011.02.013 · Cited by 66,590
The Sequence Alignment/Map format and SAMtools
Li, H., Handsaker, B., Wysoker, A., Fennell, T., Ruan, J., Homer, N., Marth, G., Abecasis, G., Durbin, R., & 1000 Genome Project Data Processing Subgroup (2009) · Bioinformatics · doi:10.1093/bioinformatics/btp352 · Cited by 62,041
BEDTools: a flexible suite of utilities for comparing genomic features
Quinlan, A. R., & Hall, I. M. (2010) · Bioinformatics · doi:10.1093/bioinformatics/btq033 · Cited by 27,437
Model-based Analysis of ChIP-Seq (MACS)
Zhang, Y., Liu, T., Meyer, C. A., Eeckhoute, J., Johnson, D. S., Bernstein, B. E., Nusbaum, C., Myers, R. M., Brown, M., Li, W., et al. (2008) · Genome Biology · doi:10.1186/gb-2008-9-9-r137 · Cited by 18,386
ATAC-seq: a method for assaying chromatin accessibility genome-wide
Buenrostro, J. D., Wu, B., Chang, H. Y., & Greenleaf, W. J. (2015) · Current Protocols in Molecular Biology · doi:10.1002/0471142727.mb2129s109 · Cited by 3,289
An improved ATAC-seq protocol reduces background and enables interrogation of frozen tissues
Corces, M. R., Trevino, A. E., Hamilton, E. G., Greenside, P. G., Sinnott-Armstrong, N. A., Vesuna, S., Satpathy, A. T., Rubin, A. J., Montine, K. S., Wu, B., et al. (2017) · Nature Methods · doi:10.1038/nmeth.4396 · Cited by 2,496
Siddiqui-Jain, A., Grand, C. L., Bearss, D. J., & Hurley, L. H. (2002) · Proceedings of the National Academy of Sciences · doi:10.1073/pnas.182256799 · Cited by 2,274
Quantitative visualization of DNA G-quadruplex structures in human cells
Biffi, G., Tannahill, D., McCafferty, J., & Balasubramanian, S. (2013) · Nature Chemistry · doi:10.1038/nchem.1548 · Cited by 2,173
Zhu, A., Ibrahim, J. G., & Love, M. I. (2018) · Bioinformatics · doi:10.1093/bioinformatics/bty895 · Cited by 2,142
Prevalence of quadruplexes in the human genome
Huppert, J. L., & Balasubramanian, S. (2005) · Nucleic Acids Research · doi:10.1093/nar/gki609 · Cited by 1,795
Research works printed but not linked: 1
- Hänsel-Hertsch, R. et al. G-quadruplex structures mark human regulatory chromatin. Nat Genet. 48, 1267–1272 (2016). · DOI · Paper page
Cited by
Sorted by citations
Items 101–200 of 204
G-Quadruplex Unwinding Molecular Mechanisms by Helicases and Their Applications
Sun, J., Wang, Y., Huang, Y., & Chen, Z. (2026) · International Journal of Molecular Sciences · doi:10.3390/ijms27041629 · Cited by 3
“The observed stability is therefore conditional, being dictated by topological constraints, protection afforded by protein or ligand binding, and the chromatin dynamics associated with cell-cycle progression [8–10].”
Opposing roles of two R-loop associated G-quadruplexes in tuning transcription activity
Yang, L.-Y., Lee, C.-Y., Paul, T., & Myong, S. (2025) · Nucleic Acids Research · doi:10.1093/nar/gkaf930 · Cited by 6
“Its presence correlates with gene expression through mechanisms such as modulating transcription factor binding and RNA polymerase activity [ 19–21 ].”
Bartosik, A. R., Hou, P.-C., Vaughn, J. P., Smaldino, P. J., Ratan, A., Mayo, M. W., & Yuh-Hwa, W. (2025) · bioRxiv · doi:10.1101/2025.01.03.631217 · Cited by 6
“G4 structures are enriched in key regulatory regions such as enhancers, promoters, and transcription factor binding sites, where they have been implicated in transcriptional regulation (11–14).”
Seth, P., Xing, E., Hendrickson, A. D., Li, K., Monsen, R. C., Chaires, J., Neidle, S., & Yatsunyk, L. (2024) · Nucleic Acids Research · doi:10.1093/nar/gkae1208 · Cited by 6
Targeting liposarcoma: unveiling molecular pathways and therapeutic opportunities
Liu, H., Wang, X., Liu, L., Yan, B., Qiu, F., & Zhou, B. (2024) · Frontiers in Oncology · doi:10.3389/fonc.2024.1484027 · Cited by 5
G‐Quadruplexes in Gene Regulation and Cellular Function
Wen, Q., Guo, L., Bordbar, F., & Nie, Q. (2025) · Wiley Interdisciplinary Reviews - RNA · doi:10.1002/wrna.70019 · Cited by 6
“…have highlighted the contribution of G4s to epigenetic mechanisms (Belotserkovskii et al. 2017; Mao et al. 2018; Mukherjee et al. 2019), regulating cell- type-specific transcriptome profiles (Lago et al. 2021; Zyner et al. 2022) and influencing higher-order chromatin structure (Hou et al. 2019).”
Liquid condensates: a new barrier to loop extrusion?
Selivanovskiy, A. V., Molodova, M. N., Khrameeva, E. E., Ulianov, S. V., & Razin, S. V. (2025) · Cellular and Molecular Life Sciences · doi:10.1007/s00018-024-05559-8 · Cited by 6
“While the high MAZ expression in hepa-tocarcinoma cells facilitates the detection of MAZ conden-sates, G-quadruplexes are often associated with promoters of actively transcribed genes [115, 116].”
Interlocking G-Quadruplexes Using a G-Triad•G Connection: Implications for G-Wire Assembly.
Singh, A., Winnerdy, F., Avila, C. A., Nogues, C., Phan, A., & Heddi, B. (2024) · Journal of the American Chemical Society · doi:10.1021/jacs.4c05713 · Cited by 5
Oncogenic and telomeric G-quadruplexes: Targets for porphyrin-triphenylphosphonium conjugates
Moura, N. M. M., Guedes, S. D. M., Salvador, D., Oliveira, H., Alves, M., Paradis, N. J., Wu, C. F., Neves, M. G. P. M. S., & Ramos, C. I. V. (2024) · International Journal of Biological Macromolecules · doi:10.1016/j.ijbiomac.2024.134126 · Cited by 5
Correlations of the CNR1 Gene with Personality Traits in Women with Alcohol Use Disorder
Maciocha, F., Suchanecka, A., Chmielowiec, K., Chmielowiec, J., Ciechanowicz, A., & Boroń, A. (2024) · International Journal of Molecular Sciences · doi:10.3390/ijms25105174 · Cited by 6
“Additionally, GC-rich repeats in promoter regions can form stable G4 quadruplexes that regulate transcriptional activity [82,83].”
BackgroundDatta, A., Sommers, J. A., Jhujh, S. S., Harel, T., Stewart, G. S., & Brosh, R. M. (2023) · Ageing Research Reviews · doi:10.1016/j.arr.2023.101887 · Cited by 5
G-quadruplex landscape and its regulation revealed by a new antibody capture method
Datta, S., Patel, M., Sathyaseelan, C., Ghosh, C., Mudgal, A., Patel, D., Rathinavelan, T., & Singh, U. (2023) · bioRxiv · doi:10.18632/oncotarget.28564 · Cited by 5
“Studies indicate that the regulation of expression of some genes depends on quadruplex formation in their cis-regulatory regions [21–23].”
Sex-specific variation in R-loop formation in Drosophila melanogaster
Stanek, T., Cao, W.-H., Mehra, R. M., & Ellison, C. (2022) · PLoS Genetics · doi:10.1371/journal.pgen.1010268 · Cited by 5
“Similarly, we find that R-loops are enriched at G-quadruplexes (G4), which have been associated with open chromatin and high transcription [36], as well as TAD boundaries, where increased gene expression has been observed relative to genes within TADs [19].”
BackgroundssG4-seq for global profiling of strand-specific G-quadruplex structures in mammalian genomes
Li, S., Wang, R., Zhang, J., Cao, C., Bai, J., Cai, Z., Ye, R., Chen, J., Liu, W., Chen, L., et al. (2025) · Nature Communications · doi:10.1038/s41467-025-66895-2 · Cited by 5
Pavlova, I., Ivanova, O. M., Iudin, M. S., Surdina, A. V., Barinov, N. A., Bogomiakova, M. E., Oreshkov, S. D., Shenkarev, Z. O., Severov, V. V., Klinov, D. V., et al. (2025) · Nucleic Acids Research · doi:10.1093/nar/gkaf726 · Cited by 5
“Pro-moter G4s have received much attention in this regard [ 27 , 28 ], whereas enhancer G4s have remained in the background.”
Obi, I., Sengupta, P., & Sabouri, N. (2025) · bioRxiv · doi:10.1093/nar/gkaf853 · Cited by 4
“Some G4 structures are known to serve as binding hubs for transcription factors, such as SP1 (Specificity Protein 1), which binds G4s in the promoter regions of cKIT and cMYC oncogenes [ 100–102 ].”
Pohle, M., Curry, E., Holden, R., Gibson, S. J., & Brown, A. J. (2025) · Nucleic Acids Research · doi:10.1093/nar/gkaf732 · Cited by 4
“While some G4s have been shown to upregulate protein expression, e.g. via transcription factor recruitment [ 22 , 23 ], when appropriately positioned within promoters and 5 (cid:2) UTRs, they can act to reduce protein biosynthesis by disrupting the function of general transcriptional or…”
Lahnsteiner, A., Ellmer, V., Oberlercher, A., Liutkevičiūtė, Z., Schönauer, E., Paulweber, B., Aigner, E. S., & Risch, A. (2024) · Scientific Reports · doi:10.1038/s41598-024-70749-0 · Cited by 8
“Additionally, the TM6SF2 intron 2-exon 3 boundary could be subject to alternative splicing, since exon 3 of TM6SF2 is annotated as a cassette exon, and G4s are enriched at distal splice sites of such exons 33 .”
BackgroundInfluentialZhuk, A., Stepchenkova, E., Zotova, I., Belopolskaya, O., Pavlov, Y., Kostroma, I., Gritsaev, S., & Aksenova, A. (2024) · International Journal of Molecular Sciences · doi:10.3390/ijms25105269 · Cited by 4
“Thus, G4s in promoters are associated with high transcription levels in open chromatin [23,24].”
BackgroundG4-Attention: Deep Learning Model with Attention for predicting DNA G-QuadruplexesPreprint
Mukherjee, S., Pramanik, P., Basuchowdhuri, P., & Bhattacharya, S. (2024) · bioRxiv (Cold Spring Harbor Laboratory) · doi:10.1101/2024.11.04.621797 · Cited by 6
Chudakova, D. A., Samoilova, E. M., Chekhonin, V. P., & Baklaushev, V. P. (2023) · Cells · doi:10.3390/cells12202499 · Cited by 5
“G4s are known to be involved in the regulation of transcription, mRNA processing, and localization, including in the case of “neural” genes, and supposedly play a role in cellular differentiation [111,112].”
BackgroundTelomeric retrotransposons show propensity to form G-quadruplexes in various eukaryotic species
Jedlička, P., Tokan, V., Kejnovská, I., Hobza, R., & Kejnovský, E. (2023) · Mobile DNA · doi:10.1186/s13100-023-00291-9 · Cited by 4
“Firstly, the majority of the PQS were located in the coding region of the gag gene while in genomes the PQS are mainly accumulated in regulatory regions such as promoters or UTRs and are mostly excluded from coding regions [42, 43].”
BackgroundGenomic distribution and polymorphism of G-quadruplex motifs occupying ovine promoters and enhancers
Stefos, G., Theodorou, G., & Politis, I. (2023) · Mammalian Genome · doi:10.1007/s00335-023-09988-x · Cited by 4
Teng, X.-C., Dai, Y.-C., Li, K., Wu, Y., Hou, H.-B., & Li, J.-H. (2023) · Small Methods · doi:10.1002/smtd.202201487 · Cited by 4
Pavlova, I., Barinov, N. A., Новиков, Р. А., Severov, V. V., Iudin, M. S., Vedekhina, T., Larin, A. K., Babenko, V. V., Aralov, A. V., Gnuchikh, E. Y., et al. (2022) · Biochimie · doi:10.1016/j.biochi.2022.08.016 · Cited by 6
G-quadruplex structures are transcriptional regulatory hubs of super-enhancers
Huang, H., Xiao, K., Wang, Z., Zhu, W., Gu, Y., & Sun, X. (2026) · International Journal of Biological Macromolecules · doi:10.1016/j.ijbiomac.2025.150074 · Cited by 2
G-quadruplex structures as modulators of alternative promoter usage
Zhang, R., & Mergny, J. (2025) · NAR Genomics and Bioinformatics · doi:10.1093/nargab/lqaf208 · Cited by 5
“We and others have previously reported a positive correlation between G4 structures and promoter activity [ 13 , 14 ].”
InfluentialIdentification of Guanine-Quadruplex-Binding Peptides from the RGG3 Domain of TLS/FUS.
Takeo, S., Tabata, M., Okita, H., Shibata, N., Sato, K., Mase, N., Oyoshi, T., & Narumi, T. (2025) · Chemical and pharmaceutical bulletin · doi:10.1248/cpb.c25-00413 · Cited by 3
Chantzi, N., Liew, S. W., Wijaya, A., Chan, C. S. Y., Mouratidis, I., Amaral, E. D. O. S., Uzun, Y., Hemberg, M., Vasquez, K. M., Kwok, C.-K., et al. (2025) · bioRxiv · doi:10.1101/2025.06.17.660256 · Cited by 3
Non-canonical DNA in human and other ape telomere-to-telomere genomes
Smeds, L., Kamali, K., Kejnovská, I., Kejnovský, E., Chiaromonte, F., & Makova, K. D. (2025) · Nucleic Acids Research · doi:10.1093/nar/gkaf298 · Cited by 35
Complex determinants of R-loop formation at transposable elements and major DNA satellites
Stanek, T. J., Kneebone, A., Lawlor, M. A., Cao, W., & Ellison, C. E. (2025) · Genetics · doi:10.1093/genetics/iyaf035 · Cited by 3
The versatile NDI-based compounds: emerging anticancer and antimicrobial agents
Tosoni, B., Nadai, M., Caramiello, A. M., Doria, F., Freccero, M., & Richter, S. N. (2024) · Medicinal Chemistry Research · doi:10.1007/s00044-024-03329-6 · Cited by 4
“Recently, numerous genome-wide studies in human cells have speci fi cally iden-ti fi ed the highest concentration of G4s within nucleosome-depleted regions, particularly in gene promoters, showing correlation with transcriptional regulatory activity [14, 15].”
Self-citationJha, A., Hristov, B., Wang, X., Wang, S., Greenleaf, W. J., Kundaje, A., Aiden, E. L., Bertero, A., & Noble, W. (2024) · bioRxiv · doi:10.1101/2024.09.16.613355 · Cited by 3
“…may regulate their targets through higher expression but not necessarily differences in conservation or disorder in protein structure than non-enriched TFs. Finally, we observed several G-rich motifs in the trans TF set, including some TFs, such as SP1, that bind to G-quadruplexes (G4s) [49].”
De-Paula, R. B., Bacolla, A., Syed, A., & Tainer, J. A. (2024) · Journal of Biological Chemistry · doi:10.1016/j.jbc.2024.107822 · Cited by 3
Non-B DNA in plant genomes: prediction, mapping, and emerging roles.
Ferrero, L. V., Zhang, W.-L., Benhamed, M., Crespi, M., & Ariel, F. (2024) · Trends in Plant Science · doi:10.1016/j.tplants.2024.06.011 · Cited by 3
Roy, L., Roy, A., Bose, D., Banerjee, N., & Chatterjee, S. (2023) · Journal of Biomolecular Structure and Dynamics · doi:10.1080/07391102.2023.2268200 · Cited by 3
King, J. J., Evans, C. W., Kadolsky, U., Norret, M., Iqbal, M., Mercé, C., Bhatia, S., Gregory, P. A., Thompson, E. W., Saxena, A., et al. (2023) · bioRxiv · doi:10.1101/2023.08.21.554220 · Cited by 3
D’Addabbo, P., Frezza, D., & Sulentic, C. E. W. (2023) · Frontiers in Immunology · doi:10.3389/fimmu.2023.996119 · Cited by 7
Function through shape: An overview of DNA G-quadruplexes in transcriptional regulation.
Nuccio, S. P., Stasi, M., Cadoni, E., & di Antonio, M. (2026) · Current Opinion in Chemical Biology · doi:10.1016/j.cbpa.2026.102718 · Cited by 2
Singlet oxygen-induced covalent trapping of G4-binding peptides onto their cognate target G4
Barr, J., Colpaert, G., Waeyenberge, L., Cadoni, E., & Madder, A. (2026) · Cell Reports Physical Science · doi:10.1016/j.xcrp.2026.103267 · Cited by 2
Thermodynamic control of gene regulation
Wells, J. W., & Chalikian, T. (2025) · QRB Discovery · doi:10.1017/qrd.2025.10013 · Cited by 2
“…or by serving as recognition sites for G-quadruplex-binding proteins, such as transcription factors, that participate in transcription (Tateishi-Karimata and Sugimoto, 2020; Varshney et al. , 2020; Lago et al. , 2021; Robinson et al. , 2021; Shen et al. , 2021; Esain-Garcia et al. , 2024).”
InfluentialDNA G-quadruplex profiling in skeletal muscle stem cells reveals functional and mechanistic insights
Chen, X., Yang, F., Zhang, S., Guo, X., Zhao, J., Qiao, Y., He, L., Li, Y., Zhou, Q., Ong, M. T., et al. (2025) · Genome biology · doi:10.1186/s13059-025-03753-w · Cited by 6
“However, recent advancements following genome-wide mapping of endogenous G4s have demonstrated that G4s are frequently enriched at promoters of actively transcribed genes, where they act as transcriptional enhancers rather than suppressors [21, 24, 43].”
Mammalian conservation of endogenous G-quadruplex reveals their associations with complex traits
Zhang, Z.-H., Wang, Z., Li, C., Qian, S. H., Zhang, W., & Chen, Z. (2025) · Genome biology · doi:10.1186/s13059-025-03750-z · Cited by 4
Smith, S. S. (2025) · Nucleic Acids Research · doi:10.1093/nar/gkaf762 · Cited by 2
DNA glycosylases Ogg1 and Mutyh influence gene expression of PRC2 targets associated with cognition
Abentung, A., Sakshaug, T., Dumaru, R., Liabakk, N., Yang, M., Wang, J., Bjørås, M., & Scheffler, K. (2025) · Cellular and Molecular Life Sciences · doi:10.1007/s00018-025-05730-9 · Cited by 4
“G4 structures occur in CpG rich regions and have been implicated in gene regulation [ 65 , 66 ].”
Metal–stabilized G–quadruplexes: biological insights and sensing applications
Kim, S.-M., Kim, D., & Kim, Y. (2025) · BMB Reports · doi:10.5483/bmbrep.2025-0048 · Cited by 2
“For example, AP − 1 and SP1, two master transcription factors, are able to bind their recognition sites in the presence of folded G4 structures, thereby contributing to cell type – specific transcriptional programs (38).”
The effect of prolonged G-quadruplex stabilization on the functions of human cells
Karatayeva, N., Hegedűs, L., Bhattacharjee, A., Németh, E., Póti, Á., Pongor, L. S., Juhász, G., Szüts, D., & Burkovics, P. (2025) · Scientific Reports · doi:10.1038/s41598-025-04791-x · Cited by 4
“…triggered by stabilizing G4 structures, as well as their possible regulatory role in the expression of genes involved in cancer development 38 , we aimed to investigate the mutagenic potential of stabilizing these structures on the whole human genome and to explore the effects of this…”
Zia, S., Rehman, N., Ejaz, S., Shahid, M., Ali, M. M., & Shahid, R. (2024) · The International Journal of Biochemistry & Cell Biology · doi:10.1016/j.biocel.2024.106698 · Cited by 1
Agostini, R. B., Piga, E. J., Bayón, C., Binolfi, A., Armas, P., Campos‐Bermudez, V. A., & Rius, S. P. (2024) · Plants · doi:10.3390/plants13202925 · Cited by 2
“…depend on their interaction with other biomolecules in living cells as part of an interconnected network, involving G4s as binding hubs for transcription factors and mediators of histone marks while interacting with chromatin remodeling proteins, thus shaping chromatin architecture [19–22].”
BackgroundRoy, S., Bagri, S., Vinayagamurthy, S., Sengupta, A., Then, C. R., Kumar, R., Sridharan, S., & Chowdhury, S. (2024) · bioRxiv · doi:10.1101/2023.11.27.568900 · Cited by 2
“…of transcription factors and RNA polymerase or via alteration of DNA accessibility by modulating the epigenetic state of the gene promoters (Hussain et al., 2017; Kumar et al., 2011; Lago et al., 2021; Mukherjee et al., 2019; Saha et al., 2017; Sharma et al., 2021; Varshney et al., 2020).”
BackgroundLu, K., Wang, H.-C., Tu, Y.-C., Lou, P., Chang, T., & Lin, J. (2023) · Biochemical Pharmacology · doi:10.1016/j.bcp.2023.115788 · Cited by 2
Helquat dyes targeting G-quadruplexes as a new class of anti-HIV-1 inhibitors
Pávová, M., Reyes‐Gutierrez, P. E., Kozák, J., Dobiáš, J., Yurenko, Y. P., Lepšı́k, M., Teplý, F., & Weber, J. (2023) · Scientific Reports · doi:10.1038/s41598-023-33263-3 · Cited by 2
Play of molecular host: guest assembly on a G-quadruplex binder
Alexander, A., Pillai, A. S., Grace, S. R., Ananthi, N., Pal, H., Enoch, I. M. V., & Sayed, M. (2023) · Journal of Inclusion Phenomena and Macrocyclic Chemistry · doi:10.1007/s10847-023-01185-2 · Cited by 2
“Further, the human telomeric fragment (telo) represents a demonstrated G-quadruplex forming structure that inhibits telomerase’s activity associated with uncontrolled cell proliferation [34].”
BackgroundRNA transcripts suppress G-quadruplex structures through G-loop formationPreprint
Sato, K., Hendrikx, A., & Knipscheer, P. (2023) · bioRxiv · doi:10.1101/2023.03.09.531892 · Cited by 2
Miclot, T., Hognon, C., Bignon, E., Terenzi, A., Grandemange, S., Barone, G., & Monari, A. (2022) · Molecules · doi:10.3390/molecules27103256 · Cited by 4
Cai, X., Liu, Y., Li, J., Zhao, Z., Yao, X., Zhai, Z., Liucong, M., Liu, Y., Wang, X., Mochizuki, K., et al. (2026) · Science China Life Sciences · doi:10.1007/s11427-025-3103-x · Cited by 1
“Second, G-quadruplexes serve as binding platforms for transcription factors, which in turn facilitate transcription (Lago et al., 2021; Li et al., 2021b; Spiegel et al., 2021; Wulfridge et al., 2023; Yuan et al., 2023).”
B-MYB (MYBL2): from cell cycle regulator to an oncogenic player
Miranda, A., Oliveira, P. A., Mergny, J., & Cruz, C. (2026) · Biochimica et Biophysica Acta (BBA) - Reviews on Cancer · doi:10.1016/j.bbcan.2026.189697 · Cited by 1
The G-force in the genome: Unknowns on the functional flairs of DNA G-quadruplexes
Gallina, I., & Richter, S. N. (2026) · PLoS Biology · doi:10.1371/journal.pbio.3003874 · Cited by 1
“Soon after their discovery in the promoters of oncogenes such as MYC and given their genome-wide enrichment and structural conservation at the TSS [34], G4s were implicated in transcriptional regulation, a view now supported by substantial experimental evidence based on quantitative occupancy [35].”
Self-citationVariation and selection at predicted G-quadruplexes across the human pangenomePreprint
Mohanty, S., Marin, M. G., Smeds, L., Chiaromonte, F., Huber, C., & Makova, K. D. (2026) · bioRxiv · doi:10.64898/2026.06.18.733261 · Cited by 1
“Our results are consistent with G4 function at promoters—e.g., in gene activation (Li et al. 2023), transcription factor binding (Lago et al. 2021), and activation of alternative promoters (Zhang and Mergny 2025); at introns—e.g., in alternative splicing (Georgakopoulos-Soares, Parada, Wong, et al.…”
Akbulut, D., Pölderl, G., & Næsborg, L. (2026) · Archiv der Pharmazie · doi:10.1002/ardp.70242 · Cited by 1
“In particular, G‐quadruplexes could enhance or suppress transcriptional activity depending on their structures, which are parallel, anti‐parallel, or hybrid [106, 107].”
Photoclick chemistry led to the identification of HELLS as a helicase for DNA G-quadruplexes
Gao, Z., Chong, Y., He, X.-M., Yuan, J., & Wang, Y.-S. (2026) · Nucleic Acids Research · doi:10.1093/nar/gkag034 · Cited by 1
“These unique secondary structures have attracted considerable attention owing to their functions in various biological processes, including telomere maintenance [ 2 ] as well as DNA replication [ 3 ], transcription [ 4 ], and repair [ 5 ].”
Transcriptome-wide mapping reveals a non-canonical RNA-dependent mechanism of platinum cancer drugsPreprint
Krishnaraj, A., Wei, X., Thakral, R., Guo, W., Subramaniyan, S. B., Zhang, X., Alley, K. R., Feng, A., Hoy, A., Kung, D., et al. (2025) · bioRxiv (Cold Spring Harbor Laboratory) · doi:10.64898/2025.12.20.694502 · Cited by 1
“G4 structures are cell-type specific and shape lineage-specific transcriptional programs 83-85 .”
Loop topology enables programmable apoptosis in G-quadruplex aptamers.
Shaarawy, A. A., Ismail, M. F., Shehata, N., Shamloula, H. K., & Silva, M. W. D. (2025) · Bioorganic chemistry (Print) · doi:10.1016/j.bioorg.2025.109133 · Cited by 1
Evaluating Reproducibility and Best Practices for Replicate Design in G-Quadruplex ChIP-Seq Studies
Xiao, K., Zhang, R., & Tu, J. (2025) · International Journal of Molecular Sciences · doi:10.3390/ijms26199769 · Cited by 1
“A common practice in G4 antibody-based sequencing studies is the use of only two biological replicates [8,9,17], and in some cases even one, often due to experimental constraints or specific research objectives [8–10].”
Aktary, Z., Sorg, K., Cucchiarini, A., Vesco, G., Noury, D., Zhang, R., Jourdain, T., Verga, D., Mahou, P., Olivier, N., et al. (2025) · bioRxiv · doi:10.1093/nar/gkag067 · Cited by 1
“Recent evidence suggests G4s may also contribute to epigenetic regulation, influencing cell-type-specific transcriptomes [ 34 , 35 ] and higher-order chromatin structures [ 31 , 36 ].”
Rapid G4 Ligand Screening Through Spectral Changes Using HT-SRCD with Minimal Material
Rotondo, M., Honisch, C., Spanu, P., Ulgheri, F., Loriga, G., Beccu, A., Hussain, R., Biondi, B., Ruzza, P., & Siligardi, G. (2025) · Molecules · doi:10.3390/molecules30163322 · Cited by 1
“DNA G4s are non-randomly distributed and are primarily located in regions of biological significance, including telomeres [6,7], promoter regions of oncogenes [8,9], and the 5 ′ untranslated regions of genes [10,11].”
Monti, L., Firth, G., Faria, J. R. C., Kelly, J. M., Flint, G., Galli, S., Maher, T. E., Aye, H. M., & di Antonio, M. (2025) · bioRxiv · doi:10.1093/nar/gkag637 · Cited by 1
One Wnt to lead them all: a Wnt1 primer
Lekven, A. C., Empie, S., & Saoud, R. (2025) · Differentiation · doi:10.1016/j.diff.2025.100884 · Cited by 1
Luige, J., Conrad, T., Armaos, A., Louloupi, A., Vincent, A. I., Meierhofer, D., Gajhede, M., Tartaglia, G. G., & Ørom, U. A. (2025) · Computational and Structural Biotechnology Journal · doi:10.1016/j.csbj.2025.06.027 · Cited by 3
“Genomic DNA harbors G4s at important regulatory regions, such as promoters and enhancers [31, 32].”
Bisoi, A., Majumdar, T., Sarkar, S., & Singh, P. C. (2025) · Journal of Physical Chemistry B · doi:10.1021/acs.jpcb.5c00526 · Cited by 1
Bose, D., Banerjee, N., Roy, A., Sengupta, P., & Chatterjee, S. (2024) · Journal of Biomolecular Structure and Dynamics · doi:10.1080/07391102.2024.2303378 · Cited by 1
“On the other hand, Sp1 binds various G-quadruplex structures in important regulatory regions where it promotes DNA unwinding via the generation of negative superhelical stress (Lago et al., 2021).”
Kratochvilová, L., Vojsovič, M., Valková, N., Šislerová, L., Rashed, Z. E., Inga, A., Monti, P., & Brázda, V. (2023) · Bioscience Reports · doi:10.1042/bsr20231348 · Cited by 7
Kratochvilová, L., Vojsovič, M., Valková, N., Šislerová, L., Rashed, Z. E., Inga, A., Monti, P., & Brázda, V. (2023) · bioRxiv · doi:10.1101/2023.06.23.546269 · Cited by 1
The VEGF G-quadruplex forming promoter is repaired via long-patch BERPreprint
Hussen, A. S., Kravitz, H. L., Freudenthal, B., & Whitaker, A. M. (2023) · bioRxiv (Cold Spring Harbor Laboratory) · doi:10.1101/2023.06.25.546439
“Instead, G4s seem to fold under certain conditions such as upon specific stress stimuli, during certain stages of the cell cycle, in a cell type-specific manner, and/or upon interaction with proteins that bind and stabilize or resolve them (Biffi et al., 2013; Lago et al., 2021; Shu et al., 2022; Varshney et al., 2020…”
BackgroundInfluentialTsoi, H., Fung, N. N.-C., Man, E., Leung, M., You, C., Chan, W., Chan, S., & Khoo, U. (2023) · Cancers · doi:10.3390/cancers15082271 · Cited by 1
“The transcriptome is governed by transcription factors [47], alternative splicing [48], non-coding RNAs [49] and the epigenome [50].”
BackgroundG-quadruplex DNA structures mediate non-autonomous instruction of breast tumour microenvironmentsPreprint
Hunold, P., Hoehne, M. N., Kiljan, M., van Ray, O., Herter, J., Herter-Sprie, G., & Hänsel-Hertsch, R. (2023) · bioRxiv · doi:10.1101/2023.01.16.524243 · Cited by 1
Ruggiero, E., Lavezzo, E., Grazioli, M., Zanin, I., Marušič, M., Plavec, J., Richter, S., & Toppo, S. (2022) · Frontiers in Microbiology · doi:10.3389/fmicb.2022.915069 · Cited by 1
Self-citationStructure-driven effects on genomic DNA damage propensity at G-quadruplex sitesPreprint
Abdullah, A. A., Feng, C., Pflughaupt, P., & Sahakyan, A. B. (2021) · bioRxiv (Cold Spring Harbor Laboratory) · doi:10.1101/2021.12.02.471014 · Cited by 1
“G4s were found to be particularly influential (Figure 1D) at around the important regulatory loci in our genome, such as at promoter sites (21-24) of genes, marking the borders of UTRs (25) and introns (26), serving as important transcription factor binding hubs (27-30), important in human telomers (31-34), present at…”
BackgroundG-Quadruplexes at the ‘Interface’ of Transcription and Alternative Splicing
Rubtsov, P., Khomyakova, J., & Varizhuk, A. M. (2026) · Biomolecules · doi:10.3390/biom16111554
G-quadruplex structures affect the immune response to bacterial infection in mouse macrophages
Schult, P., Kastl, M. A., Szlapa, J., Symeonidis, K., Maasewerd, S., Franklin, B., Radcke, A., Juranek, S., Abdullah, Z., & Paeschke, K. (2026) · Nature Communications · doi:10.1038/s41467-026-78610-w
“5C), making EGR, MZF1 and SP1 the most likely candidates for such a mechanism, SP1 being the top candidate as it was already described as avid G4 binder 20,52 .”
Lyu, B., Gao, X.-Y., Anderson, D., Stanley, D., & Song, Q.-S. (2026) · Proceedings of the National Academy of Sciences of the United States of America · doi:10.1073/pnas.2612352123
Bartosik, A. R., Bujnowska, M., Stovall, D. B., Ratan, A., & Wang, Y. (2026) · Critical Reviews in Biochemistry and Molecular Biology · doi:10.1080/10409238.2026.2710103
“…nucleosome-free regions that are more accessible to the transcriptional machinery (Figure 2A), and genome-wide studies confirm that G4-induced chromatin opening correlates with higher transcriptional output (Du et al. 2008; Hänsel-Hertsch et al. 2016; Lago et al. 2021; Esnault et al. 2023; 2025).”
Abrahamsson, A., Khwaja, S., Chaudhari, N., Vertueux, S., Berner, A., Aasumets, K., Kumar, C., Stietz, L., Baladi, T., Dahlén, A., et al. (2026) · Molecular Therapy: Nucleic Acids · doi:10.1016/j.omtn.2026.103061
Xiang, L.-J., Li, J., Wu, B.-X., Yao, T.-T., Zhang, X.-J., Wu, K.-L., Zheng, M.-X., Feng, Q.-L., & Niu, K.-K. (2026) · BMC Biology · doi:10.1186/s12915-026-02696-3
“In particular, G4s tend to localize near transcription start sites (TSSs) of highly expressed genes [28], suggesting that G4 folding may serve as an epigenetic regulatory mechanism for gene transcription in a cell type-specific manner.”
G4 DNA structures induced by UV radiation: a multi-omic approach
Julio, L. R., Vejar, D. V. T., Walborsky, C., Salpukas, A., Chee, E., Murthy, J. C., MacLeod, S. G., Vandeuren, A. L., Ferguson, M., Muriph, R. E., et al. (2026) · bioRxiv · doi:10.64898/2026.07.15.738736
“G4 DNA structures are known to regulate transcription (16,17), DNA replication (18,19), and telomere maintenance (20,21).”
InfluentialExploration of multifunctional characteristics and regulatory mechanism of promoter G-quadruplexes
Zhao, Z., Zhang, Y., Tian, J., Su, Y., Lin, S., Chen, K., Zhu, L., & Xu, W. (2026) · Pharmacological Reviews · doi:10.1016/j.pharmr.2026.100151
Unraveling G‐Quadruplex and i‐Motif Coexistence Within a Double‐Stranded DNA
Auricchio, D., Ghezzo, M., Zavrtanik, U., Bertini, L., Libera, V., Rigo, R., Lah, J., & Sissi, C. (2026) · Angewandte Chemie International Edition · doi:10.1002/anie.3958607 · Cited by 1
Epigenetic mutations: Effects on the stability of G-quadruplex structures in the c-KIT promoter.
Passarelli, A., Alister, D., Porzio, A. D., Amato, J., Rosu, F., Gabélica, V., D'Aria, F., & Giancola, C. (2026) · International Journal of Biological Macromolecules · doi:10.1016/j.ijbiomac.2026.152767
In vivo dynamics of G-quadruplex DNA structures during liver regeneration in mice
Ishizuka, T., Aung, K. M., Lkham-Erdene, B., Yano, K., Kubota, T., Fidya, Shirouzu, S., Ikenoue, M., Kai, K., Oo, P. S., et al. (2026) · Scientific Reports · doi:10.1038/s41598-026-51144-3
Jha, A., Hristov, B. H., Wang, X., Wang, S., Greenleaf, W. J., Kundaje, A. B., Aiden, E. L., Bertero, A., & Noble, W. S. (2026) · Nature Communications · doi:10.1038/s41467-026-72031-5 · Cited by 1
“As higher coverage Hi-C experiments become more readily available, modeling interactions between chromosomes at fi ner resolution may reveal a fi ne-grained picture of trans nuclear regulation.”
Kumar, P., & Singh, U. (2026) · bioRxiv · doi:10.1007/s00239-026-10339-y
“Through these mechanisms, G-forming sequences serve as hubs of transcription factor binding and shape cell type specific transcriptomes (Lago et al. 2021; Spiegel et al. 2021).”
G-quadruplexes regulate chromatin accessibility and gene expression in Bloom SyndromePreprint
Su, D., Altmannová, V., Soltys, V., Peters, M. A., Cunniff, C. M., Weir, J. R., & Chan, Y. F. (2026) · bioRxiv (Cold Spring Harbor Laboratory) · doi:10.64898/2026.03.03.709275
“By contrast, G4 ChIP-seq or G4 CUT&Tag, which use an antibody–BG4–specifically targeting G4 structures, only identified 10,000 to 20,000 endogenous G4s in cells 26,44,47–49 .”
DNA topological regulation in RNA polymerase II transcription
Bunch, H. (2026) · Cellular & Molecular Biology Letters · doi:10.1186/s11658-026-00885-0 · Cited by 1
Fedorov, D. A., Gorbunov, A. M., Maksimov, E., Sidorenko, S. V., Varizhuk, A., Aralov, A., Kvitko, O. E., Petrushanko, I., Makarov, A., Lopina, O., et al. (2025) · bioRxiv · doi:10.1101/2025.10.30.685525
“Interestingly, the binding sites of AP-1 family transcription factors are enriched in G4-folded sequences [51], which may indicate a probable regulation of G4s dynamics near these sites by AP-1 binding.”
HTLV-1 antisense transcription is promoted by increased SP1 binding at 3’-LTR G-QuadruplexesPreprint
Ruggiero, E., Zanin, I., Tosoni, B., & Richter, S. N. (2025) · bioRxiv · doi:10.1101/2025.10.11.681801
“These results emphasize the critical influence of the cellular milieu on G4 dynamics and their functional consequences, and further confirm the role of G4s as chromatin marks to recruit transcriptional regulators (Spiegel et al , 2021; Lago et al , 2021).”
Self-citationYang, R., Chemistry, F. L. K. L. O. G., Technology of Ministry of Education, College of Chemistry Sichuan University, Chengdu, Sichuan, Medicine, P., National Clinical Research Center for Geriatrics, W. University, Chemistry, P., et al. (2025) · doi:10.48550/arxiv.2505.15035
“9 12 Nevertheless, of more than 4500 G4 ligands and 280 iM ligands documented by far, fewer than 3% exhibit selectivity to non-canonical over canonical structures.”
G-quadruplex profiling in complex tissues using single-cell CUT&TagPreprint
Lyu, J., Hetey, S., Castelo‐Branco, G., Bartošovič, M., & Elsässer, S. J. (2025) · bioRxiv (Cold Spring Harbor Laboratory) · doi:10.1101/2025.04.03.647101 · Cited by 2
“This supports recent findings that G4s are predominantly located at gene promoters of transcriptionally active genes, where they act predominantly as transcriptional enhancers (52) (53) (50) (54), rather than as roadblocks or repressors (55) (20).”
Is Silver a Precious Metal for G-Quadruplex Stabilization Mediated by Porphyrins?
Moura, N. M. M., Guedes, S. D. M., Salvador, D., Oliveira, H., Neves, M. G. P. M. S., & Ramos, C. I. V. (2024) · International Journal of Molecular Sciences · doi:10.3390/ijms252413556
“This cell line is usually used in studies related to skin diseases and cancer, due to its spontaneous immortality, which is associated with mutations in the p53 tumor-suppressor gene [64–66].”
Refael, T., Sudman, M., Golan, G., Pnueli, L., Naik, S., Noon, E. P., Henn, A., Kaplan, A., & Melamed, P. (2024) · Cellular and Molecular Life Sciences · doi:10.1007/s00018-024-05398-7 · Cited by 4
“Other various proteins, including epigenetic modifiers and tran - scription factors (TFs), and those at promoters are associated with high levels of transcription [13, 19–25].”
BackgroundMethod
Metadata
- Authors
- Lago, S., Nadai, M., Cernilogar, F. M., Kazerani, M., Domíniguez Moreno, H., Schotta, G., & Richter, S. N.
- Affiliations
- University of Padua (IT)
- Ludwig-Maximilians-Universität München (DE)
- Corresponding author
- Lago, Sara
- Schotta, Gunnar
- Richter, Sara N.
- Venue
- Nature Communications
- Published
- 2021-06-23
- Volume
- 12
- Issue
- 1
- Pages
- 3885-3885
- ISSN
- 2041-1723 (ISSN-L)
- PMC
- PMC8222265
- OpenAlex
- W3173676343
- Cited by
- 269
- References
- 97
- Citations by year
- 2026: 26 · 2025: 53 · 2024: 72 · 2023: 65 · 2022: 41 · 2021: 10
- FWCI
- 14.76
- Type
- journal article
- Language
- en
- Open access
- gold
- doi.org
- Locations
- Nature Communications (publishedVersion, cc-by)
- bioRxiv (Cold Spring Harbor Laboratory) (acceptedVersion, cc-by-nc)
- PubMed Central (publishedVersion, cc-by)
- PubMed (publishedVersion)
- RePEc: Research Papers in Economics (submittedVersion)
- DOAJ (DOAJ: Directory of Open Access Journals) (submittedVersion, cc-by-sa)
- Padua Research Archive (University of Padova) (submittedVersion, cc-by)
- Funders
- Deutsche Forschungsgemeinschaft (213249687, SFB1064, SFB1321, 329628492)
- Associazione Italiana per la Ricerca sul Cancro (21850)
- Fondazione Italiana per la Ricerca sul Cancro (21850)
- Topics
- Life Sciences › Biochemistry, Genetics and Molecular Biology › Molecular Biology › DNA and Nucleic Acid Chemistry
- Life Sciences › Biochemistry, Genetics and Molecular Biology › Molecular Biology › Genomics and Chromatin Dynamics
- Life Sciences › Biochemistry, Genetics and Molecular Biology › Molecular Biology › Epigenetics and DNA Methylation
- Keywords
- G-quadruplex, transcription factors, cell type-specific transcriptome, epigenetic regulation of transcription, AP-1, Sp1, keratinocytes, chromatin accessibility
- MeSH terms
- Base Sequence, Binding Sites, Cell Line, DNA, Humans, Nucleic Acid Conformation, Promoter Regions, Genetic, Protein Binding, Transcription Factors, Sp1 Transcription Factor, Transcription Factor AP-1, Gene Expression Profiling, Cell Line, Tumor, G-Quadruplexes, Transcriptome
About these checks
Registry, retraction, Cites and statistics results are computed, not judged, with one exception: a printed reference that no index lists is read once by a model before it counts as a citation error. Claims are extracted by a model and kept only when their quote appears verbatim in the text; each cited source is then checked, with a model’s help, for whether it says what the claim relies on. Those verdicts can be wrong — read the claim’s quote and the cited source before relying on one.
Statistics and arithmetic are recomputed, not judged.
Confidence bands are shown only for fields calibrated on our annotated test set. None is calibrated yet, so no band is shown.
What counts as a claim ›How we measure confidence ›How we check this ›
Are you an author, or do you see a problem with this page? Request a review
