

High-resolution characterization of gene function using single-cell CRISPR tiling screen
Open accessPublished version of a preprint
The DOI matches its Crossref record; 52 of the 52 references it cites were found in a registry or an index.
Abstract
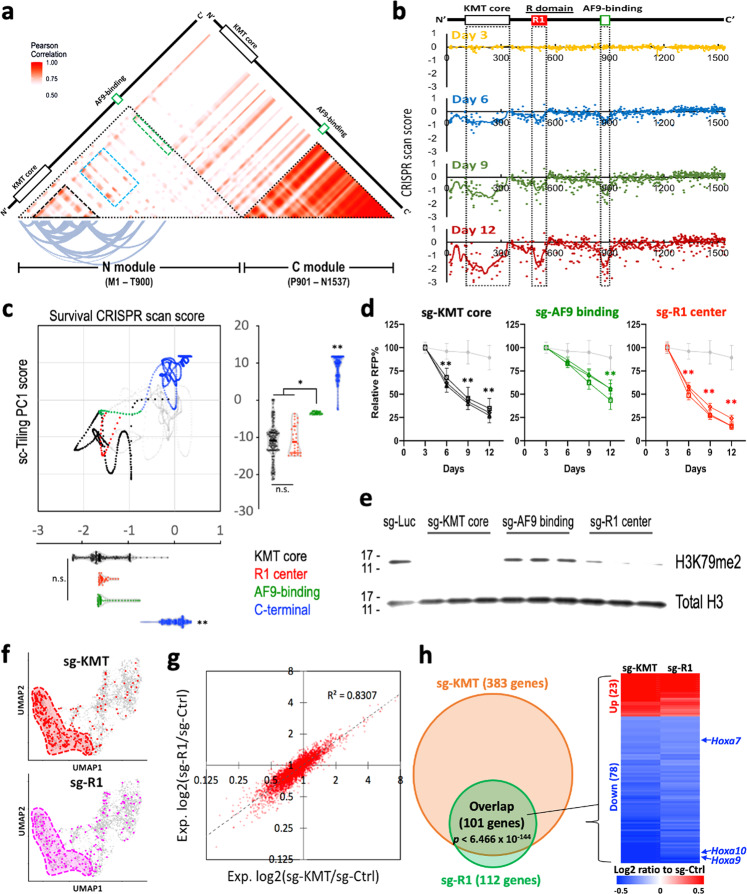
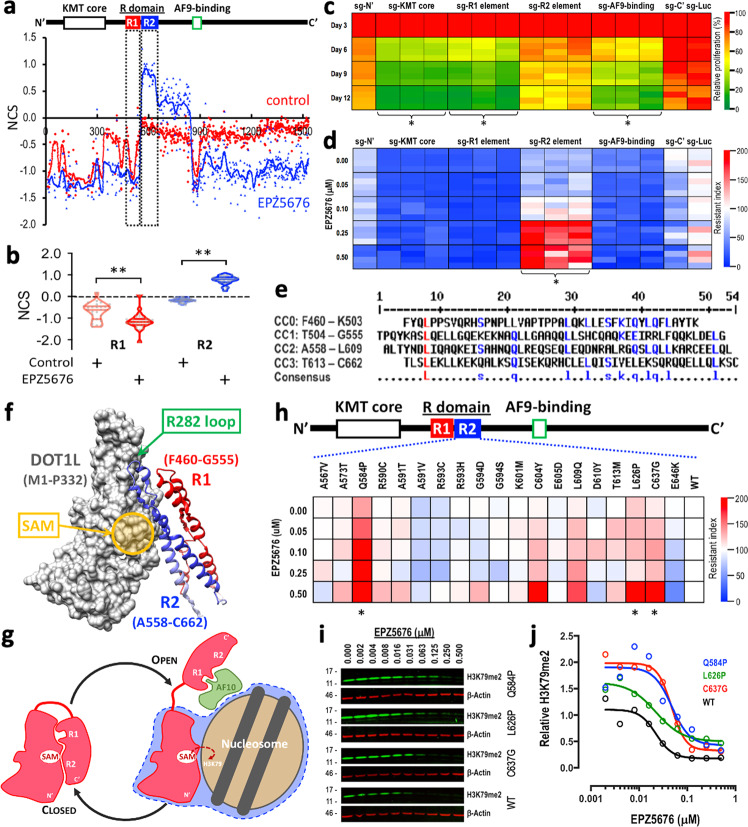
Identification of novel functional domains and characterization of detailed regulatory mechanisms in cancer-driving genes is critical for advanced cancer therapy. To date, CRISPR gene editing has primarily been applied to defining the role of individual genes. Recently, high-density mutagenesis via CRISPR tiling of gene-coding exons has been demonstrated to identify functional regions in genes. Furthermore, breakthroughs in combining CRISPR library screens with single-cell droplet RNA sequencing (sc-RNAseq) platforms have revealed the capacity to monitor gene expression changes upon genetic perturbations at single-cell resolution. Here, we present “sc-Tiling,” which integrates a CRISPR gene-tiling screen with single-cell transcriptomic and protein structural analyses. Distinct from other reported single-cell CRISPR screens focused on observing gene function and gene-to-gene/enhancer-to-gene regulation, sc-Tiling enables the capacity to identify regulatory mechanisms within a gene-coding region that dictate gene activity and therapeutic response.
Overview
The claims and statistics of this paper haven’t been checked yet.
Free: it reads the open-access text and checks the first 5 claims that cite a source we can check. Create a free account to check every claim.
Integrity signals
Registry
Cites
Statistics
Figures

Verification
Claims the paper makes
The claims and statistics of this paper haven’t been checked yet.
Free: it reads the open-access text and checks the first 5 claims that cite a source we can check. Create a free account to check every claim.
Claims other papers make about this one
Each is checked against this paper’s own text: does it say what the citing paper says it does?
In the citing paper
“sc-Tiling [18] is introduced as a technique to combine single-cell transcriptome and protein structure analysis with a CRISPR gene-tiling screen.”
From A mini-review on perturbation modelling across single-cell omic modalities (2024) · cites this paper as [18]
Self-check
Percentages, sums and reported differences re-computed from the paper’s own numbers.
The self-check needs the paper’s full text.
Citations
Cites
NIH Image to ImageJ: 25 years of image analysis
Schneider, C. A., Rasband, W. S., & Eliceiri, K. W. (2012) · Nature Methods · doi:10.1038/nmeth.2089 · Cited by 64,638
UCSF Chimera—A visualization system for exploratory research and analysis
Pettersen, E. F., Goddard, T. D., Huang, C. C., Couch, G. S., Greenblatt, D. M., Meng, E. C., & Ferrin, T. E. (2004) · Journal of Computational Chemistry · doi:10.1002/jcc.20084 · Cited by 45,828
Robinson, M. D., McCarthy, D. J., & Smyth, G. K. (2010) · Bioinformatics · doi:10.1093/bioinformatics/btp616 · Cited by 41,364
Ultrafast and memory-efficient alignment of short DNA sequences to the human genome.
Langmead, B., Trapnell, C., Pop, M., & Salzberg, S. L. (2009) · Genome Biology · doi:10.1186/gb-2009-10-3-r25 · Cited by 21,849
Integrative Analysis of Complex Cancer Genomics and Clinical Profiles Using the cBioPortal
Gao, J., Aksoy, B. A., Dogrusoz, U., Dresdner, G., Gross, B., Sumer, S. O., Sun, Y., Jacobsen, A., Sinha, R., Larsson, E., et al. (2013) · Science Signaling · doi:10.1126/scisignal.2004088 · Cited by 15,160
Integrating single-cell transcriptomic data across different conditions, technologies, and species
Butler, A., Hoffman, P., Smibert, P., Papalexi, E., & Satija, R. (2018) · Nature Biotechnology · doi:10.1038/nbt.4096 · Cited by 13,174
dbSNP: the NCBI database of genetic variation
Sherry, S. T. (2001) · Nucleic Acids Research · doi:10.1093/nar/29.1.308 · Cited by 7,502
Trapnell, C., Cacchiarelli, D., Grimsby, J., Pokharel, P., Li, S., Morse, M., Lennon, N. J., Livak, K. J., Mikkelsen, T. S., & Rinn, J. L. (2014) · Nature Biotechnology · doi:10.1038/nbt.2859 · Cited by 7,314
Self-citationThe I-TASSER Suite: protein structure and function prediction
Yang, J., Yan, R., Roy, A., Xu, D., Poisson, J., & Zhang, Y. (2015) · Nature Methods · doi:10.1038/nmeth.3213 · Cited by 5,596
Multiple sequence alignment with hierarchical clustering
Corpet, F. (1988) · Nucleic Acids Research · doi:10.1093/nar/16.22.10881 · Cited by 5,393
Cited by
Induced pluripotent stem cells (iPSCs): molecular mechanisms of induction and applications
Cerneckis, J., Cai, H., & Shi, Y. (2024) · Signal Transduction and Targeted Therapy · doi:10.1038/s41392-024-01809-0 · Cited by 452
Xue, M., Dong, L., Zhang, H., Li, Y., Qiu, K., Zhao, Z., Gao, M., Han, L., Chan, A., Li, W., et al. (2024) · Journal of Hematology & Oncology · doi:10.1186/s13045-024-01526-9 · Cited by 99
Self-citationDiverse Roles of Protein Palmitoylation in Cancer Progression, Immunity, Stemness, and Beyond
Li, M., Zhang, L., & Chen, C.-W. D. (2023) · Cells · doi:10.3390/cells12182209 · Cited by 83
Self-citationGold, S. R., & Shilatifard, A. (2024) · Journal of Clinical Investigation · doi:10.1172/jci183391 · Cited by 69
A mini-review on perturbation modelling across single-cell omic modalities
Gavriilidis, G. I., Vasileiou, V., Orfanou, A., Ishaque, N., & Psomopoulos, F. (2024) · Computational and Structural Biotechnology Journal · doi:10.1016/j.csbj.2024.04.058 · Cited by 54
Metadata
- Authors
- Yang, L., Chan, A. K. N., Miyashita, K., Delaney, C. D., Wang, X., Li, H., Pokharel, S. P., Li, S., Li, M., Xu, X., Lu, W., Liu, Q., Mattson, N., Chen, K. Y., Wang, J., Yuan, Y.-C., Horne, D., Rosen, S. T., Soto-Feliciano, Y., Feng, Z., Hoshii, T., Xiao, G., Müschen, M., Chen, J., Armstrong, S. A., & Chen, C.-W.
- Affiliations
- City Of Hope National Medical Center (US)
- Harvard University (US)
- Corresponding author
- Armstrong, Scott A.
- Chen, Chun-Wei
- ORCID
- Venue
- Nature Communications
- Published
- 2021-07-01
- Volume
- 12
- Issue
- 1
- Pages
- 4063-4063
- ISSN
- 2041-1723 (ISSN-L)
- PMC
- PMC8249386
- OpenAlex
- W3118373840
- Cited by
- 45
- References
- 52
- Citations by year
- 2026: 5 · 2025: 9 · 2024: 12 · 2023: 9 · 2022: 9 · 2021: 1
- FWCI
- 2.43
- Type
- journal article
- Language
- en
- Open access
- gold
- doi.org
- Licence
- cc-by
- creativecommons.org/licenses/by/4.0 (tdm)
- creativecommons.org/licenses/by/4.0 (vor)
- Locations
- Nature Communications (publishedVersion, cc-by)
- Research Square (acceptedVersion, cc-by)
- PubMed Central (publishedVersion, cc-by)
- PubMed (publishedVersion)
- RePEc: Research Papers in Economics (submittedVersion)
- DOAJ (DOAJ: Directory of Open Access Journals) (submittedVersion, cc-by-sa)
- Funders
- U.S. Department of Health & Human Services | NIH | National Cancer Institute (CA197498, CA233691, CA236626)
- American Society of Hematology (ASH Scholar)
- Alex’s Lemonade Stand Foundation for Childhood Cancer (ALSF Innovation)
- Topics
- Life Sciences › Biochemistry, Genetics and Molecular Biology › Molecular Biology › CRISPR and Genetic Engineering
- Life Sciences › Biochemistry, Genetics and Molecular Biology › Molecular Biology › Chromatin Remodeling and Cancer
- Life Sciences › Biochemistry, Genetics and Molecular Biology › Molecular Biology › Single-cell and spatial transcriptomics
- Keywords
- single-cell transcriptomics, gene function, functional domains, gene expression regulation, protein structure, treatment response
- MeSH terms
- Gene Editing, Drug Screening Assays, Antitumor, Genetic Testing, Histones, Humans, Models, Molecular, Neoplasms, Phenotype, Histone-Lysine N-Methyltransferase, Genome, Human, Gene Expression Regulation, Neoplastic, Mutagenesis, Transcriptome, Clustered Regularly Interspaced Short Palindromic Repeats, CRISPR-Cas Systems
About these checks
Registry, retraction, Cites and statistics results are computed, not judged, with one exception: a printed reference that no index lists is read once by a model before it counts as a citation error. Claims are extracted by a model and kept only when their quote appears verbatim in the text; each cited source is then checked, with a model’s help, for whether it says what the claim relies on. Those verdicts can be wrong — read the claim’s quote and the cited source before relying on one.
Statistics and arithmetic are recomputed, not judged.
Confidence bands are shown only for fields calibrated on our annotated test set. None is calibrated yet, so no band is shown.
What counts as a claim ›How we measure confidence ›How we check this ›
Are you an author, or do you see a problem with this page? Request a review
How to cite
Cite CoChat for the checks on this page, and the paper for its own findings.
- This page
- CoChat. (2026). Citation check: High-resolution characterization of gene function using single-cell CRISPR tiling screen. https://app.cochat.ai/papers/10.1038/s41467-021-24324-0
- The paper
- Yang, L., Chan, A. K. N., Miyashita, K., Delaney, C. D., Wang, X., Li, H., Pokharel, S. P., Li, S., Li, M., Xu, X., Lu, W., Liu, Q., Mattson, N., Chen, K. Y., Wang, J., Yuan, Y.-C., Horne, D., Rosen, S. T., Soto-Feliciano, Y., . . . Chen, C.-W. (2021). High-resolution characterization of gene function using single-cell CRISPR tiling screen. Nature Communications. https://doi.org/10.1038/s41467-021-24324-0
Data sources
Bibliographic data: Semantic Scholar, OpenAlex, Crossref.
Contains information from the Semantic Scholar Academic Graph Datasets, made available under the ODC Attribution License (ODC-BY 1.0).
Semantic Scholar’s data is described in: Kinney, R., et al. (2023). The Semantic Scholar Open Data Platform. arXiv:2301.10140.
