

The DOI matches its Crossref record; 38 of the 38 references it cites were found in a registry or an index; 21 of the 24 sources its claims cite were checked for support.
Health impacts of wildfire-related air pollution in Brazil: a nationwide study of more than 2 million hospital admissions between 2008 and 2018
Open accessAbstract
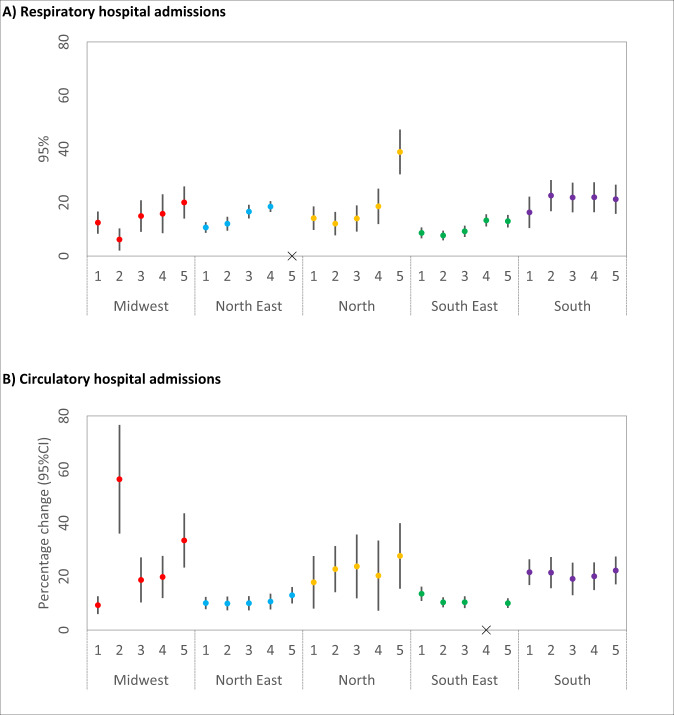
We quantified the impacts of wildfire-related PM 2.5 on 2 million hospital admissions records due to cardiorespiratory diseases in Brazil between 2008 and 2018. The national analysis shows that wildfire waves are associated with an increase of 23% (95%CI: 12%–33%) in respiratory hospital admissions and an increase of 21% (95%CI: 8%–35%) in circulatory hospital admissions. In the North (where most of the Amazon region is located), we estimate an increase of 38% (95%CI: 30%–47%) in respiratory hospital admissions and 27% (95%CI: 15%–39%) in circulatory hospital admissions. Here we report epidemiological evidence that air pollution emitted by wildfires is significantly associated with a higher risk of cardiorespiratory hospital admissions.
Overview
AI snapshot
Written from the paper’s full text.
TL;DR
This nationwide Brazilian study found that wildfire-related PM2.5 during wildfire waves was associated with higher cardiorespiratory hospital admissions from 2008 to 2018. The strongest national associations were a 23% increase in respiratory admissions and a 21% increase in circulatory admissions.
Key findings
- Across Brazil, wildfire waves were associated with a 23% increase in respiratory hospital admissions (95% CI: 12–33%) at a 5-day moving average and a 21% increase in circulatory hospital admissions (95% CI: 8–35%) at a 2-day moving average.
- In the North region, where most of the Amazon is located, the estimated increases were 38% for respiratory admissions (95% CI: 30–47%) and 27% for circulatory admissions (95% CI: 15–39%).
- Regional heterogeneity was substantial: the Midwest had a 20% increase in respiratory admissions (95% CI: 13–26%) at 5 days and a 56% increase in circulatory admissions (95% CI: 36–76%) at 2 days.
- The study included 2,044,038 cardiorespiratory hospital admissions; 50.2% were respiratory and 49.8% circulatory.
Methods
- Time-stratified case-crossover design using conditional logistic regression, comparing exposure on hospital admission days with control days matched by day of week, month, and calendar year.
- Data covered 2,044,038 hospital admissions for respiratory (ICD-10 J00–J99) and circulatory (ICD-10 I00–I99) diseases in Brazil from 2008 to 2018, with wildfire records from INPE and PM2.5, other pollutants, and weather from ECMWF/CAMS ensemble models.
- “Wildfire wave” was defined as any day when wildfire records and PM2.5 concentration exceeded the 99th percentile of the 2008–2018 regional time series; region-specific odds ratios were meta-analyzed with random effects to estimate national averages.
Limitations
- The authors state that care-seeking behavior likely led to underestimation of cases, that the fixed annual definition of wildfire waves may cause misclassification, that predicted air pollution and meteorological variables may introduce exposure measurement error, and that hospital admission forms may contain errors.
- The text also makes evident that some subgroup analyses by region, sex, and age had very large groups of ties and could not be computed because the Survival package algorithm may fail due to overflow.
- The authors note that regional heterogeneity may reflect cultural, social, behavioral, environmental, and healthcare-access differences, including unequal distribution of health facilities across Brazil.
Model-written summary. Check it against the paper before relying on it.
Integrity signals
Registry
Cites
Statistics
Figures
Verification
Claims the paper makes
22 Own result · 14 Own method · 9 Partly supported · 5 Supported · 2 No full text of the sources · 2 Own interpretation · 2 No basis given · 1 Supported so far · accuracy not yet measured
The cited sources support only part of this claim — read each source’s verdict below.
In the paper
“In Brazil, the reduction of wildfire-related particulate emissions by 30% indicates a health improvement by preventing about 400 to 1700 premature adult deaths annually8.”
§ Health impacts of wildfire-related air pollution in Brazil: a nationwide study of more than 2 million hospital admissions between 2008 and 2018 > Introduction
What the sources say
- Partly supportedcites [8] Reddington, C. L. et al. Air quality and human health improvements from reductions in deforestation-related fire in Brazil. Nat. Geosci. 8, 768–771, https://doi.org/10.1038/ngeo2535 (2015). sourceExperimental — accuracy not yet measured
The paper reports that a 40% reduction in Brazil’s deforestation rates is estimated to prevent 1,060 premature adult deaths annually across South America, with a 95% confidence interval of 388–1,721 (Abstract; page not provided). Its 30% figure refers to lower dry-season PM2.5 concentrations in low-deforestation years, not a 30% reduction in particulate emissions; the mortality estimate is also for South America, not Brazil alone. (LLM, conf=0.90)
hedgeddirect- Asserted: passes — The authors put it forward as true.
- Checkable: passes — It can be checked against evidence.
- Load-bearing: unclear — It is unclear whether the paper’s conclusions depend on it.
- Based: passes — The paper gives a reason why it holds.
- Partly supported
The cited sources support only part of this claim — read each source’s verdict below.
In the paper
“where there is a considerable difference in the quality of health/environment and healthcare across different populations (influencing health/environment equity in negative ways), which is an important determinant of the health impacts of wildfire-related air pollution20”
§ Health impacts of wildfire-related air pollution in Brazil: a nationwide study of more than 2 million hospital admissions between 2008 and 2018 > Introduction
What the sources say
- Partly supportedcites [20] Rappold, A. G. et al. Cardio-respiratory outcomes associated with exposure to wildfire smoke are modified by measures of community health. Environ. Heal 11, 71, https://doi.org/10.1186/1476-069X-11-71 (2012). sourceExperimental — accuracy not yet measured
The Background and Discussion say community health and socioeconomic conditions can modify health risks from wildfire-smoke exposure. But the Methods place the study in North Carolina, not Brazil, and the Discussion says access and quality of care were not observed to determine susceptibility at the community level. (LLM, conf=0.87)
plaindirect- Asserted: passes — The authors put it forward as true.
- Checkable: passes — It can be checked against evidence.
- Load-bearing: unclear — It is unclear whether the paper’s conclusions depend on it.
- Based: passes — The paper gives a reason why it holds.
- Partly supported
The cited sources support only part of this claim — read each source’s verdict below.
In the paper
“However, we highlight that in our study we were interested in temporal changes of air pollution (daily variation), and therefore, European Centre for Medium-Range Weather Forecasts (ECMWF) seems to be a reliable source of providing such data as shown by the validation studies mentioned in the “Methods” section.”
§ Health impacts of wildfire-related air pollution in Brazil: a nationwide study of more than 2 million hospital admissions between 2008 and 2018 > Discussion
What the sources say
- Partly supportedcites Inness et al. [36] Inness A., et al. 2018. The CAMS reanalysis of atmospheric composition. Atmos. Chem. Phys. Discuss. 1–55; https://doi.org/10.5194/acp-2018-1078 (2019). sourceExperimental — accuracy not yet measured
The paper’s Abstract describes ECMWF’s CAMS reanalysis as time-consistent atmospheric-composition data with hourly surface forecast fields, and its Nitrogen dioxide section reports validation against observations at European stations. That validation says the reanalyses reproduce observed mean values and seasonal variability well, but it does not establish reliability specifically for day-to-day changes in air pollution. (LLM, conf=0.84)
hedged- Asserted: passes — The authors put it forward as true.
- Checkable: passes — It can be checked against evidence.
- Load-bearing: passes — The paper’s conclusions depend on it.
- Based: passes — The paper gives a reason why it holds.
- Partly supported
The cited sources support only part of this claim — read each source’s verdict below.
In the paper
“Other studies have shown that AERONET observation sites in South America has significant representativity for AOD measured by MODIS, aboard TERRA and AQUA satellites38.”
§ Health impacts of wildfire-related air pollution in Brazil: a nationwide study of more than 2 million hospital admissions between 2008 and 2018 > Methods > Exposure data
What the sources say
- Partly supportedcites [38] Hoelzemann, J. J. et al. Regional representative of AERONET observation sites during the biomass burning season in South America determined by correlation studies with MODIS Aerosol Optical Depth. J. Geophys. Res. Atmos. 114, 1–20, https://doi.org/10.1029/2008JD010369 (2009). sourceExperimental — accuracy not yet measured
Section 5.3 reports moderate to strong correlations between AERONET and MODIS AOD for most studied sites and concludes that AERONET observations characterize a significant area of South America. The citing sentence omits the study’s biomass-burning-season focus and generalizes to AERONET sites in South America, although Section 5.3 excludes three sites from the regional analysis because their data were insufficient. (LLM, conf=0.85)
plaincorrelational- Asserted: passes — The authors put it forward as true.
- Checkable: passes — It can be checked against evidence.
- Load-bearing: unclear — It is unclear whether the paper’s conclusions depend on it.
- Based: passes — The paper gives a reason why it holds.
- Partly supported
The cited sources support only part of this claim — read each source’s verdict below.
In the paper
“A portion of the regional heterogeneity of the impact of wildfire PM2.5 exposure indicated by our results can be explained by the cultural, social, behavioral, and environmental/geographical conditions10,20,24.”
§ Health impacts of wildfire-related air pollution in Brazil: a nationwide study of more than 2 million hospital admissions between 2008 and 2018 > Discussion
What the sources say
- Partly supportedcites [10] Reid, C. E. et al. Health impacts of wildfire smoke. Environ. Health Perspect. 124, 1334–1343 (2016b). sourceExperimental — accuracy not yet measured
The Results (Vulnerable Populations; page unavailable) describe differences associated with socioeconomic status and ethnicity, while the Discussion says that different fire types could produce different health effects because of smoke composition. The review does not establish that cultural or behavioral conditions explain regional heterogeneity, and it presents the fire-type explanation as a possibility rather than a demonstrated cause. (LLM, conf=0.82)
- Partly supportedcites [20] Rappold, A. G. et al. Cardio-respiratory outcomes associated with exposure to wildfire smoke are modified by measures of community health. Environ. Heal 11, 71, https://doi.org/10.1186/1476-069X-11-71 (2012). sourceExperimental — accuracy not yet measured
The Results report that wildfire-smoke PM2.5 risks differed between North Carolina counties grouped by socioeconomic and physical-environment measures, and the Discussion identifies socioeconomic factors as the strongest modifiers. This supports a role for social and environmental conditions in differing impacts, but the paper does not establish cultural or geographical conditions as explanations; its Discussion also cautions that county-level associations cannot establish individual-level causes. Page numbers are unavailable in our copy. (LLM, conf=0.86)
- Partly supportedcites [24] Reid, C. E. et al. Critical review of health impacts of wildfire smoke exposure. Environ. Health Perspect. 124, 1334–1343, https://doi.org/10.1289/ehp.1409277 (2016a). sourceExperimental — accuracy not yet measured
The Results (Vulnerable Populations; page unavailable) report differences in wildfire-smoke effects by socioeconomic status and suggest that social characteristics may help explain differences between population groups. The Discussion (page unavailable) says different types of fires could produce different health effects because smoke constituents vary. The review does not establish that cultural or behavioral conditions explain regional heterogeneity in wildfire PM2.5 impacts, and it presents the environmental explanation as a possibility rather than a demonstrated cause. (LLM, conf=0.84)
plainconditional- Asserted: passes — The authors put it forward as true.
- Checkable: passes — It can be checked against evidence.
- Load-bearing: unclear — It is unclear whether the paper’s conclusions depend on it.
- Based: passes — The paper gives a reason why it holds.
- Partly supported
The cited sources support only part of this claim — read each source’s verdict below.
In the paper
“Specifically, for the PM2.5, the exposure variable in our study, it is evaluated with ground observations of the Aerosol Robotic Network (AERONET).”
§ Health impacts of wildfire-related air pollution in Brazil: a nationwide study of more than 2 million hospital admissions between 2008 and 2018 > Methods > Exposure data
What the sources say
- Partly supportedcites Inness et al. [36] Inness A., et al. 2018. The CAMS reanalysis of atmospheric composition. Atmos. Chem. Phys. Discuss. 1–55; https://doi.org/10.5194/acp-2018-1078 (2019). sourceExperimental — accuracy not yet measured
The Aerosols section says CAMS reanalysis AOD at 550 nm was evaluated against ground-based AERONET observations. It does not say that PM2.5 concentrations were evaluated against AERONET; the cited evaluation concerns a different aerosol measure. Page numbers were not available in our copy. (LLM, conf=0.88)
plain- Asserted: passes — The authors put it forward as true.
- Checkable: passes — It can be checked against evidence.
- Load-bearing: unclear — It is unclear whether the paper’s conclusions depend on it.
- Based: passes — The paper gives a reason why it holds.
- Partly supported
The cited sources support only part of this claim — read each source’s verdict below.
In the paper
“As discussed in the “Introduction,” review studies of the health impacts of wildfire exposure report consistent evidence on the associations between wildfire exposure and cardiorespiratory health effects10,39.”
§ Health impacts of wildfire-related air pollution in Brazil: a nationwide study of more than 2 million hospital admissions between 2008 and 2018 > Methods > Health and population data
What the sources say
- Partly supportedcites [10] Reid, C. E. et al. Health impacts of wildfire smoke. Environ. Health Perspect. 124, 1334–1343 (2016b). sourceExperimental — accuracy not yet measured
The Discussion reports consistent associations between wildfire smoke exposure and respiratory morbidity, including asthma and COPD exacerbations. But it calls the evidence for cardiovascular morbidity mixed, so the claim overstates the consistency of evidence for cardiorespiratory effects as a whole. (LLM, conf=0.90)
- Supportedcites [39] Youssouf, H. et al. Non-accidental health impacts of wildfire smoke. Int J. Environ. Res. Public Health 11, 11772–11804, https://doi.org/10.3390/ijerph111111772 (2014). source
The Conclusions report that cardiorespiratory effects are the main health effects of wildfire smoke and that most studies observed associations with increased hospital admissions and emergency visits for respiratory and cardiovascular diseases. The Discussion cautions that evidence on cardiovascular disease and mortality is insufficient for general conclusions, but the citing sentence does not specifically claim consistent evidence for mortality. (LLM, conf=0.90)
plaincorrelational- Asserted: passes — The authors put it forward as true.
- Checkable: passes — It can be checked against evidence.
- Load-bearing: passes — The paper’s conclusions depend on it.
- Based: passes — The paper gives a reason why it holds.
- Partly supported
A result the paper reports from its own data — it cites no other source for it, so there is none to check. The quote shows it is in the paper.
In the paper
“and an increase of 21% (95%CI: 8%–35%) in circulatory hospital admissions”
- Also stated in: § Association between wildfire PM2.5 and hospital admissions · hedged
“For circulatory diseases, the highest risk occurred when we accounted for 2 days moving average, with an estimated increase of 21% (95% CI: 8–35%) in circulatory hospital admissions (Table 3).”
§ Health impacts of wildfire-related air pollution in Brazil: a nationwide study of more than 2 million hospital admissions between 2008 and 2018 > Abstract
plaincorrelational- Asserted: passes — The authors put it forward as true.
- Checkable: passes — It can be checked against evidence.
- Load-bearing: passes — The paper’s conclusions depend on it.
- Based: passes — The paper gives a reason why it holds.
- Rests on an assumption: Fine particulate matter (PM2.5) is the major pollutant emitted by wildfires.
- Also stated in: § Association between wildfire PM2.5 and hospital admissions · hedged
A result the paper reports from its own data — it cites no other source for it, so there is none to check. The quote shows it is in the paper.
In the paper
“In the North (where most of the Amazon region is located), we estimate an increase of 38% (95%CI: 30%–47%) in respiratory hospital admissions”
- Also stated in: § Discussion · hedged
“In the primary analysis, North was identified as the region with the highest risk of hospital admissions due to respiratory diseases, with an estimated increase of 38% (95% CI: 30–47%) in hospital admissions at a moving average of 5 days.”
§ Health impacts of wildfire-related air pollution in Brazil: a nationwide study of more than 2 million hospital admissions between 2008 and 2018 > Abstract
hedgedcorrelational- Asserted: passes — The authors put it forward as true.
- Checkable: passes — It can be checked against evidence.
- Load-bearing: passes — The paper’s conclusions depend on it.
- Based: passes — The paper gives a reason why it holds.
- Rests on an assumption: Fine particulate matter (PM2.5) is the major pollutant emitted by wildfires.
- Also stated in: § Discussion · hedged
A result the paper reports from its own data — it cites no other source for it, so there is none to check. The quote shows it is in the paper.
In the paper
“and 27% (95%CI: 15%–39%) in circulatory hospital admissions”
§ Health impacts of wildfire-related air pollution in Brazil: a nationwide study of more than 2 million hospital admissions between 2008 and 2018 > Abstract
plaincorrelational- Asserted: passes — The authors put it forward as true.
- Checkable: passes — It can be checked against evidence.
- Load-bearing: passes — The paper’s conclusions depend on it.
- Based: passes — The paper gives a reason why it holds.
- Rests on an assumption: Fine particulate matter (PM2.5) is the major pollutant emitted by wildfires.
- Probably not a substantial claim. 15
- It may state two separate claims as one. 12
Every source the paper cites for this claim was checked and supports it.
In the paper
“About 12–16% of global wildfire-related particulate emissions occur across Brazil8.”
§ Health impacts of wildfire-related air pollution in Brazil: a nationwide study of more than 2 million hospital admissions between 2008 and 2018 > Introduction
What the sources say
- Supportedcites [8] Reddington, C. L. et al. Air quality and human health improvements from reductions in deforestation-related fire in Brazil. Nat. Geosci. 8, 768–771, https://doi.org/10.1038/ngeo2535 (2015). source
The passage beginning “We used three different datasets” (labelled Abstract in our copy) states that fire emissions across Brazil account for 12–16% of global particulate emissions from fire. This directly supports the cited percentage and location. (LLM, conf=0.95)
plain- Asserted: passes — The authors put it forward as true.
- Checkable: passes — It can be checked against evidence.
- Load-bearing: fails — The paper’s conclusions may not depend on it.
- Based: passes — The paper gives a reason why it holds.
Probably not a substantial claim. The paper’s conclusions may not depend on it.
- Supported
Every source the paper cites for this claim was checked and supports it.
In the paper
“Regarding the health impacts of wildfire smoke exposure, a critical review of 53 epidemiological studies10 shows that wildfire exposure is associated with respiratory diseases and growing evidence suggests associations for specific cardiovascular endpoints.”
§ Health impacts of wildfire-related air pollution in Brazil: a nationwide study of more than 2 million hospital admissions between 2008 and 2018 > Introduction
What the sources say
- Supportedcites [10] Reid, C. E. et al. Health impacts of wildfire smoke. Environ. Health Perspect. 124, 1334–1343 (2016b). source
The Results section states that the review examined 53 epidemiological papers. The Discussion reports consistent associations with respiratory morbidity; the Abstract Discussion says cardiovascular evidence is mixed but a few recent studies report associations for specific cardiovascular end points. The claim's tentative wording is consistent with that qualification. (LLM, conf=0.88)
hedgedcorrelational- Asserted: passes — The authors put it forward as true.
- Checkable: passes — It can be checked against evidence.
- Load-bearing: fails — The paper’s conclusions may not depend on it.
- Based: passes — The paper gives a reason why it holds.
Probably not a substantial claim. The paper’s conclusions may not depend on it. It may state two separate claims as one.
- Supported
Every source the paper cites for this claim was checked and supports it.
In the paper
“Liu et al.11 estimated a 7.2% increase in risk for respiratory admissions during smoke wave days with high wildfire-specific PM2.5 during 2004 and 2009 in the Western United States.”
§ Health impacts of wildfire-related air pollution in Brazil: a nationwide study of more than 2 million hospital admissions between 2008 and 2018 > Introduction
What the sources say
- Supportedcites [11] Liu, J. C. et al. Wildfire-specific fine particulate matter and risk of hospital admissions in urban and rural counties. Epidemiology 28, 77–85, https://doi.org/10.1097/EDE.0000000000000556 (2017). source
The Abstract Results report a 7.2% increase in respiratory-admission risk on high-intensity smoke-wave days compared with matched non-smoke-wave days. The Abstract Methods place the study in the Western US over 2004–2009; the study population for admissions was Medicare enrollees. The claim’s wording appears to refer to that period. (LLM, conf=0.92)
hedgedcorrelational- Asserted: passes — The authors put it forward as true.
- Checkable: passes — It can be checked against evidence.
- Load-bearing: fails — The paper’s conclusions may not depend on it.
- Based: passes — The paper gives a reason why it holds.
Probably not a substantial claim. The paper’s conclusions may not depend on it.
- Supported
Every source the paper cites for this claim was checked and supports it.
In the paper
“We found only four studies8,16–18 and three of them focused only on the Amazon region.”
§ Health impacts of wildfire-related air pollution in Brazil: a nationwide study of more than 2 million hospital admissions between 2008 and 2018 > Introduction
What the sources say
- Supportedcites [8] Reddington, C. L. et al. Air quality and human health improvements from reductions in deforestation-related fire in Brazil. Nat. Geosci. 8, 768–771, https://doi.org/10.1038/ngeo2535 (2015). source
The paper identifies itself as a study of fire-related PM2.5 exposure and health effects in Brazil and South America. Its Abstract (page unavailable) states that most estimated premature deaths occur outside Amazonia, supporting its inclusion as a study not confined to that region. The count of four studies is the citing authors’ own search result, not a finding attributed to this individual paper. (LLM, conf=0.88)
- Supportedcites [16] Do Carmo, C. N. et al. Association between particulate matter from biomass burning and respiratory diseases in the southern region of the Brazilian Amazon. Rev. Panam. Salud Public. 27, 10–16, https://doi.org/10.1590/s1020-49892010000100002 (2010). source
This is an identification citation: the cited paper is a study of particulate pollution from biomass burning and respiratory health in the Brazilian Amazon. Its Objective and Methods sections establish that focus. The count of four studies is the citing authors’ search result, not a finding attributed to this individual paper. (LLM, conf=0.92)
- Supportedcites [17] Ignotti, E. et al. Impact on human health of particulate matter emitted from burnings in the Brazilian Amazon region. Rev. Saúde. Pública 44, 121–130 (2010b). source
This citation identifies one of the studies the citing authors found; it does not attribute their four-study search count to Ignotti et al. The Introduction identifies the paper's objective as studying health effects of biomass-burning particulate matter in the Brazilian Amazon region, supporting its inclusion among the Amazon-focused studies. (LLM, conf=0.92)
- Supportedcites [18] Jacobson L. S. V., et al. 2014. Acute effects of particulate matter and black carbon from seasonal fires on peak expiratory flow of schoolchildren in the Brazilian Amazon. PLoS ONE 9, https://doi.org/10.1371/journal.pone.0104177 (2014). source
The Introduction identifies this paper as a panel study in Tangará da Serra in the Brazilian Amazon, and the Discussion describes its findings on air pollution from biomass burning and schoolchildren’s respiratory health. It therefore supports its use as one of the studies the citing authors found; their count of four is their own search result, not a finding attributed to this paper. (LLM, conf=0.90)
plain- Asserted: passes — The authors put it forward as true.
- Checkable: passes — It can be checked against evidence.
- Load-bearing: passes — The paper’s conclusions depend on it.
- Based: passes — The paper gives a reason why it holds.
It may state two separate claims as one.
- Supported
The sources with a verdict support this claim; the rest weren’t checked yet, have no full text we could read, or their verdicts aren’t rated yet.
In the paper
“The concept of wildfire wave defined in our study is similar to the concepts of extreme air pollution events from wildfires defined in previous studies11,15.”
§ Health impacts of wildfire-related air pollution in Brazil: a nationwide study of more than 2 million hospital admissions between 2008 and 2018 > Methods > Exposure data
What the sources say
- Supportedcites [11] Liu, J. C. et al. Wildfire-specific fine particulate matter and risk of hospital admissions in urban and rural counties. Epidemiology 28, 77–85, https://doi.org/10.1097/EDE.0000000000000556 (2017). source
The Methods section (‘Definition of a Smoke Wave’) defines a smoke wave as at least two consecutive days above a wildfire-specific PM2.5 threshold. It explicitly describes the concept as capturing short-lived periods of high wildfire pollution, supporting the citing paper’s comparison to its wildfire-wave concept. (LLM, conf=0.91)
- Not checked — no full text of the sourcecites [15] Johnston, F., Hanigan, I., Henderson, S., Morgan, G. & Bowman, D. Extreme air pollution events from bushfires and dust storms and their association with mortality in Sydney, Australia 1994-2007. Environ. Res 111, 811–816, https://doi.org/10.1016/j.envres.2011.05.007 (2011). source
plain- Asserted: passes — The authors put it forward as true.
- Checkable: passes — It can be checked against evidence.
- Load-bearing: fails — The paper’s conclusions may not depend on it.
- Based: passes — The paper gives a reason why it holds.
Probably not a substantial claim. The paper’s conclusions may not depend on it.
- Supported
The cited sources support only part of this claim — read each source’s verdict below.
In the paper
“In South America, the data from satellite’s instruments are slightly smaller, with an approximate bias of −0.006 ± 0.128.”
§ Health impacts of wildfire-related air pollution in Brazil: a nationwide study of more than 2 million hospital admissions between 2008 and 2018 > Methods > Exposure data
What the sources say
- Partly supportedcites Inness et al. [36] Inness A., et al. 2018. The CAMS reanalysis of atmospheric composition. Atmos. Chem. Phys. Discuss. 1–55; https://doi.org/10.5194/acp-2018-1078 (2019). sourceExperimental — accuracy not yet measured
The Aerosols section and Figure 22 caption show that the paper compares reanalysis aerosol optical depth with AERONET observations in South America. The passages available from our copy do not give the South American bias of −0.006 ± 0.128; they also describe reanalysis output, not a direct bias of satellite-instrument data. Searches for the value and the South America entry of Table 8 did not resolve those points. (LLM, conf=0.78)
plain- Asserted: passes — The authors put it forward as true.
- Checkable: passes — It can be checked against evidence.
- Load-bearing: fails — The paper’s conclusions may not depend on it.
- Based: passes — The paper gives a reason why it holds.
Probably not a substantial claim. The paper’s conclusions may not depend on it.
- Partly supported
Every source the paper cites for this claim was checked and supports it.
In the paper
“The validation for the CAMS global model is reported by Inness et al.36.”
§ Health impacts of wildfire-related air pollution in Brazil: a nationwide study of more than 2 million hospital admissions between 2008 and 2018 > Methods > Exposure data
What the sources say
- Supportedcites Inness et al. [36] Inness A., et al. 2018. The CAMS reanalysis of atmospheric composition. Atmos. Chem. Phys. Discuss. 1–55; https://doi.org/10.5194/acp-2018-1078 (2019). source
The Introduction says the paper presents initial validation results for the CAMS reanalysis and that Section 4 gives validation results for reactive gases and aerosols. The Results section confirms that CAMS reanalysis fields are compared with other reanalyses and validation data. The paper therefore reports validation of the CAMS model as used for this reanalysis, though it does not claim to provide a comprehensive validation. (LLM, conf=0.88)
plain- Asserted: passes — The authors put it forward as true.
- Checkable: passes — It can be checked against evidence.
- Load-bearing: fails — The paper’s conclusions may not depend on it.
- Based: passes — The paper gives a reason why it holds.
Probably not a substantial claim. The paper’s conclusions may not depend on it.
- Supported
The cited sources support only part of this claim — read each source’s verdict below.
In the paper
“This association between AERONET data and AOD from MODIS is significant during the biomass burning seasons in South America, which the R2 (coefficient of determination) for most of the AERONET stations in Brazil was higher than 0.8538.”
§ Health impacts of wildfire-related air pollution in Brazil: a nationwide study of more than 2 million hospital admissions between 2008 and 2018 > Methods > Exposure data
What the sources say
- Partly supportedcites [38] Hoelzemann, J. J. et al. Regional representative of AERONET observation sites during the biomass burning season in South America determined by correlation studies with MODIS Aerosol Optical Depth. J. Geophys. Res. Atmos. 114, 1–20, https://doi.org/10.1029/2008JD010369 (2009). sourceExperimental — accuracy not yet measured
Section 5.2 reports strong AERONET–MODIS AOD correlations during the August–October burning seasons and says this pattern applies to the biomass-burning-influenced sites. It gives R² > 0.7, however, not R² > 0.85 for most Brazilian stations; the Conclusions likewise report generally good correlations at R² > 0.7. (LLM, conf=0.87)
plaincorrelational- Asserted: passes — The authors put it forward as true.
- Checkable: passes — It can be checked against evidence.
- Load-bearing: unclear — It is unclear whether the paper’s conclusions depend on it.
- Based: passes — The paper gives a reason why it holds.
It may state two separate claims as one.
- Partly supported
A result the paper reports from its own data — it cites no other source for it, so there is none to check. The quote shows it is in the paper.
In the paper
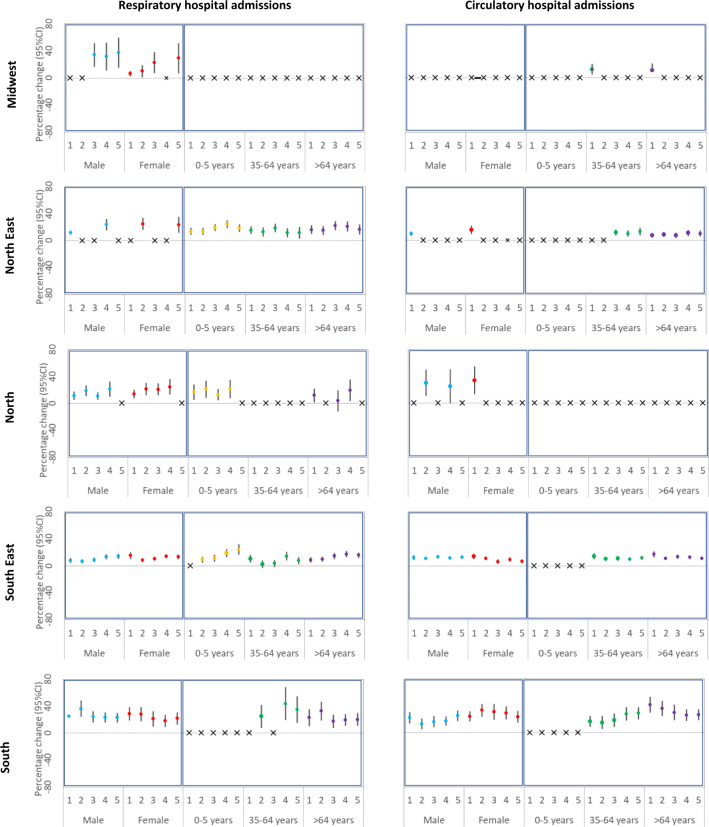
“We found the same variation for the subgroup analysis by age but not for the subgroup analysis by sex.”
§ Health impacts of wildfire-related air pollution in Brazil: a nationwide study of more than 2 million hospital admissions between 2008 and 2018 > Discussion
plain- Asserted: passes — The authors put it forward as true.
- Checkable: passes — It can be checked against evidence.
- Load-bearing: unclear — It is unclear whether the paper’s conclusions depend on it.
- Based: passes — The paper gives a reason why it holds.
It may state two separate claims as one.
A result the paper reports from its own data — it cites no other source for it, so there is none to check. The quote shows it is in the paper.
In the paper
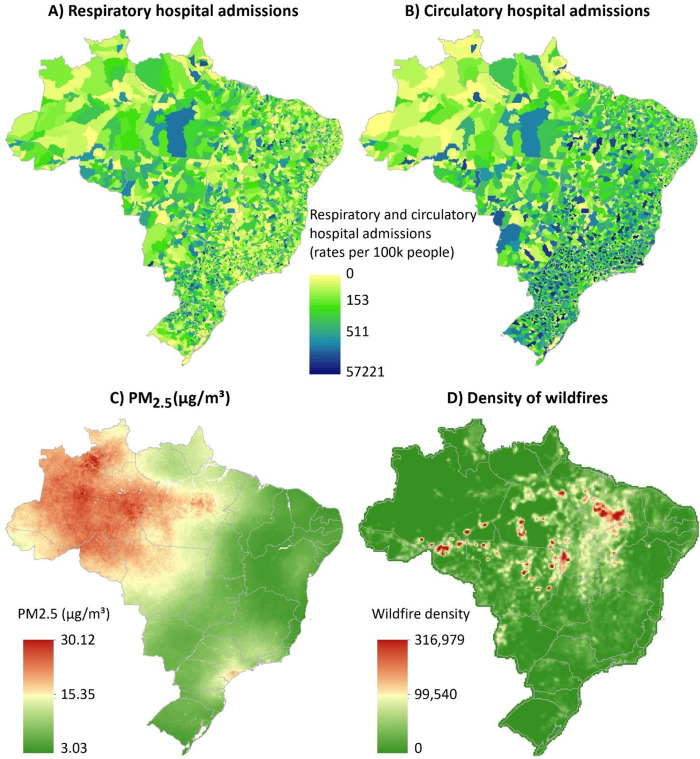
“Our results show high concentration of PM2.5 in the Amazon region, whereas the regions with high density of wildfire are mostly located in part of the North and Northeast in Brazil.”
§ Health impacts of wildfire-related air pollution in Brazil: a nationwide study of more than 2 million hospital admissions between 2008 and 2018 > Discussion
plain- Asserted: passes — The authors put it forward as true.
- Checkable: passes — It can be checked against evidence.
- Load-bearing: unclear — It is unclear whether the paper’s conclusions depend on it.
- Based: passes — The paper gives a reason why it holds.
It may state two separate claims as one.
A result the paper reports from its own data — it cites no other source for it, so there is none to check. The quote shows it is in the paper.
In the paper
“The mean concentration of PM2.5 over the study period in Brazil was ~15 μg m−3, which exceed the air quality guidelines from the World Health Organization (10 μg m−3 annual mean).”
§ Health impacts of wildfire-related air pollution in Brazil: a nationwide study of more than 2 million hospital admissions between 2008 and 2018 > Results > Exposure characteristics
plain- Asserted: passes — The authors put it forward as true.
- Checkable: passes — It can be checked against evidence.
- Load-bearing: unclear — It is unclear whether the paper’s conclusions depend on it.
- Based: passes — The paper gives a reason why it holds.
It may state two separate claims as one.
In the paper
“Wildfires emit substantial amounts of air pollutants that can travel over large distances, affecting air quality and human health far from the originating fires4.”
§ Health impacts of wildfire-related air pollution in Brazil: a nationwide study of more than 2 million hospital admissions between 2008 and 2018 > Introduction
What the sources say
- Not checked — no full text of the sourcecites [4] Youssouf, H. et al. Quantifying wildfires exposure for investigating health-related effects. Atmos. Environ. 97, 239–251 (2014). source
plaindirect- Asserted: passes — The authors put it forward as true.
- Checkable: passes — It can be checked against evidence.
- Load-bearing: passes — The paper’s conclusions depend on it.
- Based: passes — The paper gives a reason why it holds.
It may state two separate claims as one.
What the paper did — it cites no source for this, so there is none to check. The quote shows it is in the paper.
In the paper
“Finally, given that the health data is based on filling out of Hospital Admission Authorization Forms (HAAFs), we have to consider a possibility of errors when the hospital staffs/doctors are filling these forms.”
§ Health impacts of wildfire-related air pollution in Brazil: a nationwide study of more than 2 million hospital admissions between 2008 and 2018 > Discussion
hedgedconditional- Asserted: passes — The authors put it forward as true.
- Checkable: passes — It can be checked against evidence.
- Load-bearing: fails — The paper’s conclusions may not depend on it.
- Based: passes — The paper gives a reason why it holds.
Probably not a substantial claim. The paper’s conclusions may not depend on it.
The paper states this without a source or data behind it here, so there is nothing to check it against. The quote shows it is in the paper.
In the paper
“As shown in the “Introduction” section, the literature has reported PM2.5 as the major pollutant emitted by wildfires.”
§ Health impacts of wildfire-related air pollution in Brazil: a nationwide study of more than 2 million hospital admissions between 2008 and 2018 > Methods > Exposure data
plain- Asserted: passes — The authors put it forward as true.
- Checkable: passes — It can be checked against evidence.
- Load-bearing: fails — The paper’s conclusions may not depend on it.
- Based: fails — The paper may give no reason why it holds.
Probably not a substantial claim. The paper’s conclusions may not depend on it. The paper may give no reason why it holds.
What the paper did — it cites no source for this, so there is none to check. The quote shows it is in the paper.
In the paper
“Then, region-specific OR were meta-analyzed to estimate national average hospital admissions associated with wildfire-related PM2.5 in wildfire waves. We accounted for intra- and inter-region variability by applying regression meta-analysis with random effects.”
§ Health impacts of wildfire-related air pollution in Brazil: a nationwide study of more than 2 million hospital admissions between 2008 and 2018 > Methods > Statistical analyses
plaincorrelational- Asserted: passes — The authors put it forward as true.
- Checkable: passes — It can be checked against evidence.
- Load-bearing: passes — The paper’s conclusions depend on it.
- Based: passes — The paper gives a reason why it holds.
Probably not a substantial claim.
What the paper did — it cites no source for this, so there is none to check. The quote shows it is in the paper.
In the paper
“We conducted numerous effect modification and sensitivity analysis by stratifying the analyses by sex, by age (0–5 years old, 35–64 years old, and >64 years old), by excluding the control pollutants from the model (CO, NO2, and O3), by excluding race, by excluding some spatial terms (state and latitude/longitude), and by accounting for cardiorespiratory hospital admissions (cardiovascular and”
§ Health impacts of wildfire-related air pollution in Brazil: a nationwide study of more than 2 million hospital admissions between 2008 and 2018 > Methods > Statistical analyses
plain- Asserted: passes — The authors put it forward as true.
- Checkable: passes — It can be checked against evidence.
- Load-bearing: fails — The paper’s conclusions may not depend on it.
- Based: passes — The paper gives a reason why it holds.
Probably not a substantial claim. The paper’s conclusions may not depend on it. It may state two separate claims as one.
What the paper did — it cites no source for this, so there is none to check. The quote shows it is in the paper.
In the paper
“Third, we used a modeling approach that indicates the extreme episodes of wildfire, which we defined as wildfire waves.”
§ Health impacts of wildfire-related air pollution in Brazil: a nationwide study of more than 2 million hospital admissions between 2008 and 2018 > Discussion
hedged- Asserted: passes — The authors put it forward as true.
- Checkable: passes — It can be checked against evidence.
- Load-bearing: passes — The paper’s conclusions depend on it.
- Based: passes — The paper gives a reason why it holds.
Probably not a substantial claim.
What the paper did — it cites no source for this, so there is none to check. The quote shows it is in the paper.
In the paper
“We highlight that the matching study design controls for individual-level confounding factors as the patients are considered as their controls.”
§ Health impacts of wildfire-related air pollution in Brazil: a nationwide study of more than 2 million hospital admissions between 2008 and 2018 > Discussion
plaindirect- Asserted: passes — The authors put it forward as true.
- Checkable: passes — It can be checked against evidence.
- Load-bearing: unclear — It is unclear whether the paper’s conclusions depend on it.
- Based: passes — The paper gives a reason why it holds.
It may state two separate claims as one.
A conclusion the paper draws from its own results — it cites no other source for it, so there is none to check. The quote shows it is in the paper.
In the paper
“First, our findings add strength to the evidence that wildfire pollution, such as pollution from other sources, has adverse cardiac and respiratory effects, likely through similar biological mechanisms as shown in toxicological literature.”
§ Health impacts of wildfire-related air pollution in Brazil: a nationwide study of more than 2 million hospital admissions between 2008 and 2018 > Discussion
hedgedconditional- Asserted: passes — The authors put it forward as true.
- Checkable: passes — It can be checked against evidence.
- Load-bearing: passes — The paper’s conclusions depend on it.
- Based: passes — The paper gives a reason why it holds.
It may state two separate claims as one.
What the paper did — it cites no source for this, so there is none to check. The quote shows it is in the paper.
In the paper
“Also, people who had the health event were defined as their own controls, allowing for control of all individual-level potential confounders (e.g., socio-economic status, smoking history, pre-existing medical conditions) by design, except for ones that change rapidly.”
§ Health impacts of wildfire-related air pollution in Brazil: a nationwide study of more than 2 million hospital admissions between 2008 and 2018 > Methods > Statistical analyses
plain- Asserted: passes — The authors put it forward as true.
- Checkable: passes — It can be checked against evidence.
- Load-bearing: passes — The paper’s conclusions depend on it.
- Based: passes — The paper gives a reason why it holds.
Probably not a substantial claim.
What the paper did — it cites no source for this, so there is none to check. The quote shows it is in the paper.
In the paper
“The primary analysis and all the sensitivity analyses were conducted individually for each one of the five Brazilian regions (Appendix 1 shows the spatial distribution of these regions). We performed this subgroup analysis by region to capture the regional heterogeneity of landscape in Brazil (e.g., Amazon Forest, Atlantic Forest, Pantanal, etc.), which is strongly correlated with wildfire occ”
§ Health impacts of wildfire-related air pollution in Brazil: a nationwide study of more than 2 million hospital admissions between 2008 and 2018 > Methods > Statistical analyses
plain- Asserted: passes — The authors put it forward as true.
- Checkable: passes — It can be checked against evidence.
- Load-bearing: passes — The paper’s conclusions depend on it.
- Based: passes — The paper gives a reason why it holds.
Probably not a substantial claim.
What the paper did — it cites no source for this, so there is none to check. The quote shows it is in the paper.
In the paper
“We adjusted the model for several control/confounding variables, including other air pollutants emitted by wildfires (CO, NO2, and O3), meteorological variables (temperature, relative humidity, precipitation, wind speed, wind direction), topographic variable represented by elevation, spatial terms (latitude, longitude, state, and a binary variable representing the municipalities that are the capit”
§ Health impacts of wildfire-related air pollution in Brazil: a nationwide study of more than 2 million hospital admissions between 2008 and 2018 > Methods > Statistical analyses
plain- Asserted: passes — The authors put it forward as true.
- Checkable: passes — It can be checked against evidence.
- Load-bearing: passes — The paper’s conclusions depend on it.
- Based: passes — The paper gives a reason why it holds.
Probably not a substantial claim.
What the paper did — it cites no source for this, so there is none to check. The quote shows it is in the paper.
In the paper
“Second, the definition of wildfire waves may be a source of misclassification, because the number of smoke days will be fixed over a year.”
§ Health impacts of wildfire-related air pollution in Brazil: a nationwide study of more than 2 million hospital admissions between 2008 and 2018 > Discussion
hedgedconditional- Asserted: passes — The authors put it forward as true.
- Checkable: passes — It can be checked against evidence.
- Load-bearing: fails — The paper’s conclusions may not depend on it.
- Based: passes — The paper gives a reason why it holds.
Probably not a substantial claim. The paper’s conclusions may not depend on it.
What the paper did — it cites no source for this, so there is none to check. The quote shows it is in the paper.
In the paper
“To our knowledge, this is the study with the largest sample size and the largest study period in Brazil.”
§ Health impacts of wildfire-related air pollution in Brazil: a nationwide study of more than 2 million hospital admissions between 2008 and 2018 > Discussion
hedged- Asserted: passes — The authors put it forward as true.
- Checkable: passes — It can be checked against evidence.
- Load-bearing: unclear — It is unclear whether the paper’s conclusions depend on it.
- Based: passes — The paper gives a reason why it holds.
It may state two separate claims as one.
What the paper did — it cites no source for this, so there is none to check. The quote shows it is in the paper.
In the paper
“Fourth, we accounted for a strong quantitative component in our analyses, looking at the exposure on the day of the health event and the exposure on non-event days with a time-stratified sampling. As described in the “Methods” sections, this reduced the effects of confounding related to the seasonal trend by controlling for time-dependent/independent risk factors.”
§ Health impacts of wildfire-related air pollution in Brazil: a nationwide study of more than 2 million hospital admissions between 2008 and 2018 > Discussion
plaindirect- Asserted: passes — The authors put it forward as true.
- Checkable: passes — It can be checked against evidence.
- Load-bearing: passes — The paper’s conclusions depend on it.
- Based: passes — The paper gives a reason why it holds.
It may state two separate claims as one.
The paper relies on this without support.
Fine particulate matter (PM2.5) is the major pollutant emitted by wildfires.
“Fine particulate matter (PM2.5) is the major pollutant emitted by wildfires.”
The paper relies on this without support.
Brazil is a very fire-prone region.
“Given that Brazil is very fire-prone region”
The paper relies on this without support.
Different types of biomass in Brazil are strongly correlated with wildfire events over space and time.
“where there are different types of biomass (Amazon Forest, Cerrado, Atlantic Forest, Caatinga, Pampa, and Pantanal) that are strongly correlated with wildfire events over space and time”
The paper relies on this without support.
There is a critical challenge related to land use in Brazil that correlates to wildfire occurrence.
“where there is a critical challenge related to land use (e.g., agriculture, deforestation etc.), which also correlates to wildfire occurrence”
The paper relies on this without support.
The distribution of health facilities varies drastically by region in Brazil, with more per capita in the South than in the Amazon region, including the North.
“In Brazil, the distribution of health facilities varies drastically by region. For example, there are many more health facilities per capita in the South than in the Amazon region, including the North.”
The paper relies on this without support.
People with cardiorespiratory symptoms during wildfire episodes may not seek medical care, leading to underascertainment of hospital admissions.
“given the presence of the individual perceptions and decisions to seek medical care after symptoms of cardiorespiratory diseases during wildfire episodes (as mentioned above), there will be different types of persons.”
Self-check
Percentages, sums and reported differences re-computed from the paper’s own numbers.
Each contradiction between two passages listed here was confirmed by an independent check.
Rated minor: it would not touch a result — a value no result rests on, a p-value that stays on the same side of the significance level, or a conflict that is clerical, resolved elsewhere in the paper, or outside its own findings.
In the paper
§ Health impacts of wildfire-related air pollution in Brazil: a nationwide study of more than 2 million hospital admissions between 2008 and 2018 > Discussion
“the estimated increase in cardiovascular hospital admissions varied from 14.9% (95% CI: 9–18%) with 1-day moving average”
§ Health impacts of wildfire-related air pollution in Brazil: a nationwide study of more than 2 million hospital admissions between 2008 and 2018 > Results > Association between wildfire PM2.5 and hospital admissions
“| Circulatory Hospital Admissions | 1 | 1.14 | 1.09 | 1.18 |”
Citations
Cites
Brook, R. D., Rajagopalan, S., Pope, C. A., Brook, J. R., Bhatnagar, A., Diez-Roux, A. V., Holguin, F., Hong, Y., Luepker, R. V., Mittleman, M. A., et al. (2010) · Circulation · doi:10.1161/cir.0b013e3181dbece1 · Cited by 6,548
The CAMS reanalysis of atmospheric composition
Inness, A., Ades, M., Agustí‐Panareda, A., Barré, J., Benedictow, A., Blechschmidt, A., Dominguez, J. J., Engelen, R. J., Eskes, H. J., Flemming, J., et al. (2019) · Atmospheric chemistry and physics · doi:10.5194/acp-19-3515-2019 · Cited by 1,749
The CAMS reanalysis of atmospheric composition
Inness, A., Ades, M., Agusti-Panareda, A., Barré, J., Benedictow, A., Blechschmidt, A.-M., Dominguez, J. J., Engelen, R., Eskes, H., Flemming, J., et al. (2018) · doi:10.5194/acp-2018-1078 · Cited by 1,654
Critical Review of Health Impacts of Wildfire Smoke Exposure
Reid, C. E., Brauer, M., Johnston, F. H., Jerrett, M., Balmes, J. R., & Elliott, C. T. (2016) · Environmental Health Perspectives · doi:10.1289/ehp.1409277 · Cited by 1,396
Pervasive transition of the Brazilian land-use system
Lapola, D. M., Martinelli, L. A., Peres, C. A., Ometto, J. P. H. B., Ferreira, M. E., Nobre, C. A., Aguiar, A. P. D., Bustamante, M. M. C., Cardoso, M. F., Costa, M. H., et al. (2014) · Nature Climate Change · doi:10.1038/nclimate2056 · Cited by 573
US particulate matter air quality improves except in wildfire-prone areas
McClure, C. D., & Jaffe, D. A. (2018) · Proceedings of the National Academy of Sciences · doi:10.1073/pnas.1804353115 · Cited by 464
Fire history and the global carbon budget: a 1°× 1° fire history reconstruction for the 20th century
Mouillot, F., & Field, C. B. (2005) · Global Change Biology · doi:10.1111/j.1365-2486.2005.00920.x · Cited by 425
California Wildfires of 2008: Coarse and Fine Particulate Matter Toxicity
Wegesser, T. C., Pinkerton, K. E., & Last, J. A. (2009) · Environmental Health Perspectives · doi:10.1289/ehp.0800166 · Cited by 341
Liu, J. C., Wilson, A., Mickley, L. J., Dominici, F., Ebisu, K., Wang, Y., Sulprizio, M. P., Peng, R. D., Yue, X., Son, J.-Y., et al. (2017) · Epidemiology · doi:10.1097/ede.0000000000000556 · Cited by 303
Kim, Y. H., Warren, S. H., Krantz, Q. T., King, C. J., Jaskot, R. H., Preston, W., George, B. J., Hays, M. D., Landis, M. S., Higuchi, M., et al. (2018) · Environmental Health Perspectives · doi:10.1289/ehp2200 · Cited by 300
Johnston, F., Hanigan, I., Henderson, S., Morgan, G., & Bowman, D. (2011) · Environmental Research · doi:10.1016/j.envres.2011.05.007 · Cited by 294
Gueymard, C. A., & Yang, D. (2020) · Atmospheric Environment · doi:10.1016/j.atmosenv.2019.117216 · Cited by 292
Health Effects of the 2003 Southern California Wildfires on Children
Künzli, N., Avol, E., Wu, J. Y., Gauderman, W. J., Rappaport, E., Millstein, J., Bennion, J., McConnell, R., Gilliland, F. D., Berhane, K. T., et al. (2006) · American Journal of Respiratory and Critical Care Medicine · doi:10.1164/rccm.200604-519oc · Cited by 278
Haikerwal, A., Akram, M., Monaco, A. D., Smith, K. L., Sim, M. R., Meyer, M., Tonkin, A. M., Abramson, M. J., & Dennekamp, M. (2015) · Journal of the American Heart Association · doi:10.1161/jaha.114.001653 · Cited by 254
Air quality and human health improvements from reductions in deforestation-related fire in Brazil
Reddington, C. L., Butt, E. W., Ridley, D. A., Artaxo, P., Morgan, W. T., Coe, H., & Spracklen, D. V. (2015) · Nature Geoscience · doi:10.1038/ngeo2535 · Cited by 244
Associations of wildfire smoke PM2.5 exposure with cardiorespiratory events in Colorado 2011–2014
Stowell, J., Geng, G., Saikawa, E., Chang, H. H., Fu, J. S., Yang, C.-E., Zhu, Q., Liu, Y., & Strickland, M. J. (2019) · Environment International · doi:10.1016/j.envint.2019.105151 · Cited by 189
Gan, R. W., Ford, B., Lassman, W., Pfister, G. G., Vaidyanathan, A., Fischer, E. V., Volckens, J., Pierce, J. R., & Magzamen, S. L. (2017) · GeoHealth · doi:10.1002/2017gh000073 · Cited by 177
Liousse, C., Guillaume, B., Grégoire, J., Mallet, M., Galy‐Lacaux, C., Pont, V., Akpo, A., Bedou, M., Castéra, P., Dungall, L., et al. (2010) · Atmospheric chemistry and physics · doi:10.5194/acp-10-9631-2010 · Cited by 164
Lowe, R., Barcellos, C., Coelho, C. A. S., Bailey, T., Coelho, G. E., Graham, R., Jupp, T. E., Ramalho, W. M., Carvalho, M. S., Stephenson, D. B., et al. (2014) · The Lancet Infectious Diseases · doi:10.1016/s1473-3099(14)70781-9 · Cited by 160
Rappold, A. G., Cascio, W. E., Kilaru, V. J., Stone, S. L., Neas, L. M., Devlin, R. B., & Diaz-Sanchez, D. (2012) · Environmental Health · doi:10.1186/1476-069x-11-71 · Cited by 157
Dmitrenko, I., Kirillov, S., Ivanov, V. V., Woodgate, R. A., Polyakov, I. V., Koldunov, N., Fortier, L., Lalande, C., Kaleschke, L., Bauch, D., et al. (2009) · Journal of Geophysical Research Atmospheres · doi:10.1029/2008jc005229 · Cited by 156
Impact on human health of particulate matter emitted from burnings in the Brazilian Amazon region
Ignotti, E., Valente, J. G., Longo, K. M., Freitas, S. R., Hacon, S. D. S., & Artaxo Netto, P. (2010) · Revista de Saúde Pública · doi:10.1590/s0034-89102010000100013 · Cited by 137
Non-Accidental Health Impacts of Wildfire Smoke
Youssouf, H., Liousse, C., Roblou, L., Assamoi, E.-M., Salonen, R., Maesano, C., Banerjee, S., & Annesi-Maesano, I. (2014) · International Journal of Environmental Research and Public Health · doi:10.3390/ijerph111111772 · Cited by 131
Jones, C. G., Rappold, A. G., Vargo, J., Cascio, W. E., Kharrazi, M., McNally, B., Hoshiko, S., & with the CARES Surveillance Group (2020) · Journal of the American Heart Association · doi:10.1161/jaha.119.014125 · Cited by 104
Ferrari, U., Exner, T., Wanka, E. R., Bergemann, C., Meyer‐Arnek, J., Hildenbrand, B., Tufman, A., Heumann, C., Huber, R. M., Bittner, M. L., et al. (2011) · International Journal of Biometeorology · doi:10.1007/s00484-011-0405-x · Cited by 87
Why is particulate matter produced by wildfires toxic to lung macrophages?
Franzi, L. M., Bratt, J. M., Williams, K. M., & Last, J. A. (2011) · Toxicology and Applied Pharmacology · doi:10.1016/j.taap.2011.09.003 · Cited by 84
Koplitz, S. N., Nolte, C. G., Pouliot, G., Vukovich, J. M., & Beidler, J. (2018) · Atmospheric Environment · doi:10.1016/j.atmosenv.2018.08.020 · Cited by 83
Jacobson, L. D. S. V., Hacon, S. D. S., Castro, H. A. D., Ignotti, E., Artaxo, P., Saldiva, P. H. N., & de Leon, A. C. M. P. (2014) · PLoS ONE · doi:10.1371/journal.pone.0104177 · Cited by 79
Hoelzemann, J. J., Longo, K. M., Fonseca, R. M., do Rosário, N. M. E., Elbern, H., Freitas, S. R., & Pires, C. (2009) · Journal of Geophysical Research: Atmospheres · doi:10.1029/2008jd010369 · Cited by 64
Where There’s Wildfire, There’s Smoke
Balmes, J. R. (2018) · New England Journal of Medicine · doi:10.1056/nejmp1716846 · Cited by 64
Carmo, C. N. D., Hacon, S., Longo, K. M., Freitas, S., Ignotti, E., Leon, A. P. D., & Artaxo, P. (2010) · Revista Panamericana de Salud Pública · doi:10.1590/s1020-49892010000100002 · Cited by 58
Surface ozone climatology of South Eastern Brazil and the impact of biomass burning events
Targino, A. C., Harrison, R. M., Krecl, P., Glantz, P., de Lima, C. H., & Beddows, D. C. S. (2019) · Journal of Environmental Management · doi:10.1016/j.jenvman.2019.109645 · Cited by 58
Quantifying wildfires exposure for investigating health-related effects
Youssouf, H., Liousse, C., Roblou, L., Assamoi, E. M., Salonen, R. O., Maesano, C., Banerjee, S., & Annesi-Maesano, I. (2014) · Atmospheric Environment · doi:10.1016/j.atmosenv.2014.07.041 · Cited by 50
Wu, L., Li, X., Kim, H., Geng, H., Godoi, R. H. M., Barbosa, C. G. G., Godoi, A. F. L., Yamamoto, C. I., Souza, R. A. F. D., Pöhlker, C., et al. (2019) · Atmospheric chemistry and physics · doi:10.5194/acp-19-1221-2019 · Cited by 44
Potential Predictability of Malaria in Africa Using ECMWF Monthly and Seasonal Climate Forecasts
Tompkins, A. M., & Giuseppe, F. D. (2014) · Journal of Applied Meteorology and Climatology · doi:10.1175/jamc-d-14-0156.1 · Cited by 43
Tesfaye, M., Botai, J. O., Sivakumar, V., & Tsidu, G. M. (2014) · Meteorology and Atmospheric Physics · doi:10.1007/s00703-014-0328-2 · Cited by 17
Fernandes, K. S., dos Santos, E., Godoi, R. H. M., Yamamoto, C. I., Barbosa, C. G. G., Souza, R. A. F. D., & Machado, C. M. D. (2020) · Journal of the Brazilian Chemical Society · doi:10.21577/0103-5053.20200188 · Cited by 11
Association between Prevailing Circulation Patterns and Coarse Particles in Portugal
Cavaleiro, R., Russo, A., Sousa, P. M., & Durão, R. M. (2021) · Atmosphere · doi:10.3390/atmos12010085 · Cited by 9
Research works printed but not linked: 2
- Ignotti, E. et al. Impact on human health of particulate matter emitted from burnings in the Brazilian Amazon region. Rev. Saude Publica 44, 121–130 (2010a). · DOI · Paper page
- Reid, C. E. et al. Critical review of health impacts of wildfire smoke exposure. Environ. Health Perspect. 124, 1334–1343, https://doi.org/10.1289/ehp.1409277 (2016a). · DOI · Paper page
Cited by
Sorted by citations
Reimagine fire science for the anthropocene
Shuman, J. K., Balch, J. K., Barnes, R. T., Higuera, P. E., Roos, C. I., Schwilk, D. W., Stavros, E. N., Banerjee, T., Bela, M. M., Bendix, J., et al. (2022) · PNAS Nexus · doi:10.1093/pnasnexus/pgac115 · Cited by 103
Li, H., Chen, Q., Wang, C., Wang, R., Sha, T., Yang, X., & Ainur, D. (2022) · Journal of Hazardous Materials · doi:10.1016/j.jhazmat.2022.130087 · Cited by 81
Sözener, Z. Ç., Treffeisen, E. R., Öztürk, B. Ö., & Schneider, L. C. (2023) · Journal of Allergy and Clinical Immunology · doi:10.1016/j.jaci.2023.09.001 · Cited by 86
Advances in the study of global forest wildfires
Li, T., Cui, L., Liu, L., Chen, Y., Liu, H., Song, X., & Xu, Z. H. (2023) · Journal of Soils and Sediments · doi:10.1007/s11368-023-03533-8 · Cited by 77
Mandal, M., Das, S., Roy, A., Rakwal, R., Jones, O. A. H., Popek, R., Agrawal, G. K., & Sarkar, A. (2023) · The Science of The Total Environment · doi:10.1016/j.scitotenv.2023.164352 · Cited by 62
Metadata
- Authors
- Requia, W. J., Amini, H., Mukherjee, R., Gold, D. R., & Schwartz, J. D.
- Affiliations
- University of Copenhagen (DK)
- Harvard University (US)
- Brigham and Women's Hospital (US)
- Venue
- Nature Communications
- Published
- 2021-11-12
- Volume
- 12
- Issue
- 1
- Pages
- 6555-6555
- ISSN
- 2041-1723 (ISSN-L)
- PMC
- PMC8589982
- OpenAlex
- W3213522055
- Cited by
- 122
- References
- 37
- Citations by year
- 2026: 30 · 2025: 30 · 2024: 23 · 2023: 23 · 2022: 16
- FWCI
- 6.14
- Type
- journal article
- Language
- en
- Open access
- gold
- doi.org
- Locations
- Nature Communications (publishedVersion, cc-by)
- PubMed Central (publishedVersion, cc-by)
- PubMed (publishedVersion)
- Research at the University of Copenhagen (University of Copenhagen) (publishedVersion, cc-by)
- RePEc: Research Papers in Economics (submittedVersion)
- DOAJ (DOAJ: Directory of Open Access Journals) (submittedVersion, cc-by-sa)
- Funders
- Ministry of Science, Technology and Innovation | Conselho Nacional de Desenvolvimento Científico e Tecnológico
- Topics
- Physical Sciences › Environmental Science › Health, Toxicology and Mutagenesis › Air Quality and Health Impacts
- Physical Sciences › Environmental Science › Health, Toxicology and Mutagenesis › Climate Change and Health Impacts
- Physical Sciences › Environmental Science › Global and Planetary Change › Fire effects on ecosystems
- Keywords
- wildfire smoke, air pollution health effects, respiratory hospital admissions, Amazon wildfires, Northern Brazil, particulate matter exposure
- MeSH terms
- Air Pollutants, Air Pollution, Brazil, Hospitalization, Humans
About these checks
Registry, retraction, Cites and statistics results are computed, not judged, with one exception: a printed reference that no index lists is read once by a model before it counts as a citation error. Claims are extracted by a model and kept only when their quote appears verbatim in the text; each cited source is then checked, with a model’s help, for whether it says what the claim relies on. Those verdicts can be wrong — read the claim’s quote and the cited source before relying on one.
A language model drew the claims from the paper on 2026-11-03, under version 3 of the claim definition (model deepseek-v4.1-flash, prompt extract-v3).
A second model labelled each claim on 2026-11-03 (model jev-1.13-20260917, definition revision gold-guideline-v0.2).
Cited sources are checked with a language model’s help (gpt-6-sol).
Statistics and arithmetic are recomputed, not judged.
Confidence bands are shown only for fields calibrated on our annotated test set. None is calibrated yet, so no band is shown.
What counts as a claim ›How we measure confidence ›How we check this ›
Are you an author, or do you see a problem with this page? Request a review
