

The DOI matches its Crossref record; 97 of the 97 references it cites were found in a registry or an index.
Tau activates microglia via the PQBP1-cGAS-STING pathway to promote brain inflammation
Open accessAbstract
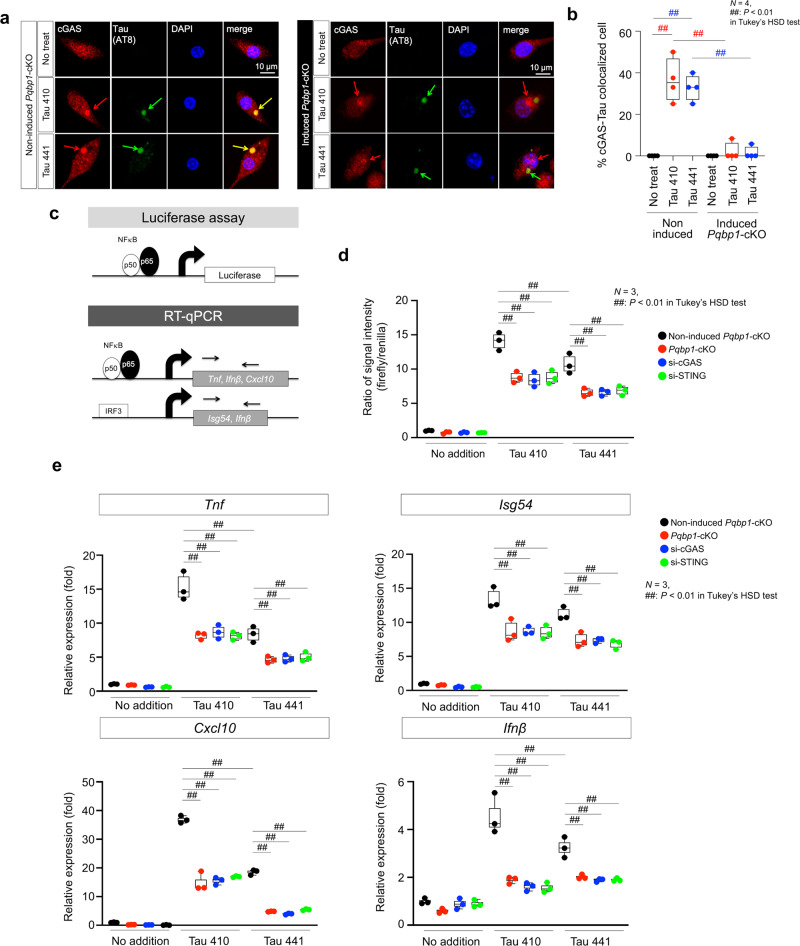
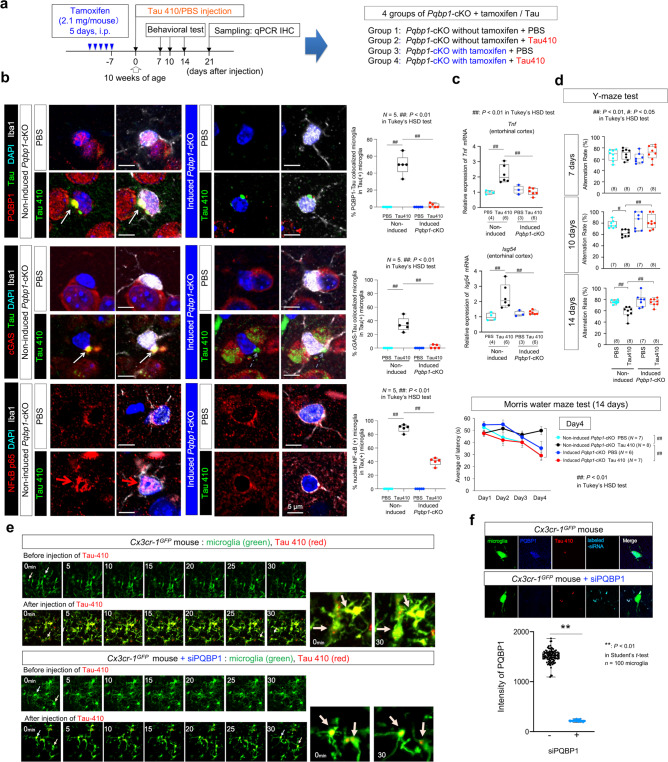
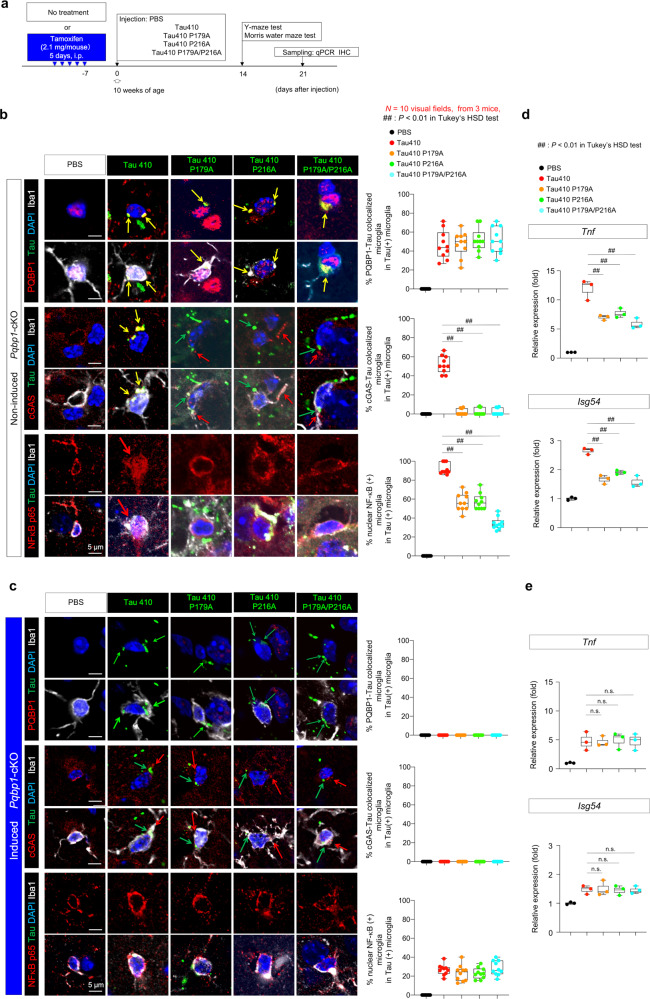
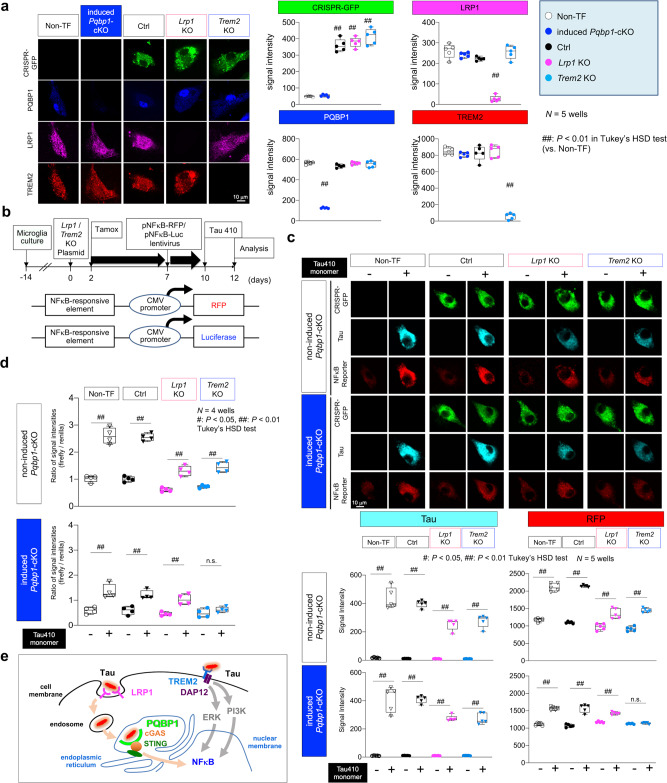
Brain inflammation generally accompanies and accelerates neurodegeneration. Here we report a microglial mechanism in which polyglutamine binding protein 1 (PQBP1) senses extrinsic tau 3R/4R proteins by direct interaction and triggers an innate immune response by activating a cyclic GMP-AMP synthase (cGAS)-Stimulator of interferon genes (STING) pathway. Tamoxifen-inducible and microglia-specific depletion of PQBP1 in primary culture in vitro and mouse brain in vivo shows that PQBP1 is essential for sensing-tau to induce nuclear translocation of nuclear factor κB (NFκB), NFκB-dependent transcription of inflammation genes, brain inflammation in vivo, and eventually mouse cognitive impairment. Collectively, PQBP1 is an intracellular receptor in the cGAS-STING pathway not only for cDNA of human immunodeficiency virus (HIV) but also for the transmissible neurodegenerative disease protein tau. This study characterises a mechanism of brain inflammation that is common to virus infection and neurodegenerative disorders.
Overview
The claims and statistics of this paper haven’t been checked yet.
Run the check — free, no account needed. It reads the open-access text and checks the sources it cites.
Integrity signals
Registry
Cites
Statistics
Figures
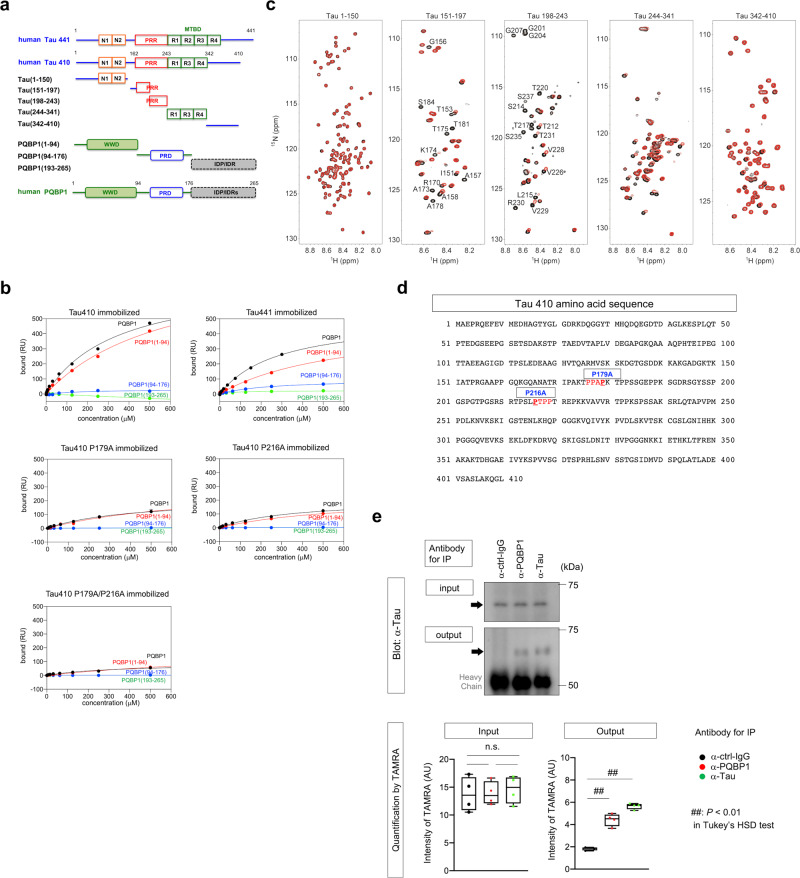
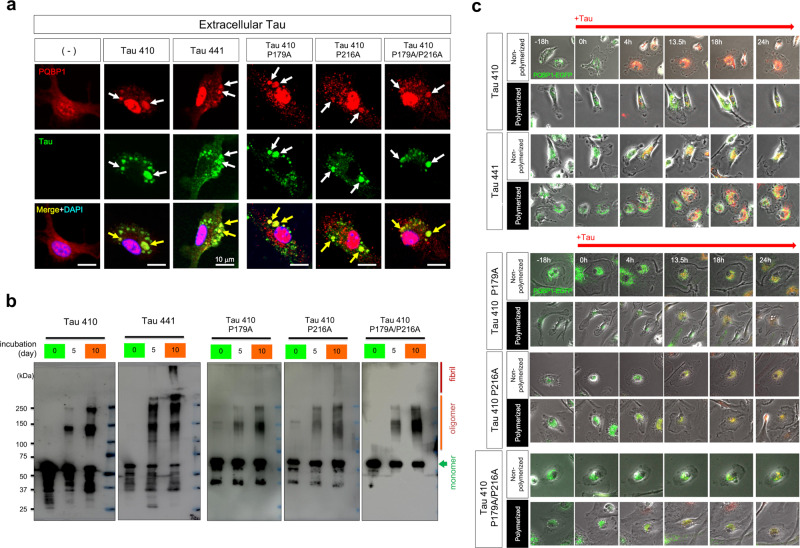
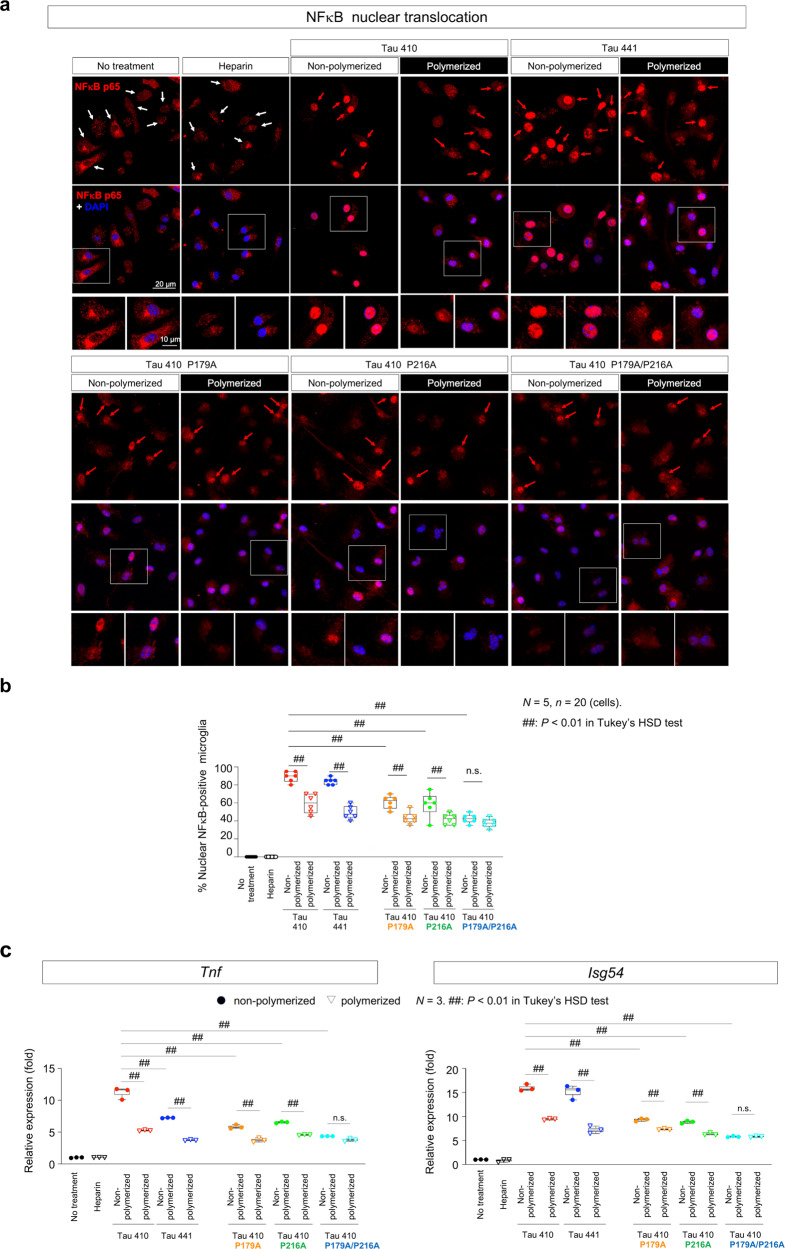
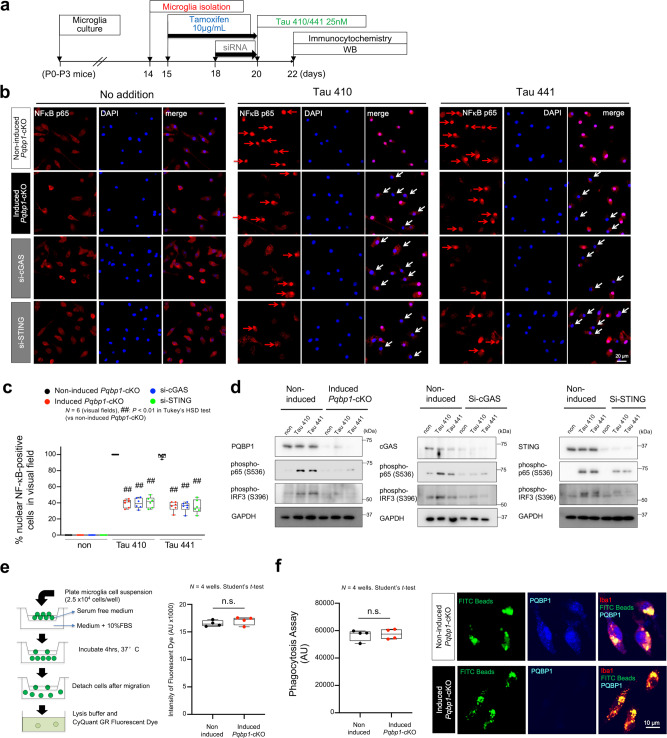
Verification
Claims the paper makes
The claims and statistics of this paper haven’t been checked yet.
Run the check — free, no account needed. It reads the open-access text and checks the sources it cites.
Claims other papers make about this one
Each is checked against this paper’s own text: does it say what the citing paper says it does?
The cited source says what the claim attributes to it.
In the citing paper
“Jin et al. reported an interesting finding that AD pathogenic protein tau can bind to polyglutamine binding protein 1 (PQBP1) and trigger inflammation in the CNS by activating cGAS-STING pathway.405”
From Role of neuroinflammation in neurodegeneration development (2023) · cites this paper as [405]
The cited source says what the claim attributes to it.
In the citing paper
“While it is currently unknown whether tau-induced retrotransposons form eccDNA, recent work from Gan's group (Udeochu et al. 2023) suggests that the cGAS-STING pathway is robustly activated in brains of tau transgenic mice, consistent with previous work in primary microglia treated with tau aggregates (Jin et al. 2021).”
From The Role of Retrotransposons and Endogenous Retroviruses in Age-Dependent Neurodegenerative Disorders (2024) · cites this paper as Jin et al. 2021
In the citing paper
“Numerous studies have reported that misfolded proteins and protein aggregates, including tau,136–139 Aβ,138,140 α-synuclein,141–144 mutant huntingtin,145 TDP-43,132,146 superoxide dismutase 1 (SOD1),147–149 and fused in sarcoma (FUS)150 induce microglial activation and neuroinflammation.”
From Microbiota–gut–brain axis and its therapeutic applications in neurodegenerative diseases (2024) · cites this paper as [136]
In the citing paper
“In addition, several studies have shown that tau seeds taken up by microglia can activate microglia, further exacerbating tau propagation and pathology [186, 192, 193].”
From Tau and neuroinflammation in Alzheimer’s disease: interplay mechanisms and clinical translation (2023) · cites this paper as [192]
In the citing paper
“Jin et al. reported that microglia uptake exogenous monomeric tau in parallel via two surface receptors, LRP1 and TREM2, and then induce nuclear factor NF-κB activation in microglia through two different pathways, LRP1/polyglutamine binding protein 1 (PQBP1)/cyclic GMP–AMP synthase (cGAS)/Stimulator of interferon genes (STING) and TREM2/extracellular signal-regulated kinase (ERK)/Phosphoinositide”
From Tau and neuroinflammation in Alzheimer’s disease: interplay mechanisms and clinical translation (2023) · cites this paper as [192]
Self-check
Percentages, sums and reported differences re-computed from the paper’s own numbers.
The self-check needs the paper’s full text.
Citations
Cites
Amyloid oligomers exacerbate tau pathology in a mouse model of tauopathy
Selenica, M.-L. B., Brownlow, M., Jimenez, J. P., Lee, D. C., Pena, G., Dickey, C. A., Gordon, M. N., & Morgan, D. (2013) · Neurodegenerative Diseases · doi:10.1159/000337230 · Cited by 10,359
Alzheimer's Disease: Genes, Proteins, and Therapy
Selkoe, D. J. (2001) · Physiological Reviews · doi:10.1152/physrev.2001.81.2.741 · Cited by 6,063
A Unique Microglia Type Associated with Restricting Development of Alzheimer’s Disease
Keren-Shaul, H., Spinrad, A., Weiner, A., Matcovitch-Natan, O., Dvir-Szternfeld, R., Ulland, T. K., David, E., Baruch, K., Lara-Astaiso, D., Toth, B., et al. (2017) · Cell · doi:10.1016/j.cell.2017.05.018 · Cited by 5,493
Release of chromatin protein HMGB1 by necrotic cells triggers inflammation
Scaffidi, P., Misteli, T., & Bianchi, M. E. (2002) · Nature · doi:10.1038/nature00858 · Cited by 4,221 · cited 1×
“1a) and analyzed the interaction of these fragments with PQBP1(1-94) (Fig.”
BackgroundMechanisms underlying inflammation in neurodegeneration
Glass, C. K., Saijo, K., Winner, B., Marchetto, M. C., & Gage, F. H. (2010) · Cell · doi:10.1016/j.cell.2010.02.016 · Cited by 3,580
Association of missense and 5′-splice-site mutations in tau with the inherited dementia FTDP-17
Hutton, M., Lendon, C. L., Rizzu, P., Baker, M., Froelich, S., Houlden, H., Pickering-Brown, S., Chakraverty, S., Isaacs, A., Grover, A., et al. (1998) · Nature · doi:10.1038/31508 · Cited by 3,498
TREM2 Variants in Alzheimer's Disease
Guerreiro, R., Wojtas, A., Bras, J., Carrasquillo, M., Rogaeva, E., Majounie, E., Cruchaga, C., Sassi, C., Kauwe, J. S. K., Younkin, S., et al. (2013) · New England Journal of Medicine · doi:10.1056/nejmoa1211851 · Cited by 3,020
Variant of TREM2 Associated with the Risk of Alzheimer's Disease
Jonsson, T., Stefansson, H., Steinberg, S., Jonsdottir, I., Jonsson, P. V., Snaedal, J., Bjornsson, S., Huttenlocher, J., Levey, A. I., Lah, J. J., et al. (2013) · New England Journal of Medicine · doi:10.1056/nejmoa1211103 · Cited by 2,558
Regulation and function of the cGAS–STING pathway of cytosolic DNA sensing
Chen, Q., Sun, L., & Chen, Z. J. (2016) · Nature Immunology · doi:10.1038/ni.3558 · Cited by 2,333
Immune attack: the role of inflammation in Alzheimer disease
Heppner, F. L., Ransohoff, R. M., & Becher, B. (2015) · Nature Reviews Neuroscience · doi:10.1038/nrn3880 · Cited by 2,134
Cited by
Sorted by citations
Items 101–200 of 224
Yassaghi, Y., Nazerian, Y., Ghasemi, M., Nazerian, A., Sayehmiri, F., Perry, G. L., & Pourbadie, H. G. (2024) · Journal of Cellular and Molecular Medicine · doi:10.1111/jcmm.18554 · Cited by 15
The STING Signaling: A Novel Target for Central Nervous System Diseases
Song, M. S., Ren, J., Zhu, Z., Yi, Z., Wang, C., Liang, L., Tian, J., Mao, G., Mao, G., & Chen, M. (2025) · Cellular and Molecular Neurobiology · doi:10.1007/s10571-025-01550-4 · Cited by 13
Zhao, D., Wang, J., Zhu, Y., Zhang, H., Ni, C., Zhao, Z., Dai, J., He, R., Liu, G.-Z., Gan, C., et al. (2025) · Translational Neurodegeneration · doi:10.1186/s40035-025-00510-8 · Cited by 18
Therapeutic Targets in Innate Immunity to Tackle Alzheimer’s Disease
Serradas, M. L., Ding, Y., Martorell, P., Kulińska, I., & Castro‐Gomez, S. (2024) · Cells · doi:10.3390/cells13171426 · Cited by 16
Zhu, D., Wang, P., Chen, X., Wang, K., Wu, Y., Guo, Y., Zhang, M., & Qin, J. (2025) · Research · doi:10.34133/research.0598 · Cited by 16
Elzinga, S. E., Koubek, E. J., Hayes, J. M., Carter, A., Mendelson, F. E., Webber‐Davis, I. F., Lentz, S. I., & Feldman, E. L. (2023) · Frontiers in Cellular Neuroscience · doi:10.3389/fncel.2023.1167688 · Cited by 12
Vavougios, G. D., Tseriotis, V., Liampas, A., Mavridis, T., de Erausquin, G. A., & Hadjigeorgiou, G. M. (2024) · Frontiers in Human Neuroscience · doi:10.3389/fnhum.2024.1352118 · Cited by 13
Therapeutic modulation of cGAS-STING pathway in neurodegeneration
Sharma, V., Verma, R., Sharma, P., & Singh, T. G. (2025) · Brain Research · doi:10.1016/j.brainres.2025.149784 · Cited by 12
Deng, Y., Yi, X., Gong, Y., Zhou, L., Xie, D., Wang, J., Liu, Z., Zhang, Y., & Wu, W. (2022) · Biochimica et Biophysica Acta (BBA) - Molecular Cell Research · doi:10.1016/j.bbamcr.2022.119385 · Cited by 11
Li, L.-J., Liang, S., Sun, X., Zhu, J., Niu, X.-Y., Du, X.-Y., Huang, Y., & Liu, R. (2025) · Journal of Neuroinflammation · doi:10.1186/s12974-025-03333-6 · Cited by 14
Hiramoto, K., Kubo, S., Tsuji, K., Sugiyama, D., & Hamano, H. (2024) · Current Issues in Molecular Biology · doi:10.3390/cimb46050295 · Cited by 10
Ox-inflammasome involvement in neuroinflammation
Vallese, A., Cordone, V., Pecorelli, A., & Valacchi, G. (2023) · Free Radical Biology and Medicine · doi:10.1016/j.freeradbiomed.2023.07.010 · Cited by 13
The role of TRPV4 in programmed cell deaths
Ma, Q., Wu, J., Li, H., Ma, X., Yin, R., Bai, L., Tang, H., & Liu, N. (2024) · Molecular Biology Reports · doi:10.1007/s11033-023-09199-2 · Cited by 11
Fasting the brain for mental health
Pérez‐Kast, R. C., & Camacho‐Morales, A. (2024) · Journal of Psychiatric Research · doi:10.1016/j.jpsychires.2024.11.041 · Cited by 10
Solving the Amyloid Paradox: Unveiling the Complex Pathogenicity of Amyloid Fibrils
Sulatsky, M. I., Stepanenko, O. V., Stepanenko, O. V., & Sulatskaya, A. I. (2025) · Aggregate · doi:10.1002/agt2.70078 · Cited by 9
Chakraborty, R., Maya, S., Testa, V., Montero-Muñoz, J., Nonaka, T., Hasegawa, M., Consiglio, A., & Zurzolo, C. (2026) · Nature Communications · doi:10.1038/s41467-026-73136-7 · Cited by 10
Tarhan, S. Z., Pepe, N. A., Şen, A., & İşoğlu, İ. A. (2025) · International Journal of Biological Macromolecules · doi:10.1016/j.ijbiomac.2025.145837 · Cited by 9
Diverse influences on tau aggregation and implications for disease progressionPreprint
Alstyne, M. V., Pratt, J., & Parker, R. (2025) · Genes & Development · doi:10.1101/gad.352551.124 · Cited by 11
Sterile innate immune mechanisms in neurodegenerative diseases
Ealy, A., Serapiglia, A. M., & Panicker, N. (2025) · Journal of Biological Chemistry · doi:10.1016/j.jbc.2025.111039 · Cited by 8
The role of PQBP1 in neural development and function
Cheng, S., Liu, X., Yuan, L., Wang, N., Zhang, Z. C., & Han, J. (2023) · Biochemical Society Transactions · doi:10.1042/bst20220920 · Cited by 8
Shao, X., Xie, L., Zhai, J., & Ge, M. (2024) · IBRO Neuroscience Reports · doi:10.1016/j.ibneur.2024.12.008 · Cited by 7
Liu, Z., Chen, Y., Chen, Y., Zheng, J., Wu, W., Wang, L., Wang, H., & Yu, Y. (2024) · International Journal of Molecular Sciences · doi:10.3390/ijms25084324 · Cited by 7
The Sixth Sense: Self-nucleic acid sensing in the brain
Dorrity, T. J., Shin, H., Gertie, J. A., & Chung, H. (2024) · Advances in immunology · doi:10.1016/bs.ai.2024.03.001 · Cited by 6
Zhao, X. O., Zong, J., Liu, Y., Aili, T., Qiu, M., Wu, J., & Hu, B. (2024) · Aging and Disease · doi:10.14336/ad.2024.0123-1 · Cited by 7
Towards elucidating disease-relevant states of neurons and glia by CRISPR-based functional genomics
Leng, K., & Kampmann, M. (2022) · Genome Medicine · doi:10.1186/s13073-022-01134-7 · Cited by 7
Unraveling APOE4: The dual role in CNS and peripheral inflammation in Alzheimer's disease
Li, X., Li, Z., Chen, H., Guo, H., Ge, Y., Dong, F., Zhang, F., & Zhang, F. (2025) · International Immunopharmacology · doi:10.1016/j.intimp.2025.115199 · Cited by 7
Mukherjee, D. A. (2026) · Clinical Immunology Communications · doi:10.1016/j.clicom.2026.01.004 · Cited by 6
cGAS Mediates the Inflammatory Responses of Human Microglial Cells to Genotoxic DNA Damage
Suptela, A. J., Radwan, Y., Richardson, C. A., Yan, S., Afonin, K. A., & Marriott, I. (2023) · Inflammation · doi:10.1007/s10753-023-01946-8 · Cited by 6
The therapeutic potential of early exercise in Alzheimer's disease: Focus on the brain-spleen axis
Wang, T., Feng, L., & Tian, Z. (2025) · Ageing Research Reviews · doi:10.1016/j.arr.2025.102980 · Cited by 6
Akinluyi, E. T., Takahashi, K., Connolly, M. G., Poon, W. W., & Macauley, M. S. (2025) · ACS Chemical Neuroscience · doi:10.1021/acschemneuro.5c00805 · Cited by 5
Ved, A., Gajjar, T. B., Kakkad, A. D., Ganesan, S., Shankhyan, A., Jayabalan, K., Mishra, S., Jain, B., Arora, V., Gulati, M., et al. (2026) · Brain Sciences · doi:10.3390/brainsci16050434 · Cited by 5
Nguyen, N. L., Hoang, T. X., & Kim, J. Y. (2024) · Molecular Neurobiology · doi:10.1007/s12035-024-04295-1 · Cited by 6
PQBP3 prevents senescence by suppressing PSME3-mediated proteasomal Lamin B1 degradation
Yoshioka, Y., Huang, Y., Jin, X., Ngo, K. X., Kumaki, T., Jin, M., Toyoda, S., Takayama, S., Inotsume, M., Fujita, K., et al. (2024) · The EMBO Journal · doi:10.1038/s44318-024-00192-4 · Cited by 7
Self-citationTargeting microglia-Th17 feed-forward loop to suppress autoimmune neuroinflammation
Xiao, J., Meng, Z., Lu, Y., Nie, Z., Liu, Y., Yao, Z. Q., Zhang, Y., & Li, L. (2025) · Journal of Neuroinflammation · doi:10.1186/s12974-025-03427-1 · Cited by 7
Bai, S., Lu, X., Xu, Y., Su, H., Lin, Y., Jiang, Z., Zong, Z., Wang, H., Yan, L. Y. C., Zhang, X., et al. (2025) · Advanced Science · doi:10.1002/advs.202504467 · Cited by 5
Vavougios, G. D., Mavridis, T., Doskas, T. K., Papaggeli, O., Foka, P., & Hadjigeorgiou, G. M. (2024) · Current Issues in Molecular Biology · doi:10.3390/cimb46050277 · Cited by 5
Zhang, C., Liu, X., Zhang, Q., Sun, J., Zhang, X., & Wu, Y. (2023) · Virus Research · doi:10.1016/j.virusres.2023.199119 · Cited by 5
Yan, X., Wang, E., Zhao, M. L., Ma, G., Xu, X.-X., Zhao, J.-B., Li, X., Zeng, J., & Ma, X. (2025) · Neuroscience · doi:10.1016/j.neuroscience.2025.03.019 · Cited by 5
Redox regulation of neuroinflammatory pathways contributes to damage in Alzheimer’s disease brain
Carnevale, L. N., Banerjee, P., Zhang, X., Navarro, J., Raspur, C. K., Patel, P. R., Nakamura, T., Schahrer, E., Scott, H. R., Lang, N., et al. (2026) · Cell chemical biology · doi:10.1016/j.chembiol.2026.03.017 · Cited by 5
Chen, X., Tang, X., Chen, S., Ye, Y., & Mao, F. (2026) · Frontiers in Immunology · doi:10.3389/fimmu.2025.1709908 · Cited by 4
Spotlight on cGAS-STING: role in disease pathogenesis and therapeutic potential
Yan, D., Hu, J., Liu, Z. H., & Ouyang, W. (2026) · Molecular Biomedicine · doi:10.1186/s43556-026-00478-5 · Cited by 4
Yan, D., Wang, Y., Ouyang, W., Huang, C., Chen, Q., Hu, J., & Liu, Z. (2024) · Asian Journal of Pharmaceutical Sciences · doi:10.1016/j.ajps.2024.100969 · Cited by 4
Silva-Llanes, I., Madruga, E. L., Martı́nez, A., & Lastres‐Becker, I. (2025) · Frontiers in Neuroscience · doi:10.3389/fnins.2024.1530809 · Cited by 5
Role of Tau Protein Hyperphosphorylation in Diabetic Retinal Neurodegeneration
Mu, J., Zhang, Z., Jiang, C., Geng, H., & Duan, J. (2025) · Journal of Ophthalmology · doi:10.1155/joph/3278794 · Cited by 5
Microglial Hemoxygenase-1 Deletion Reduces Inflammation in the Retina of Old Mice with Tauopathy
Fernández‐Albarral, J. A., Salobrar‐García, E., Matamoros, J. A., Fernández‐Mendívil, C., del Sastre, E., Chen, L., de Hoz, R., López‐Cuenca, I., Sánchez-Puebla, L., Ramirez, J. M., et al. (2022) · Antioxidants · doi:10.3390/antiox11112151 · Cited by 4
Sun, G., Chi, S., Li, J., Xu, P., Lin, T., Chen, C., Liu, L., Yang, Y.-L., Yan, R., Han, H., et al. (2025) · Angewandte Chemie International Edition · doi:10.1002/anie.202513542 · Cited by 4
Type-1 interferons associated with microglial-mediated neuroinflammation in Alzheimer’s disease
Shippy, D. C., Sande, M. L., & Ulland, T. K. (2026) · Journal of Neuroinflammation · doi:10.1186/s12974-026-03828-w · Cited by 3
Role of PQBP1 in Pathogen Recognition—Impact on Innate Immunity
Wiench, L., Rizzo, D., Sinay, Z., Nacsa, Z., Fuchs, N. V., & König, R. (2024) · Viruses · doi:10.3390/v16081340 · Cited by 3
In-Depth Proteomic Analysis Reveals Phenotypic Diversity of Macrophages in Liver Fibrosis
Yang, W., Chen, L., Zhang, J., Qiu, C., Hou, W., Zhang, X., Fu, B., Zhao, D., Wang, H., Liu, D., et al. (2024) · Journal of Proteome Research · doi:10.1021/acs.jproteome.4c00681 · Cited by 2
Role of non-neuronal cells in neurorepair: a focus on proteinopathy and neurodegeneration
Rodríguez-Carreiro, S., Nogales, M. D. C., Jiménez-Galán, D., Carmona-Lorenzo, S., Caro-Martín, A., Navarro, E., & Esteras, N. (2024) · Regenerative medicine reports . · doi:10.4103/regenmed.regenmed-d-24-00005 · Cited by 2
Shen, Y., Jiang, K., Tan, D., Zhu, M., Qiu, Y., Huang, P., Zou, W., Deng, J., Wang, Z., Xiong, Y., et al. (2025) · Cell Communication and Signaling · doi:10.1186/s12964-025-02079-1 · Cited by 5
Luo, H., Wang, G., Liu, T., Guo, J., Li, Q., Cao, Z., Wang, R., & He, W. (2026) · Journal of Ethnopharmacology · doi:10.1016/j.jep.2026.121319 · Cited by 2
Yu, Z., Yu, L., Lu, W., Chen, P., Yan, H., & Jiang, Y. (2026) · Journal of Neuroinflammation · doi:10.1186/s12974-026-03766-7 · Cited by 2
Sex-dependent interferon signaling contributes to female-biased vulnerability in Alzheimer’s disease
López-López, V., Iniesta, G., Galán-Ganga, M., Exposito-Coca, A., Durán-Laforet, V., Bhojwani-Cabrera, A. M., Navarrón, C. M., Guillot-Fernández, M., Venero, J. L., Sanchez-Mut, J. V., et al. (2026) · Journal of Neuroinflammation · doi:10.1186/s12974-026-03840-0 · Cited by 4
PCK2-Mediated PQBP1 Lactylation Promotes Asthmatic Inflammation through PRMT5 Inhibition
Bai, Q., Ding, N., Feng, R., Shang, F., Wang, Z., Li, L., Wang, Z., Piao, Y., Wang, C., Song, Y., et al. (2026) · Research · doi:10.34133/research.1321 · Cited by 2
Ma, L., Zhao, Y. Q., Cai, C., Qs, L., Hu, X., & Wang, L. (2026) · Cells · doi:10.3390/cells15141291 · Cited by 2
Zhang, S., Long, L., Chai, S., Lin, M., Lu, H., Liu, X., He, Y., Dong, R., & Chen, Z. (2025) · PubMed · doi:10.14670/hh-18-850 · Cited by 2
PQBP3/NOL7 is an intrinsically disordered protein
Homma, H., Ngo, K. X., Yoshioka, Y., Tanaka, H., Inotsume, M., Fujita, K., Ando, T., & Okazawa, H. (2024) · Biochemical and Biophysical Research Communications · doi:10.1016/j.bbrc.2024.150453 · Cited by 1
Self-citationTau Pathology in Alzheimer's Disease: Bridging Molecular Mechanisms and Targeted Therapies
Dahiya, M., Yadav, M., Kumar, A., & Goyal, C. (2025) · CNS & Neurological Disorders - Drug Targets · doi:10.2174/0118715273376581250626003322 · Cited by 2
Lin, T., Tseng, P.-H., Chen, I., Lin, C., Lee, M.-C., Chang, K., Lee‐Chen, G., & Chen, C. (2025) · Neurochemistry International · doi:10.1016/j.neuint.2025.106042 · Cited by 1
Sex‐Specific Differences in the Secretome of Oligodendrocyte Progenitor Cells Post Hyperoxic Stress
Sunny, D. E., Hammer, E., Michalik, S., Völker, U., & Heckmann, M. (2025) · Journal of Extracellular Biology · doi:10.1002/jex2.70082 · Cited by 1
Garrahy, J. P. (2025) · Journal of Alzheimer s Disease · doi:10.1177/13872877251404970 · Cited by 1
Wu, Z., Jia, R., Zhang, Q., Huang, L.-Y., Yan, J.-T., Zhang, Y. H., & Fan, Y. (2026) · Biomarker Research · doi:10.1186/s40364-026-00906-2 · Cited by 2
Cao, K., Xie, J., Liang, X., Li, Y., Gong, H., & Luo, H. (2026) · Neural Regeneration Research · doi:10.4103/nrr.nrr-d-25-00917 · Cited by 2
Organelle-orchestrated cGAS-STING signaling and its role in neurodegeneration
Liu, J.-Y., Sheng-ye, L., Ran, L.-X., Qiao, W., Zhang, F. Y., Zhang, K.-S., Liang, X.-X., Liu, M., Yu, Z.-H., Wei, M., et al. (2026) · Pharmacological Research · doi:10.1016/j.phrs.2026.108216 · Cited by 2
Wu, M., Wu, Y., Feng, X., Huang, Y., Chen, L., Li, G., Zhang, D.-Q., Zhao, W., & Chen, Y. (2026) · Peptides · doi:10.1016/j.peptides.2026.171491 · Cited by 1
ISG15/ISGylation in central nervous system diseases: molecular mechanisms and therapeutic targeting
Chen, X., Xiao, X., Luo, W., Liu, H., Liu, M., Sima, X., & Gao, L. (2026) · Biochemical Pharmacology · doi:10.1016/j.bcp.2026.118057 · Cited by 1
Peripheral biomarkers of neuroinflammation in Alzheimer’s disease and vascular dementia
Ouyang, X., Chia, R. S. L., Chai, Y. L., Chong, Sim, M. A., Jo, D., Arumugam, T. V., Sethi, G., Dawe, G. S., Chen, C. P., et al. (2026) · Biochemical Pharmacology · doi:10.1016/j.bcp.2026.118077 · Cited by 1
PQBP1-dependent alternative RNA splicing underlies high calorie diet-induced cognitive impairment
Huang, Y., Homma, H., Yoshioka, Y., Watanabe, T., Fujino, S., Matsuyama, K., Chen, X., Fujita, K., Shiwaku, H., Spada, A. R. L., et al. (2026) · Molecular Psychiatry · doi:10.1038/s41380-026-03868-x · Cited by 1
Self-citationWang, M., Li, J., Wang, X., Chai, X., Luo, J., Zhang, Y., Chang, X., Sun, Y., & Wang, H. (2026) · Cytokine & Growth Factor Reviews · doi:10.1016/j.cytogfr.2026.101537 · Cited by 2
Dapsone is an anticatalysis for Alzheimer’s disease exacerbationPreprint
Lee, J., Kanwar, B. A., Lee, C. J., Sergi, C. M., & Coleman, M. D. (2022) · Research Square · doi:10.21203/rs.3.rs-1260878/v1 · Cited by 1
Wang, B., Qiu, J., Wang, Y., Gao, S., Yu, S., Sun, D., & Lou, H. (2023) · Research Square · doi:10.21203/rs.3.rs-2690699/v1 · Cited by 1
Sex-dependent interferon signaling drives female-biased vulnerability in Alzheimer’s diseasePreprint
López-López, V., Iniesta, G., Galán-Ganga, M., Exposito-Coca, A., Bhojwani-Cabrera, A. M., Guillot-Fernández, M., Giralt, A., & López‐Atalaya, J. P. (2025) · bioRxiv (Cold Spring Harbor Laboratory) · doi:10.1101/2025.08.22.671724 · Cited by 1
Dapsone is an Anticatalysis for Alzheimer's Disease ExacerbationPreprint
Lee, J., Kanwar, B. A., Lee, C. J., Sergi, C. M., & Coleman, M. D. (2022) · SSRN Electronic Journal · doi:10.2139/ssrn.4020520
Stray self-nucleic acids: the emerging drivers of neurodegeneration
McDonald, B. K., Laohamonthonkul, P., & Yu, C. (2023) · Trends in Cell Biology · doi:10.1016/j.tcb.2023.02.006
Neurological Impact of Type I Interferon Dysregulation
Mylonas, A. (2024) · IntechOpen eBooks · doi:10.5772/intechopen.1006023
Exploring the Connection Between Nanomaterials and Neurodegenerative Disorders
Nanda, S. S., & Yi, D. K. (2024) · Micromachines · doi:10.3390/mi15111382
Common Signaling Pathways in Cancer and Alzheimer's Disease May Point to New Treatments
Wu, C., Jiang, L., Zhong, Y., & Liu, Z. (2025) · Current Topics in Medicinal Chemistry · doi:10.2174/0115680266340314250303003647
Aβ-HMGB1 complex is a pathogenic molecule at the advanced stage of Alzheimer’s diseasePreprint
Tanaka, H., Homma, H., Yoshioka, Y., Fujita, K., Yamada, S., Furukawa, K., Ishiki, A., Atsuta, N., Waragai, M., Mano, T., et al. (2025) · bioRxiv (Cold Spring Harbor Laboratory) · doi:10.1101/2025.06.12.659430
Self-citationEpigenetics and pharmacoepigenetics of age-related neurodegenerative disorders
Cacabelos, R., Martínez-Iglesias, O. A., Cacabelos, N., Cacabelos, P., & Naidoo, V. (2025) · Elsevier eBooks · doi:10.1016/b978-0-443-18722-3.00032-3
Sun, G., Chi, S., Li, J., Xu, P., Lin, T., Chen, C., Liu, L., Yang, Y.-L., Yan, R., Han, H., et al. (2025) · Angewandte Chemie · doi:10.1002/ange.202513542
Ramirez, P., Zuniga, G., Ochoa, E., & Frost, B. E. (2025) · BMC Genomics · doi:10.1186/s12864-025-12111-w
Wang, Z., Liu, J., Han, J., Zhang, T., Li, S., Hou, Y., Su, H., Han, F., & Zhang, C. (2024) · Figshare · doi:10.6084/m9.figshare.26751314
Wang, Z., Liu, J., Han, J., Zhang, T., Li, S., Hou, Y., Su, H., Han, F., & Zhang, C. (2024) · Figshare · doi:10.6084/m9.figshare.26751299
Zhu, X., Liu, W., Tang, X., Chen, Y., Ge, X., Ke, Q., Liang, X., Gan, Y., Zheng, Y., Zou, M., et al. (2024) · Figshare · doi:10.6084/m9.figshare.26590784
Wang, Z., Liu, J., Han, J., Zhang, T., Li, S., Hou, Y., Su, H., Han, F., & Zhang, C. (2024) · Figshare · doi:10.6084/m9.figshare.26751296
Zhu, X., Liu, W., Tang, X., Chen, Y., Ge, X., Ke, Q., Liang, X., Gan, Y., Zheng, Y., Zou, M., et al. (2024) · Figshare · doi:10.6084/m9.figshare.26590763
Zhu, X., Liu, W., Tang, X., Chen, Y., Ge, X., Ke, Q., Liang, X., Gan, Y., Zheng, Y., Zou, M., et al. (2024) · Figshare · doi:10.6084/m9.figshare.26590769
Zhu, X., Liu, W., Tang, X., Chen, Y., Ge, X., Ke, Q., Liang, X., Gan, Y., Zheng, Y., Zou, M., et al. (2024) · Figshare · doi:10.6084/m9.figshare.26590790
Wang, Z., Liu, J., Han, J., Zhang, T., Li, S., Hou, Y., Su, H., Han, F., & Zhang, C. (2024) · Figshare · doi:10.6084/m9.figshare.26751305
Wang, Z., Liu, J., Han, J., Zhang, T., Li, S., Hou, Y., Su, H., Han, F., & Zhang, C. (2024) · Figshare · doi:10.6084/m9.figshare.26751317
Zhu, X., Liu, W., Tang, X., Chen, Y., Ge, X., Ke, Q., Liang, X., Gan, Y., Zheng, Y., Zou, M., et al. (2024) · Figshare · doi:10.6084/m9.figshare.26590772
Wang, Z., Liu, J., Han, J., Zhang, T., Li, S., Hou, Y., Su, H., Han, F., & Zhang, C. (2024) · Figshare · doi:10.6084/m9.figshare.26751302
Zhu, X., Liu, W., Tang, X., Chen, Y., Ge, X., Ke, Q., Liang, X., Gan, Y., Zheng, Y., Zou, M., et al. (2024) · Figshare · doi:10.6084/m9.figshare.26590778
Wang, Z., Liu, J., Han, J., Zhang, T., Li, S., Hou, Y., Su, H., Han, F., & Zhang, C. (2024) · Figshare · doi:10.6084/m9.figshare.26751293
Zhu, X., Liu, W., Tang, X., Chen, Y., Ge, X., Ke, Q., Liang, X., Gan, Y., Zheng, Y., Zou, M., et al. (2024) · Figshare · doi:10.6084/m9.figshare.26590781
Zhu, X., Liu, W., Tang, X., Chen, Y., Ge, X., Ke, Q., Liang, X., Gan, Y., Zheng, Y., Zou, M., et al. (2024) · Figshare · doi:10.6084/m9.figshare.26590766
Zhu, X., Liu, W., Tang, X., Chen, Y., Ge, X., Ke, Q., Liang, X., Gan, Y., Zheng, Y., Zou, M., et al. (2024) · Figshare · doi:10.6084/m9.figshare.26590787
Wang, Z., Liu, J., Han, J., Zhang, T., Li, S., Hou, Y., Su, H., Han, F., & Zhang, C. (2024) · Figshare · doi:10.6084/m9.figshare.26751320
Wang, Z., Liu, J., Han, J., Zhang, T., Li, S., Hou, Y., Su, H., Han, F., & Zhang, C. (2024) · Figshare · doi:10.6084/m9.figshare.26751311
Metadata
- Authors
- Jin, M., Shiwaku, H., Tanaka, H., Obita, T., Ohuchi, S., Yoshioka, Y., Jin, X., Kondo, K., Fujita, K., Homma, H., Nakajima, K., Mizuguchi, M., & Okazawa, H.
- Affiliations
- Tokyo Medical and Dental University (JP)
- University of Toyama (JP)
- Soka University (JP)
- Corresponding author
- Okazawa, Hitoshi
- ORCID
- Venue
- Nature Communications
- Published
- 2021-11-15
- Volume
- 12
- Issue
- 1
- Pages
- 6565-6565
- ISSN
- 2041-1723 (ISSN-L)
- PMC
- PMC8592984
- OpenAlex
- W3214109787
- Cited by
- 223
- References
- 97
- Citations by year
- 2026: 43 · 2025: 49 · 2024: 66 · 2023: 37 · 2022: 28
- FWCI
- 13.21
- Type
- journal article
- Language
- en
- Open access
- gold
- doi.org
- Locations
- Nature Communications (publishedVersion, cc-by)
- PubMed Central (publishedVersion, cc-by)
- PubMed (publishedVersion)
- RePEc: Research Papers in Economics (submittedVersion)
- DOAJ (DOAJ: Directory of Open Access Journals) (submittedVersion, cc-by-sa)
- Funders
- MEXT | Japan Society for the Promotion of Science (16H02655, 19H01042)
- Ministry of Education, Culture, Sports, Science and Technology (22110001, 22110002)
- Topics
- Life Sciences › Neuroscience › Neurology › Neuroinflammation and Neurodegeneration Mechanisms
- Life Sciences › Neuroscience › Cellular and Molecular Neuroscience › Alzheimer's disease research and treatments
- Life Sciences › Immunology and Microbiology › Immunology › interferon and immune responses
- Keywords
- tau protein, microglia, PQBP1, cGAS-STING pathway, neuroinflammation, neurodegeneration, NF-κB, innate immune response, HIV, cognitive impairment, intracellular receptors
- MeSH terms
- STING Protein, Cyclic Guanosine Monophosphate-Adenosine Monophosphate Synthase, Animals, Brain, DNA-Binding Proteins, Encephalitis, Female, HIV, Humans, Immunity, Innate, Male, Membrane Glycoproteins, Membrane Proteins, Mice, Inbred C57BL, Nucleotidyltransferases, Tamoxifen, NF-kappa B, Microglia, Mice, Knockout, Neurodegenerative Diseases, Mice
About these checks
Registry, retraction, Cites and statistics results are computed, not judged, with one exception: a printed reference that no index lists is read once by a model before it counts as a citation error. Claims are extracted by a model and kept only when their quote appears verbatim in the text; each cited source is then checked, with a model’s help, for whether it says what the claim relies on. Those verdicts can be wrong — read the claim’s quote and the cited source before relying on one.
Statistics and arithmetic are recomputed, not judged.
Confidence bands are shown only for fields calibrated on our annotated test set. None is calibrated yet, so no band is shown.
What counts as a claim ›How we measure confidence ›How we check this ›
Are you an author, or do you see a problem with this page? Request a review
