

The DOI matches its Crossref record; 48 of the 48 references it cites were found in a registry or an index.
Demonstrating multi-round subsystem quantum error correction using matching and maximum likelihood decoders
Open accessAbstract
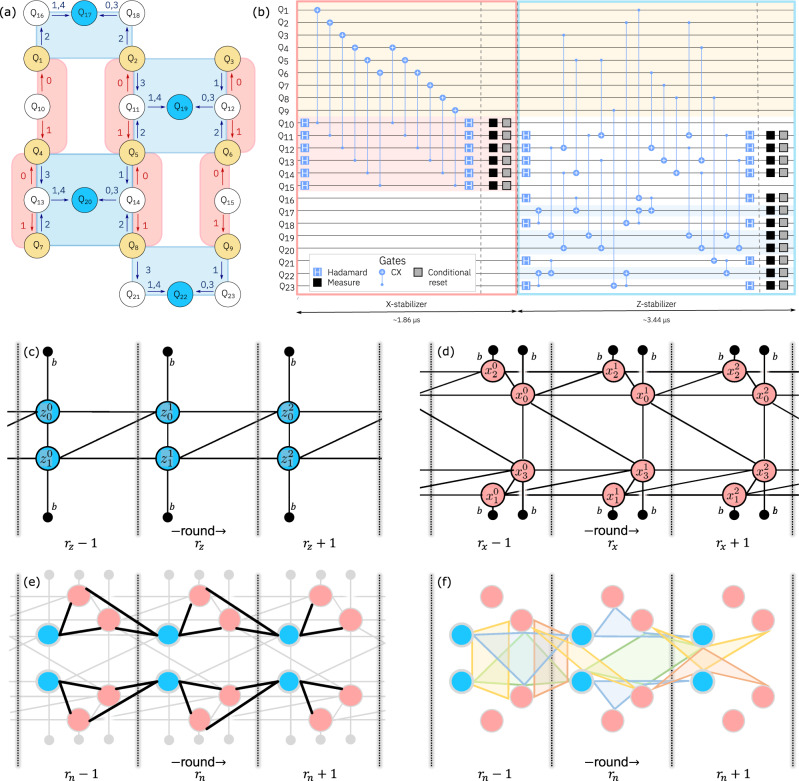
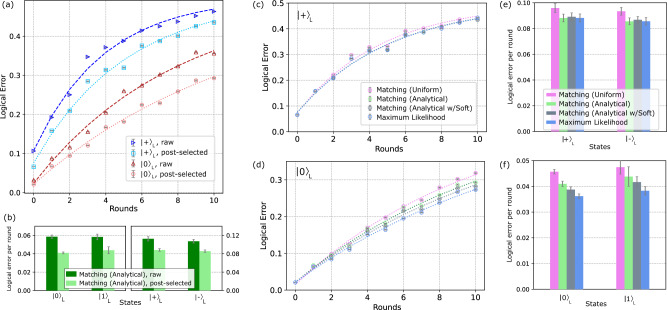
Quantum error correction offers a promising path for performing high fidelity quantum computations. Although fully fault-tolerant executions of algorithms remain unrealized, recent improvements in control electronics and quantum hardware enable increasingly advanced demonstrations of the necessary operations for error correction. Here, we perform quantum error correction on superconducting qubits connected in a heavy-hexagon lattice. We encode a logical qubit with distance three and perform several rounds of fault-tolerant syndrome measurements that allow for the correction of any single fault in the circuitry. Using real-time feedback, we reset syndrome and flag qubits conditionally after each syndrome extraction cycle. We report decoder dependent logical error, with average logical error per syndrome measurement in Z(X)-basis of ~0.040 (~0.088) and ~0.037 (~0.087) for matching and maximum likelihood decoders, respectively, on leakage post-selected data.
Overview
The claims and statistics of this paper haven’t been checked yet.
Free: it reads the open-access text and checks the first 5 claims that cite a source we can check. Create a free account to check every claim.
Integrity signals
Registry
Cites
Statistics
Figures
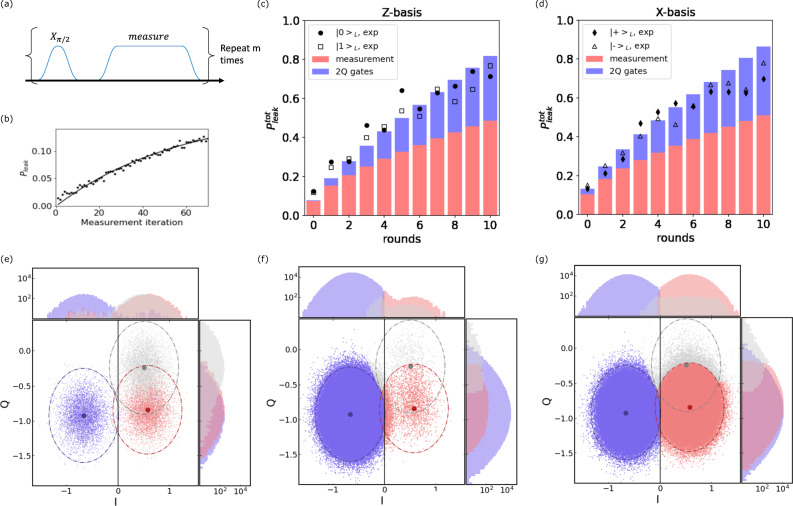
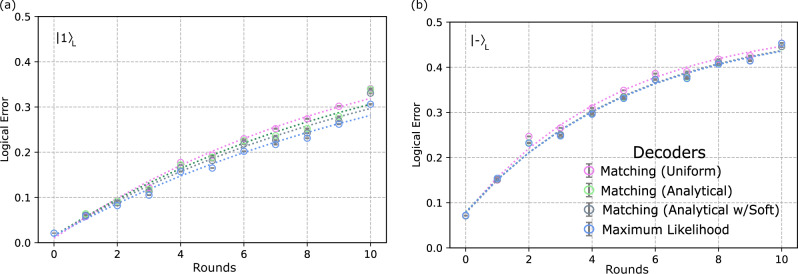
Verification
Claims the paper makes
The claims and statistics of this paper haven’t been checked yet.
Free: it reads the open-access text and checks the first 5 claims that cite a source we can check. Create a free account to check every claim.
Claims other papers make about this one
Each is checked against this paper’s own text: does it say what the citing paper says it does?
The source backs part of the claim, not all of it — or backs it for a different population, condition or comparison.
In the citing paper
“Over the past several years, there has been vast progress made in both theory, with the introduction of novel code constructions, improvements in code parameters, and decoding algorithms, and experiment, with advancements in the quality of qubits, coherence times, and gate fidelities, and even some early demonstrations of logical error suppression below threshold and small fault-tolerant primitiv”
From Quantum error correction and fault tolerance: A comprehensive tutorial (2026) · cites this paper as [29]
Experimental — accuracy not yet measuredThe cited source says what the claim attributes to it.
In the citing paper
“Recently, QEC experiments have been performed in various hardware platforms, including superconducting quantum circuits25–28, trapped ions29 and neutral atoms30.”
From Hardware-efficient quantum error correction via concatenated bosonic qubits (2025) · cites this paper as [27]
The cited source says what the claim attributes to it.
In the citing paper
“Correcting for both types of error requires QEC codes such as the surface code25–27, which have a relatively high overhead penalty1.”
From Hardware-efficient quantum error correction via concatenated bosonic qubits (2025) · cites this paper as [27]
Self-check
Percentages, sums and reported differences re-computed from the paper’s own numbers.
The self-check needs the paper’s full text.
Citations
Cites
A Limited Memory Algorithm for Bound Constrained Optimization
Byrd, R. H., Lu, P., Nocedal, J., & Zhu, C. (1995) · SIAM Journal on Scientific Computing · doi:10.1137/0916069 · Cited by 6,221
Dennis, E., Kitaev, A., Landahl, A., & Preskill, J. (2002) · Journal of Mathematical Physics · doi:10.1063/1.1499754 · Cited by 1,768
Universal quantum computation with ideal Clifford gates and noisy ancillas
Bravyi, S., & Kitaev, A. (2005) · Physical Review A · doi:10.1103/physreva.71.022316 · Cited by 1,525 · cited 1×
“Also,someprotocols,likeusingamagicstateforalogical T -gate 9 , require the application of real-time feed-forward.”
BackgroundDennis, E., Kitaev, A., Landahl, A., & Preskill, J. (2001) · CERN Document Server (European Organization for Nuclear Research) · Cited by 1,485
Topological Quantum Distillation
Bombin, H., & Martin-Delgado, M. A. (2006) · Physical Review Letters · doi:10.1103/physrevlett.97.180501 · Cited by 700
Realizing repeated quantum error correction in a distance-three surface code
Krinner, S., Lacroix, N., Remm, A., Di Paolo, A., Genois, E., Leroux, C., Hellings, C., Lazar, S., Swiadek, F., Herrmann, J., et al. (2022) · Nature · doi:10.1038/s41586-022-04566-8 · Cited by 686 · cited 1×
“Inthe realmof error correction, there have been recent realizations of the distance-3 surface code on superconducting qubits with decoding 18 and post-selection 19 , as well as a FT implementation of a dynamically protected quantum memory using the color code 20 and the FT state preparation,…”
MethodOperator quantum error-correcting subsystems for self-correcting quantum memories
Bacon, D. (2006) · Physical Review A · doi:10.1103/physreva.73.012340 · Cited by 486 · cited 1×
“We demonstrate these tools as part of the FT operation of a subsystem code [21], the heavy-hexagon code [1], on a superconducting quantum processor.”
MethodStim: a fast stabilizer circuit simulator
Gidney, C. (2021) · Quantum · doi:10.22331/q-2021-07-06-497 · Cited by 415 · cited 1×
“Constructing a decoding hypergraph for stabilizer circuits with Pauli noise can be done using standard Gottesman-Knill simulations 25 or similar Pauli tracing techniques 26 .”
MethodExponential suppression of bit or phase errors with cyclic error correction
Google Quantum, A. I., Chen, Z., Satzinger, K. J., Atalaya, J., Korotkov, A. N., Dunsworth, A., Sank, D., Quintana, C., McEwen, M., Barends, R., et al. (2021) · Nature · doi:10.1038/s41586-021-03588-y · Cited by 393
Qiskit/qiskit-metapackage: Qiskit 0.43.0
Gambetta, J., Treinish, M., Kassebaum, P., Rodríguez, D. M., De La Puente González, S., Hu, S., Javadi-Abhari, A., Azaustre, C., Pistoia, M., Scholten, T. L., et al. (2019) · Zenodo (CERN European Organization for Nuclear Research) · doi:10.5281/zenodo.2573505 · Cited by 386
Cited by
Suppressing quantum errors by scaling a surface code logical qubit
Google Quantum, A. I., Acharya, R., Aleiner, I., Allen, R., Andersen, T. I., Ansmann, M., Arute, F., Arya, K., Asfaw, A., Atalaya, J., et al. (2023) · Nature · doi:10.1038/s41586-022-05434-1 · Cited by 1,103
Real-time quantum error correction beyond break-even
Sivak, V. V., Eickbusch, A., Royer, B., Singh, S., Tsioutsios, I., Ganjam, S., Miano, A., Brock, B. L., Ding, A. Z., Frunzio, L., et al. (2023) · Nature · doi:10.1038/s41586-023-05782-6 · Cited by 407
Sparse blossom: correcting a million errors per core second with minimum-weight matching
Higgott, O., & Gidney, C. (2025) · Quantum · doi:10.22331/q-2025-01-20-1600 · Cited by 180
Encoding a magic state with beyond break-even fidelity
Gupta, R. S., Sundaresan, N., Alexander, T., Wood, C. J., Merkel, S. T., Healy, M. B., Hillenbrand, M., Jochym-O’Connor, T., Wootton, J. R., Yoder, T. J., et al. (2024) · Nature · doi:10.1038/s41586-023-06846-3 · Cited by 115
Self-citationLearning high-accuracy error decoding for quantum processors
Bausch, J., Senior, A. W., Heras, F. J. H., Edlich, T., Davies, A., Newman, M., Jones, C., Satzinger, K., Niu, M. Y., Blackwell, S., et al. (2024) · Nature · doi:10.1038/s41586-024-08148-8 · Cited by 106
Metadata
- Authors
- Sundaresan, N., Yoder, T. J., Kim, Y., Li, M., Chen, E. H., Harper, G., Thorbeck, T., Cross, A. W., Córcoles, A. D., & Takita, M.
- Affiliations
- IBM (United States) (US)
- IBM Research - Thomas J. Watson Research Center (US)
- IBM Research - Almaden (US)
- Corresponding author
- Sundaresan, Neereja
- Yoder, Theodore J.
- ORCID
- Venue
- Nature Communications
- Published
- 2023-05-18
- Volume
- 14
- Issue
- 1
- Pages
- 2852-2852
- ISSN
- 2041-1723 (ISSN-L)
- PMC
- PMC10195837
- OpenAlex
- W4377047148
- Cited by
- 108
- References
- 41
- Citations by year
- 2026: 13 · 2025: 41 · 2024: 34 · 2023: 16
- FWCI
- 9.80
- Type
- journal article
- Language
- en
- Open access
- gold
- doi.org
- Licence
- cc-by
- creativecommons.org/licenses/by/4.0 (tdm)
- creativecommons.org/licenses/by/4.0 (vor)
- Locations
- Nature Communications (publishedVersion, cc-by)
- PubMed Central (publishedVersion, cc-by)
- PubMed (publishedVersion)
- arXiv (Cornell University) (submittedVersion)
- RePEc: Research Papers in Economics (submittedVersion)
- DOAJ (DOAJ: Directory of Open Access Journals) (submittedVersion, cc-by-sa)
- arXiv (Cornell University) (cc-by)
- Funders
- ODNI | Intelligence Advanced Research Projects Activity (W911NF-16-1-0114, youngseok.kim1@ibm.com)
- Topics
- Physical Sciences › Computer Science › Artificial Intelligence › Quantum Computing Algorithms and Architecture
- Physical Sciences › Physics and Astronomy › Atomic and Molecular Physics, and Optics › Quantum Information and Cryptography
- Physical Sciences › Physics and Astronomy › Atomic and Molecular Physics, and Optics › Quantum many-body systems
- Keywords
- quantum error correction, subsystem codes, superconducting qubits, logical qubits, syndrome measurement, real-time feedback, logical error rate, post-selection, fault-tolerant quantum computing
About these checks
Registry, retraction, Cites and statistics results are computed, not judged, with one exception: a printed reference that no index lists is read once by a model before it counts as a citation error. Claims are extracted by a model and kept only when their quote appears verbatim in the text; each cited source is then checked, with a model’s help, for whether it says what the claim relies on. Those verdicts can be wrong — read the claim’s quote and the cited source before relying on one.
Statistics and arithmetic are recomputed, not judged.
Confidence bands are shown only for fields calibrated on our annotated test set. None is calibrated yet, so no band is shown.
What counts as a claim ›How we measure confidence ›How we check this ›
Are you an author, or do you see a problem with this page? Request a review
How to cite
Cite CoChat for the checks on this page, and the paper for its own findings.
- This page
- CoChat. (2026). Citation check: Demonstrating multi-round subsystem quantum error correction using matching and maximum likelihood decoders. https://app.cochat.ai/papers/10.1038/s41467-023-38247-5
- The paper
- Sundaresan, N., Yoder, T. J., Kim, Y., Li, M., Chen, E. H., Harper, G., Thorbeck, T., Cross, A. W., Córcoles, A. D., & Takita, M. (2023). Demonstrating multi-round subsystem quantum error correction using matching and maximum likelihood decoders. Nature Communications. https://doi.org/10.1038/s41467-023-38247-5
Data sources
Bibliographic data: Semantic Scholar, OpenAlex, Crossref.
Contains information from the Semantic Scholar Academic Graph Datasets, made available under the ODC Attribution License (ODC-BY 1.0).
Semantic Scholar’s data is described in: Kinney, R., et al. (2023). The Semantic Scholar Open Data Platform. arXiv:2301.10140.
