

The DOI matches its Crossref record; 71 of the 73 references it cites were found in a registry or an index.
A general model to predict small molecule substrates of enzymes based on machine and deep learning
Open accessAbstract
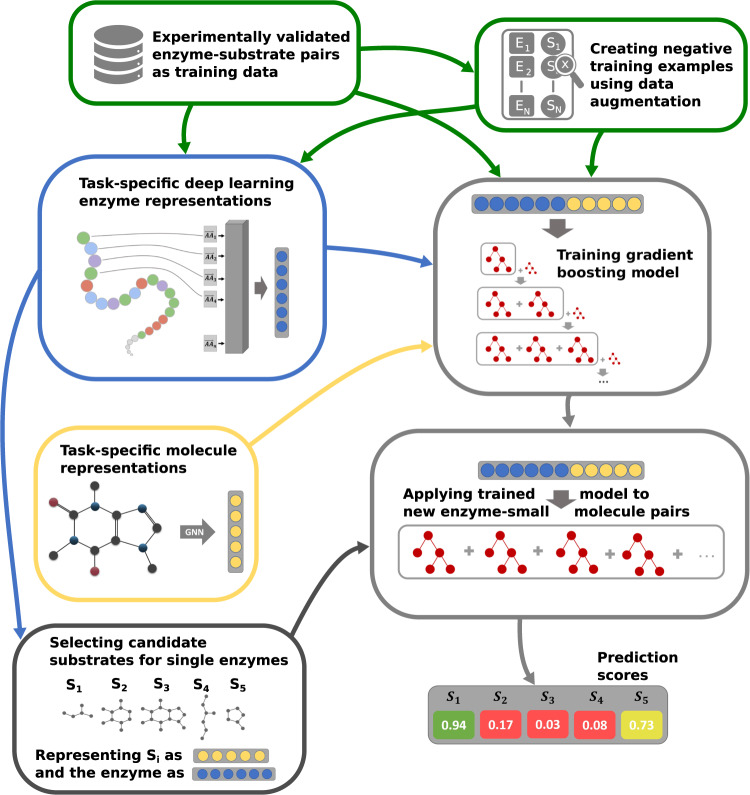
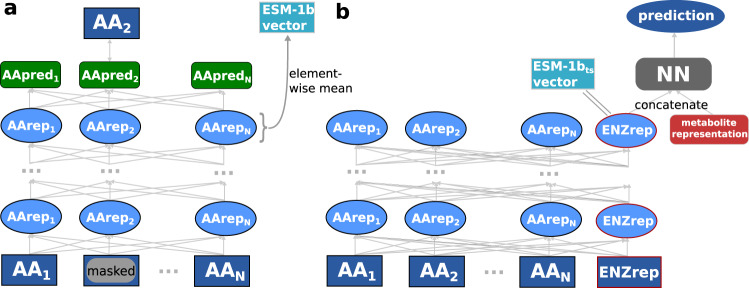
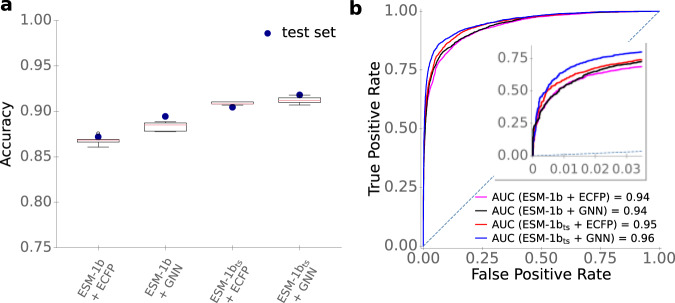
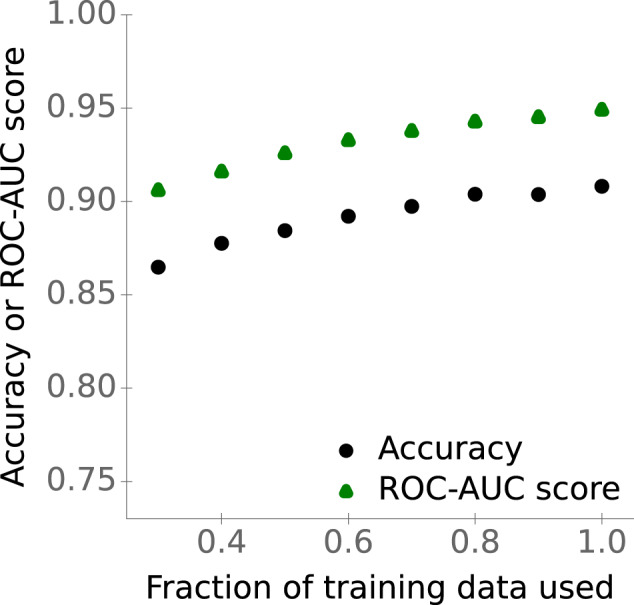
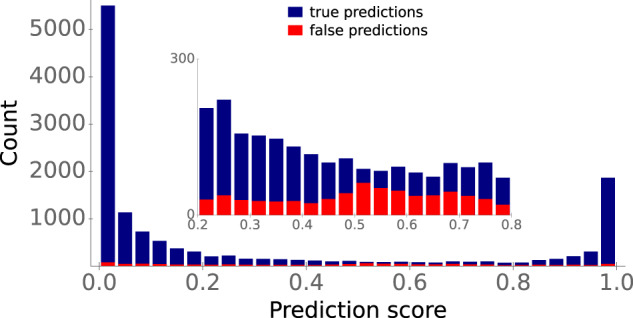
For most proteins annotated as enzymes, it is unknown which primary and/or secondary reactions they catalyze. Experimental characterizations of potential substrates are time-consuming and costly. Machine learning predictions could provide an efficient alternative, but are hampered by a lack of information regarding enzyme non-substrates, as available training data comprises mainly positive examples. Here, we present ESP, a general machine-learning model for the prediction of enzyme-substrate pairs with an accuracy of over 91% on independent and diverse test data. ESP can be applied successfully across widely different enzymes and a broad range of metabolites included in the training data, outperforming models designed for individual, well-studied enzyme families. ESP represents enzymes through a modified transformer model, and is trained on data augmented with randomly sampled small molecules assigned as non-substrates. By facilitating easy in silico testing of potential substrates, the ESP web server may support both basic and applied science.
Overview
The claims and statistics of this paper haven’t been checked yet.
Run the check — free, no account needed. It reads the open-access text and checks the sources it cites.
Integrity signals
Registry
Cites
Statistics
Figures
Verification
Claims the paper makes
The claims and statistics of this paper haven’t been checked yet.
Run the check — free, no account needed. It reads the open-access text and checks the sources it cites.
Claims other papers make about this one
Each is checked against this paper’s own text: does it say what the citing paper says it does?
The source backs part of the claim, not all of it — or backs it for a different population, condition or comparison.
In the citing paper
“It has been shown that the resulting representations contain rich information about the structure and the function of the proteins 17 , 32 , 33 .”
From Turnover number predictions for kinetically uncharacterized enzymes using machine and deep learning (2023) · cites this paper as [32]
Experimental — accuracy not yet measuredIn the citing paper
“the enzyme sequence contains information about the catalyzed reaction 32”
From Turnover number predictions for kinetically uncharacterized enzymes using machine and deep learning (2023) · cites this paper as [32]
In the citing paper
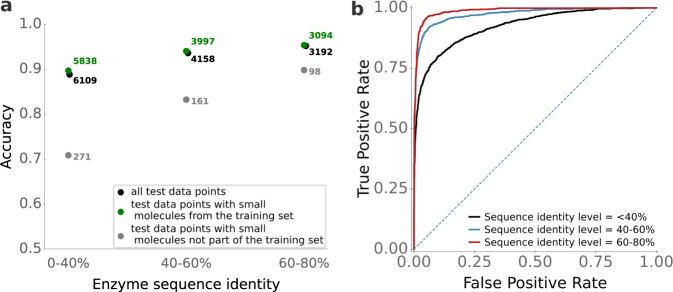
“In our study on predicting the substrate scope of enzymes 32 , we found that prediction performance depends strongly on the sequence similarity between a target enzyme and enzymes in the training set”
From Turnover number predictions for kinetically uncharacterized enzymes using machine and deep learning (2023) · cites this paper as [32]
Self-check
Percentages, sums and reported differences re-computed from the paper’s own numbers.
The self-check needs the paper’s full text.
Citations
Cites
Vaswani, A., Shazeer, N., Parmar, N., Uszkoreit, J., Jones, L., Gomez, A. N., Kaiser, L., & Polosukhin, I. (2017) · arXiv · doi:10.48550/arxiv.1706.03762 · Cited by 120,404
BERT: Pre-training of Deep Bidirectional Transformers for Language Understanding
Devlin, J., Chang, M.-W., Lee, K., & Toutanova, K. (2018) · arXiv · doi:10.48550/arxiv.1810.04805 · Cited by 73,173
Scikit-learn: Machine Learning in Python
Pedregosa, F., Varoquaux, G., Gramfort, A., Michel, V., Thirion, B., Grisel, O., Blondel, M., Müller, A., Nothman, J., Louppe, G., et al. (2012) · arXiv · doi:10.48550/arxiv.1201.0490 · Cited by 71,016
XGBoost: A Scalable Tree Boosting System
Chen, T., & Guestrin, C. (2016) · Proceedings of the 22nd ACM SIGKDD International Conference on Knowledge Discovery and Data Mining · doi:10.1145/2939672.2939785 · Cited by 54,569
Highly accurate protein structure prediction with AlphaFold
Jumper, J., Evans, R., Pritzel, A., Green, T., Figurnov, M., Ronneberger, O., Tunyasuvunakool, K., Bates, R., Žídek, A., Potapenko, A., et al. (2021) · Nature · doi:10.1038/s41586-021-03819-2 · Cited by 43,764
SciPy 1.0: fundamental algorithms for scientific computing in Python
Virtanen, P., Gommers, R., Oliphant, T. E., Haberland, M., Reddy, T., Cournapeau, D., Burovski, E., Peterson, P., Weckesser, W., Bright, J., et al. (2020) · Nature Methods · doi:10.1038/s41592-019-0686-2 · Cited by 38,430
KEGG: Kyoto Encyclopedia of Genes and Genomes
Kanehisa, M. (2000) · Nucleic Acids Research · doi:10.1093/nar/28.1.27 · Cited by 37,077
PyTorch: An Imperative Style, High-Performance Deep Learning Library
Paszke, A., Gross, S., Massa, F., Lerer, A., Bradbury, J., Chanan, G., Killeen, T., Lin, Z., Gimelshein, N., Antiga, L., et al. (2019) · arXiv · doi:10.48550/arxiv.1912.01703 · Cited by 31,473
KEGG: Kyoto Encyclopedia of Genes and Genomes
Ogata, H., Goto, S., Sato, K., Fujibuchi, W., Bono, H., & Kanehisa, M. (1999) · Nucleic Acids Research · doi:10.1093/nar/27.1.29 · Cited by 31,232
Neural Machine Translation by Jointly Learning to Align and Translate
Bahdanau, D., Cho, K., & Bengio, Y. (2014) · arXiv · doi:10.48550/arxiv.1409.0473 · Cited by 16,213
Research works printed but not linked: 4
- Cooper, G. M., Hausman, R. E. & Hausman, R. E.The Cell: A Molecular Approach, vol. 4 (ASM press, Washington DC, 2007).
- Zhou, J. et al. Graph neural networks: A review of methods and applications. AI Open 1, 57–81 (2020). · DOI · Paper page
- Van Rossum, G. & Drake, F. L. Python 3 Reference Manual. (CreateSpace, Scotts Valley, 2009).
- Bergstra, J., Yamins, D. & Cox, D. Making a science of model search: Hyperparameter optimization in hundreds of dimensions for vision architectures. In International conference on machine learning, 115-123 (PMLR, 2013).
Cited by
Sorted by citations
Machine Learning-Guided Protein Engineering
Kouba, P., Kohout, P., Haddadi, F., Bushuiev, A., Samusevich, R., Sedlář, J., Damborský, J., Pluskal, T., Šivic, J., & Mazurenko, S. (2023) · ACS Catalysis · doi:10.1021/acscatal.3c02743 · Cited by 218
Turnover number predictions for kinetically uncharacterized enzymes using machine and deep learning
Kroll, A., Rousset, Y., Hu, X.-P., Liebrand, N. A., & Lercher, M. J. (2023) · Nature Communications · doi:10.1038/s41467-023-39840-4 · Cited by 186
Self-citationNavigating the landscape of enzyme design: from molecular simulations to machine learning
Zhou, J., & Huang, M. (2024) · Chemical Society Reviews · doi:10.1039/d4cs00196f · Cited by 168
A General Machine Learning Model for Assessing Fruit Quality Using Deep Image Features
Apostolopoulos, I. D., Tzani, M., & Aznaouridis, S. I. (2023) · AI · doi:10.3390/ai4040041 · Cited by 88
Enzyme specificity prediction using cross-attention graph neural networks
Cui, H., Su, Y., Dean, T. J., Yu, T., Zhang, Z., Peng, J., Shukla, D., & Zhao, H. (2025) · Nature · doi:10.1038/s41586-025-09697-2 · Cited by 73
Metadata
- Authors
- Kroll, A., Ranjan, S., Engqvist, M. K. M., & Lercher, M. J.
- Affiliations
- Heinrich Heine University Düsseldorf (DE)
- Indian Institute of Technology Bombay (IN)
- EnginZyme (Sweden) (SE)
- Corresponding author
- Lercher, Martin J.
- Venue
- Nature Communications
- Published
- 2023-05-15
- Volume
- 14
- Issue
- 1
- Pages
- 2787-2787
- ISSN
- 2041-1723 (ISSN-L)
- PMC
- PMC10185530
- OpenAlex
- W4376601927
- Cited by
- 193
- References
- 73
- Citations by year
- 2026: 65 · 2025: 64 · 2024: 51 · 2023: 13
- FWCI
- 17.23
- Type
- journal article
- Language
- en
- Open access
- gold
- doi.org
- Locations
- Nature Communications (publishedVersion, cc-by)
- PubMed Central (publishedVersion, cc-by)
- PubMed (publishedVersion)
- Chalmers Research (Chalmers University of Technology) (submittedVersion, other-oa)
- RePEc: Research Papers in Economics (submittedVersion)
- DOAJ (DOAJ: Directory of Open Access Journals) (submittedVersion, cc-by-sa)
- Univ. Duesseldorf: Duesseldorfer Dokumenten- und Publikationsserver (submittedVersion, cc-by)
- Funders
- Deutsche Forschungsgemeinschaft (CRC 1310 + 390686111)
- Volkswagen Foundation
- Topics
- Life Sciences › Biochemistry, Genetics and Molecular Biology › Molecular Biology › Machine Learning in Bioinformatics
- Life Sciences › Pharmacology, Toxicology and Pharmaceutics › Drug Discovery › Computational Drug Discovery Methods
- Life Sciences › Biochemistry, Genetics and Molecular Biology › Molecular Biology › Enzyme Catalysis and Immobilization
- Keywords
- enzyme catalysis, transformer models, deep learning, metabolites
- MeSH terms
- Machine Learning, Deep Learning, Catalysis, Proteins, Support Vector Machine
About these checks
Registry, retraction, Cites and statistics results are computed, not judged, with one exception: a printed reference that no index lists is read once by a model before it counts as a citation error. Claims are extracted by a model and kept only when their quote appears verbatim in the text; each cited source is then checked, with a model’s help, for whether it says what the claim relies on. Those verdicts can be wrong — read the claim’s quote and the cited source before relying on one.
Statistics and arithmetic are recomputed, not judged.
Confidence bands are shown only for fields calibrated on our annotated test set. None is calibrated yet, so no band is shown.
What counts as a claim ›How we measure confidence ›How we check this ›
Are you an author, or do you see a problem with this page? Request a review
